Distribution Boards Market by Voltage Rating (Low Voltage, Medium Voltage), End-User (Transmission & Distribution Utilities, Manufacturing & Processing Industry, Commercial & Residential Sector, and Others), and Region - Global Forecast and Trends to 2021


[145 Pages Report] The global distribution boards market is estimated to record a market size of USD 4.33 Billion in 2016, and is projected to grow at a CAGR of 6.4% from 2016 to 2021, to reach USD 5.91 Billion by 2021. Market growth is driven by factors such as the growing need to protect electrical components and networks, increasing global electricity demand, subsequent investments in renewable power plants, and increasing construction and infrastructural activities across the globe. The market is segmented by voltage rating, end-user, and region.
The years considered for the study are as follows:
- Base Year � 2015
- Estimated Year � 2016
- Projected Year � 2021
- Forecast Period � 2016 to 2021
2015 has been considered as the base year for company profiles in the report. Wherever information was unavailable for the base year, the prior year has been considered.
Research Methodology
- Analysis of key operational and upcoming electric distribution board projects across the globe, along with voltage ratings
- Analysis of country-wise electrification rates for the past 3 years
- Analysis of grid upgrades and integration across various regions
- Analysis of power infrastructure projects and trends related to construction and infrastructural activities across various regions
- Estimation of the installation cost of distribution boards in various regions using cost variance models
- Estimation of the total market size of distribution boards using the market engineering process
- Analysis of market trends in various regions/countries according to current power distribution spending in respective regions/countries
- Overall market size values have been finalized using the supply-side data, which includes recent market developments and annual global sales of distribution boards
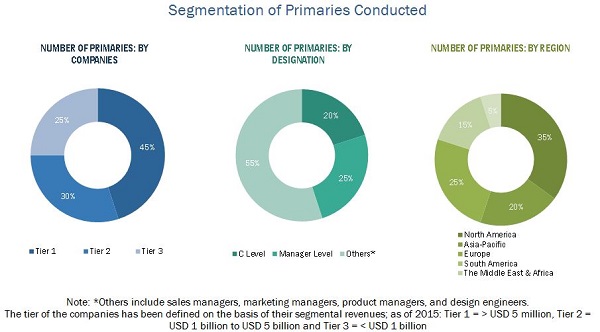
After arriving at the overall market size, the total market has been split into several segments and subsegments. The figure below provides a breakdown of primaries conducted during the research study, on the basis of company type, designation, and region.
To know about the assumptions considered for the study, download the pdf brochure
Market Ecosystem:
The ecosystem of the distribution boards market is often categorized into in-house and outsourced tasks. In-house activities mainly focus on critical aspects and components of a product, while the required auxiliary parts are usually outsourced. The basic components of the power distribution board are manufactured during this stage; these include the contacts and the tripping mechanism. The components are then assembled according to the required specification during the assembly stage. All parts are configured before the final packaging of the product. The product is introduced in the market through the process of distribution, marketing, and sales.

The original equipment manufacturers (OEMs) of distribution boards include ABB Ltd. (Switzerland), Eaton Corporation (Ireland), General Electric (U.S.), Schneider Electric SE (France), and Siemens AG (Germany).
Target Audience:
- Distribution board manufacturers, dealers, and suppliers
- Transmission & distribution utilities
- State and national regulatory authorities
- Power generation plants
- Consulting companies and associations in the energy & power sector
- Government and research organizations
- Energy associations
- Investment banks
�The study answers several questions for stakeholders, primarily which market segments to focus on in the next 2�5 years for prioritizing efforts and investments�.
Scope of the Report:
- By Voltage Rating
- Low Voltage
- Medium Voltage
- By End-User
- Transmission & Distribution Utilities
- Manufacturing & Process Industries
- Commercial & Residential Infrastructure
- Others, including Marine, Mining, Offshore, Transportation, and Power Generation
- By Region
- Asia-Pacific
- North America
- South America
- Europe
- Middle East & Africa
Available Customizations:
With the given market data, MarketsandMarkets offers customizations as per the client�s specific needs. The following customization options are available for this report:
Regional Analysis
- Further breakdown of the Rest of Asia-Pacific distribution boards industry into South Korea, Malaysia, and Indonesia, among others
- Further breakdown of the Middle East & African distribution boards industry into Iran, Iraq, Qatar, Nigeria, and Algeria, among others
Company Information
- Detailed analysis and profiling of additional market players (Up to 5)
The global distribution boards market is projected to reach USD 5.91 Billion by 2021, growing at a CAGR of 6.4% from 2016 to 2021. This growth can be attributed to the rise in construction and infrastructural activities, increasing power generation, and increasing upgradation of transmission & distribution infrastructure, triggered by the rising energy demand.
The report segments the distribution panels market on the basis of voltage rating into low and medium voltage. The medium voltage segment is expected to grow at the highest CAGR during the forecast period. This can be credited to the increasing investments in transmission & distribution infrastructure, renewable power plants, and construction and infrastructural activities. However, the demand for low voltage distribution panels is also set to increase rapidly, given the increasing access to electricity in countries such as India, South Africa, and Nigeria.
Based on end-user, the electrical distribution boards has been segmented into transmission & distribution utilities, manufacturing & processing industry, commercial & residential sector, and others, which include marine, transportation (rail traction systems, ports, and airports), mining, and offshore applications. The transmission & distribution utilities segment recorded the largest market size in 2015. The transmission & distribution infrastructure in developed economies in North America and Europe is aging and outdated. These economies are modernizing their grids and replacing old installations. Investments in offshore wind farms, which increase their capacity, are also expected to drive the market.
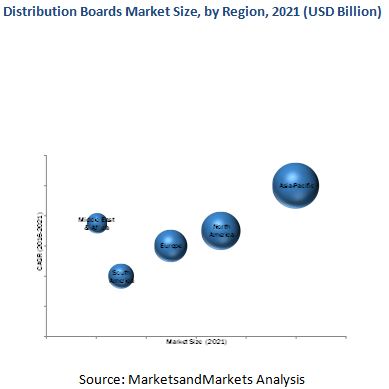
Asia-Pacific is estimated to lead the distribution panels market, owing to increased electrification rates, urbanization, and industrialization, which propel the demand for electrical distribution boards. China dominated the global market in 2015, on account of extensive upgradation of electrical infrastructure and installation of new transmission & distribution lines. China and India are estimated to be the fastest-growing markets for distribution panel boards in the region from 2016 to 2021. The figure given below indicates the market size of various regions by 2021, with their respective CAGRs during the forecast period.
Delays in grid expansion projects are restraining the growth of the market. These delays create panic among vendors involved in the projects, as they extend the delivery cycles. They also affect the financial condition of the vendors, owing to deferred payments from utilities. This hinders the demand for substations and distribution boards.
Some of the leading players in the distribution boards market are ABB Ltd. (Switzerland), Siemens AG (Germany), General Electric (U.S.), Schneider Electric SE (France), and Siemens AG (Germany). New product launch was the strategy most commonly used by top players in the market from 2012 to 2016, followed by contracts & agreements, expansion, and other developments.
To speak to our analyst for a discussion on the above findings, click Speak to Analyst
 Exclusive indicates content/data unique to MarketsandMarkets and not available with any competitors.
Table Of Contents
1 Introduction (Page No. - 14)
1.1 Objectives Of the Study
1.2 Market Definition
1.3 Market Scope
1.3.1 Markets Covered
1.3.2 Years Considered for the Study
1.4 Currency
1.5 Limitations
1.6 Stakeholders
2 Research Methodology (Page No. - 16)
2.1 Research Data
2.1.1 Secondary Data
2.1.1.1 Key Data From Secondary Sources
2.1.2 Primary Data
2.1.2.1 Key Data From Primary Sources
2.1.2.2 Key Industry Insights
2.1.2.3 Breakdown Of Primaries
2.2 Market Size Estimation
2.2.1 Bottom-Up Approach
2.2.2 Top-Down Approach
2.3 Market Breakdown & Data Triangulation
2.4 Research Assumptions & Limitations
2.4.1 Assumptions
2.4.2 Limitations
3 Executive Summary (Page No. - 24)
3.1 Introduction
3.1.1 Historical Backdrop
3.2 Current Scenario
3.3 Future Outlook
3.4 Conclusion
4 Premium Insights (Page No. - 28)
4.1 Attractive Market Opportunities for Distribution Boards
4.2 Transmission & Distribution Utilities End-User Segment Led the Distribution Boards in 2015
4.3 Asia-Pacific Accounted for the Largest Market for Distribution Boards in 2015
4.4 Asia-Pacific Dominated the Distribution Boards in 2015
4.5 Medium Voltage Segment is Expected to Dominate the Distribution Boards Market During the Forecast Period
5 Market Overview (Page No. - 32)
5.1 Introduction
5.2 Market Segmentation
5.3 Market Dynamics
5.3.1 Drivers
5.3.1.1 Protection Of Electrical Devices & Network Components
5.3.1.2 Increasing Construction & Infrastructural Activities
5.3.1.3 Increasing Access to Electricity
5.3.2 Restraints
5.3.2.1 Product Failures
5.3.3 Opportunities
5.3.3.1 Growth in Renewable Power Generation
5.3.3.2 Adoption Of Smart Grid Technology
5.3.3.3 Aging Power Infrastructure
5.3.4 Challenges
5.3.4.1 Delays in Grid Expansion Projects
6 Technical Overview (Page No. - 39)
6.1 Introduction
6.1.1 International Electrotechnical Commission (IEC)
6.1.2 Institute Of Electrical and Electronics Engineers (IEEE)
6.1.3 National Electrical Manufacturers Association (NEMA)
6.1.4 American National Standards Institute (ANSI)
6.1.5 International Organization for Standardization (ISO)
6.1.6 National Fire Protection Association (NFPA)
6.2 Standards Based on Components
6.3 Type Testing
6.3.1 7 Type Tests
6.3.2 3 Routine Tests
6.3.2.1 Different Forms Of Internal Separation
6.4 Modularity
7 Industry Trends (Page No. - 44)
7.1 Introduction
7.2 Value Chain Analysis
7.3 Porter�s Five Forces Analysis
7.3.1 Threat Of Substitutes
7.3.2 Bargaining Power Of Buyers
7.3.3 Bargaining Power Of Suppliers
7.3.4 Threat Of New Entrants
7.3.5 Intensity Of Competitive Rivalry
8 Distribution Boards Market, By Voltage Rating (Page No. - 49)
8.1 Introduction
8.2 Medium Voltage Distribution Boards
8.3 Low Voltage Distribution Boards
9 Distribution Boards, By End-User (Page No. - 53)
9.1 Introduction
9.2 Transmission & Distribution Utilities
9.3 Manufacturing & Processing Industry
9.4 Commercial & Residential Sector
9.5 Other End-Users
10 Distribution Boards, By Region (Page No. - 59)
10.1 Introduction
10.2 Asia-Pacific
10.2.1 By Voltage Rating
10.2.2 By End-User
10.2.2.1 By Country
10.2.2.1.1 China
10.2.2.1.2 India
10.2.2.1.3 Japan
10.2.2.1.4 Australia
10.2.2.1.5 Rest Of Asia-Pacific
10.3 North America
10.3.1 By Voltage Rating
10.3.2 By End-User
10.3.2.1 By Country
10.3.2.1.1 The U.S.
10.3.2.1.2 Canada
10.3.2.1.3 Mexico
10.4 Europe
10.4.1 By Voltage Rating
10.4.2 By End-User
10.4.2.1 By Country
10.4.2.1.1 Russia
10.4.2.1.2 Germany
10.4.2.1.3 The U.K.
10.4.2.1.4 France
10.4.2.1.5 Rest Of Europe
10.5 Middle East & Africa
10.5.1 By Voltage Rating
10.5.2 By End-User
10.5.2.1 By Country
10.5.2.1.1 Saudi Arabia
10.5.2.1.2 South Africa
10.5.2.1.3 Qatar
10.5.2.1.4 UAE
10.5.2.1.5 Kuwait
10.5.2.1.6 Rest Of Middle East & Africa
10.6 South America
10.6.1 By Voltage Rating
10.6.2 By End-User
10.6.2.1 By Country
10.6.2.1.1 Brazil
10.6.2.1.2 Argentina
10.6.2.1.3 Rest Of South America
11 Competitive Landscape (Page No. - 97)
11.1 Overview
11.2 Competitive Situation & Trends
11.2.1 Contracts & Agreements
11.2.2 New Product/Technology Developments
11.2.3 Mergers & Acquisitions
11.2.4 Expansions
12 Company Profiles (Page No. - 104)
12.1 Introduction
(Business Overview, Products & Services, Key Insights, Recent Developments, SWOT Analysis, Ratio Analysis, MnM View)*
12.2 Eaton Corporation PLC.
12.3 General Electric
12.4 Siemens AG
12.5 ABB Limited
12.6 Schneider Electric
12.7 Larsen & Toubro
12.8 Legrand
12.9 Hager
12.10 NHP Electrical Engineering Products Pty Ltd.
12.11 Industrial Electric Mfg. (IEM)
12.12 ESL Power Systems
12.13 East Coast Power Systems Limited
12.14 Arabian Gulf Switchgear
*Details on Business Overview, Products & Services, Key Insights, Recent Developments, SWOT Analysis, MnM View Might Not Be Captured in Case Of Unlisted Companies.
13 Appendix (Page No. - 137)
13.1 Insights Of Industry Experts
13.2 Discussion Guide
13.3 Knowledge Store: Marketsandmarkets� Subscription Portal
13.4 Introducing RT: Real-Time Market Intelligence
13.5 Available Customizations
13.6 Related Reports
List Of Tables (73 Tables)
Table 1 Access to Electricity in 2013
Table 2 Distribution Boards Market Size, By Voltage Rating, 2014�2021 (USD Million)
Table 3 Medium Voltage: Market Size, By Region, 2014�2021 (USD Million)
Table 4 Low Voltage: Market Size, By Region, 2014�2021 (USD Million)
Table 5 Market Size, By End-User, 2014�2021 (USD Million)
Table 6 Transmission & Distribution Utilities: Market Size, By Region, 2014�2021 (USD Million)
Table 7 Manufacturing & Processing Industry: Market Size, By Region, 2014�2021 (USD Million)
Table 8 Commercial & Residential: Market Size, By Region, 2014�2021 (USD Million)
Table 9 Other End-Users: Market Size, By Region, 2014�2021 (USD Million)
Table 10 Market Size, By Region, 2014�2021 (USD Million)
Table 11 Asia-Pacific: Market Size, By Country, 2014�2021 (USD Million)
Table 12 Asia-Pacific: Market Size, By Voltage Rating, 2014�2021 (USD Million)
Table 13 Asia-Pacific: Market Size, By End-User, 2014�2021 (USD Million)
Table 14 China: Market Size, By Voltage Rating, 2014�2021 (USD Million)
Table 15 China: Market Size, By End-User, 2014�2021 (USD Million)
Table 16 India: Market Size, By Voltage Rating, 2014�2021 (USD Million)
Table 17 India: Market Size, By End-User, 2014�2021 (USD Million)
Table 18 Japan: Market Size, By Voltage Rating, 2014�2021 (USD Million)
Table 19 Japan: Market Size, By End-User, 2014�2021 (USD Million)
Table 20 Australia: Market Size, By Voltage Rating, 2014�2021 (USD Million)
Table 21 Australia: Market Size, By End-User, 2014�2021 (USD Million)
Table 22 Rest Of Asia-Pacific: Market Size, By Voltage Rating, 2014�2021 (USD Million)
Table 23 Rest Of Asia-Pacific: Market Size, By End-User, 2014�2021 (USD Million)
Table 24 North America: Market Size, By Country, 2014�2021 (USD Million)
Table 25 North America: Market Size, By Voltage Rating, 2014�2021 (USD Million)
Table 26 North America: Market Size, By End-User, 2014�2021 (USD Million)
Table 27 U.S.: Market Size, By Voltage Rating, 2014�2021 (USD Million)
Table 28 U.S.: Market Size, By End-User, 2014�2021 (USD Million)
Table 29 Canada: Market Size, By Voltage Rating, 2014�2021 (USD Million)
Table 30 Canada: Market Size, By End-User, 2014�2021 (USD Million)
Table 31 Mexico: Market Size, By Voltage Rating, 2014�2021 (USD Million)
Table 32 Mexico: Market Size, By End-User, 2014�2021 (USD Million)
Table 33 Europe: Market Size, By Country, 2014�2021 (USD Million)
Table 34 Europe: Market Size, By Voltage Rating, 2014�2021 (USD Million)
Table 35 Europe: Market Size, By End-User, 2014�2021 (USD Million)
Table 36 Russia: Market Size, By Voltage Rating, 2014�2021 (USD Million)
Table 37 Russia: Market Size, By End-User, 2014�2021 (USD Million)
Table 38 Germany: Market Size, By Voltage Rating, 2014�2021 (USD Million)
Table 39 Germany: Market Size, By End-User, 2014�2021 (USD Million)
Table 40 U.K.: Market Size, By Voltage Rating, 2014�2021 (USD Million)
Table 41 U.K.: Market Size, By End-User, 2014�2021 (USD Million)
Table 42 France: Market Size, By Voltage Rating, 2014�2021 (USD Million)
Table 43 France: Market Size, By End-User, 2014�2021 (USD Million)
Table 44 Rest Of Europe: Market Size, By Voltage Rating, 2014�2021 (USD Million)
Table 45 Rest Of Europe: Market Size, By End-User, 2014�2021 (USD Million)
Table 46 Middle East & Africa: Market Size, By Country, 2014�2021 (USD Million)
Table 47 Middle East & Africa: Market Size, By Voltage Rating, 2014�2021 (USD Million)
Table 48 Middle East & Africa: Market Size, By End-User, 2014�2021 (USD Million)
Table 49 Saudi Arabia: Market Size, By Voltage Rating, 2014�2021 (USD Million)
Table 50 Saudi Arabia: Market Size, By End-User, 2014�2021 (USD Million)
Table 51 South Africa: Market Size, By Voltage Rating, 2014�2021 (USD Million)
Table 52 South Africa: Market Size, By End-User, 2014�2021 (USD Million)
Table 53 Qatar: Market Size, By Voltage Rating, 2014�2021 (USD Million)
Table 54 Qatar: Market Size, By End-User, 2014�2021 (USD Million)
Table 55 UAE: Market Size, By Voltage Rating, 2014�2021 (USD Million)
Table 56 UAE: Market Size, By End-User, 2014�2021 (USD Million)
Table 57 Kuwait: Market Size, By Voltage Rating, 2014�2021 (USD Million)
Table 58 Kuwait: Market Size, By End-User, 2014�2021 (USD Million)
Table 59 Rest Of Middle East & Africa: Market Size, By Voltage Rating, 2014�2021 (USD Million)
Table 60 Rest Of Middle East & Africa: Market Size, By End-User, 2014�2021 (USD Million)
Table 61 South America: Market Size, By Country, 2014�2021 (USD Million)
Table 62 South America: Market Size, By Voltage Rating, 2014�2021 (USD Million)
Table 63 South America: Market Size, By End-User, 2014�2021 (USD Million)
Table 64 Brazil: Market Size, By Voltage Rating, 2014�2021 (USD Million)
Table 65 Brazil: Market Size, By End-User, 2014�2021 (USD Million)
Table 66 Argentina: Market Size, By Voltage Rating, 2014�2021 (USD Million)
Table 67 Argentina: Market Size, By End-User, 2014�2021 (USD Million)
Table 68 Rest Of South America: Market Size, By Voltage Rating, 2014�2021 (USD Million)
Table 69 Rest Of South America: Market Size, By End-User, 2014�2021 (USD Million)
Table 70 Contracts & Agreements, 2014�2016
Table 71 New Product Developments, 2014�2016
Table 72 Mergers & Acquisitions, 2012�2015
Table 73 Expansions, 2014�2015
List Of Figures (44 Figures)
Figure 1 Distribution Board Industry Segmentation
Figure 2 Distribution Boards: Research Design
Figure 3 Bottom-Up Approach
Figure 4 Top-Down Approach
Figure 5 Data Triangulation Methodology
Figure 6 Asia-Pacific Dominated the Distribution Boards in 2015
Figure 7 Market: Voltage Rating Snapshot (USD Million)
Figure 8 Transmission & Distribution Utilities End-User Segment Generated the Highest Demand for Distribution Boards in 2015
Figure 9 Top Regions in the Market, By End-User, 2016-2021 (USD Million)
Figure 10 Attractive Market Opportunities for Distribution Boards in Transmission & Distribution Utilities End-User Segment During the Forecast Period
Figure 11 Transmission & Distribution Utilities Projected to Be the Fastest Growing End-User Segment During the Forecast Period
Figure 12 Medium Voltage Segment Dominated the Asia-Pacific Market in 2015
Figure 13 China Accounted for the Largest Market Share (Value) in 2015
Figure 14 Medium Voltage Distribution Boards Segment is Expected to Grow at the Highest CAGR During the Forecast Period
Figure 15 Distribution Board Industry Segmentation
Figure 16 Increased Construction & Infrastructural Activities to Drive the Distribution Boards Industry
Figure 17 Forms Of Internal Separation
Figure 18 Value Chain Analysis: Major Value is Added During the Manufacturing & Assembly Process
Figure 19 Porter�s Five Forces Analysis: Distribution Boards
Figure 20 Medium Voltage Segment is Projected to Dominate the Distribution Boards Industry During the Forecast Period
Figure 21 Market Share (Value), By End-User, 2015
Figure 22 Transmission & Distribution Utilities and Manufacturing & Processing Industry Segments Constitute More Than 60% Of the Distribution Boards Industry
Figure 23 Regional Snapshot: Asia-Pacific is Projected to Be the Fastest Growing Market, in Terms Of Value, During the Forecast Period
Figure 24 Market Share (Value), By Region, 2015
Figure 25 Asia-Pacific & North America are Projected to Dominate the Distribution Boards Industry During the Forecast Period
Figure 26 Asia-Pacific: Market Overview
Figure 27 North America: Market Overview
Figure 28 Companies Adopted Contracts & Agreements and New Product Developments to Capture the Market
Figure 29 Battle for Market Share: New Product Launch Was the Key Strategy, 2013�March 2016
Figure 30 Schneider Electric Accounted for the Maximum Share in the Distribution Board Market, Based on Developments, 2012�2016
Figure 31 Market Evaluation Framework: Contracts & Agreements, Expansions, and New Product Launches Fueled the Growth Of Companies From 2013 to March 2016
Figure 32 Region-Wise Revenue Mix Of the Top 5 Market Players
Figure 33 Eaton Corporation PLC.: Company Snapshot
Figure 34 Eaton Corporation PLC.: SWOT Analysis
Figure 35 General Electric: Company Snapshot
Figure 36 General Electric: SWOT Analysis
Figure 37 Siemens AG: Company Snapshot
Figure 38 Siemens AG: SWOT Analysis
Figure 39 ABB Limited: Company Snapshot
Figure 40 ABB Ltd. : SWOT Analysis
Figure 41 Schneider Electric: Company Snapshot
Figure 42 Schneider Electric SE: SWOT Analysis
Figure 43 Larsen & Toubro: Company Snapshot
Figure 44 Legrand: Company Snapshot


Growth opportunities and latent adjacency in Distribution Boards Market
Very informative article. Good information on Distribution Boards Market.