Distributed Temperature Sensing Market Size, Share & Industry Growth Analysis Report by Operating Principle (OTDR, OFDR), Fiber Type (Single-mode Fibers, Multimode Fibers), Scattering Method (Rayleigh Effect, Raman Effect, Brillouin Effect), Application, and Geography - Global Forecast to 2025


The global distributed temperature sensing market size is projected to reach USD 958 million by 2025, growing at a CAGR of 5.5% during the forecast period. Improvements in the deployment expertise of DTS equipment and service providers have also propelled the adoption of these systems. Since DTS systems record the temperatures along the optical sensor cable as a continuous profile, they provide extensive coverage and make it easy for the operators to monitor for identical faults in the line.
 Systems Market Forecast to 2025")
Distributed Temperature Sensing (DTS) Systems Market Forecast to 2025
To know about the assumptions considered for the study, Request for Free Sample Report
DTS systems refer to the devices that use optical fiber cables for measuring temperature. In DTS systems, the optical cable acts as a multipoint temperature sensor and provides cost-effective temperature measurement along its entire length and not at particular points.
This property increases the reliability of DTS systems. The benefit of using DTS systems is that they provide real-time temperature measurement. DTS systems provide more accurate and faster temperature measurement with high resolution in comparison with other conventional temperature measurement systems such as resistance temperature detectors (RTDs) and thermocouples. Industries such as oil & gas and pipeline transportation require temperature sensing systems for monitoring purposes that can operate at high temperatures and harsh working environments and are immune to electromagnetic interferences. DTS systems are considered as the best option for such applications.
Increasing safety norms and supportive government policies related to leakage detection and growing adoption of data-based analysis are expected to provide substantial growth opportunities to the players in the DTS market. With regulations regarding emission standards getting stringent over time, the demand for distributed fiber optic sensors will increase primarily because of their capability to monitor leaks from pipelines and consequently playing a significant role in monitoring emission standards. The reliability of DTS systems/sensors for sensing and monitoring applications in harsh environments is one of the major factors that is expected to accelerate the growth of the DTS market.
Distributed Temperature Sensing Market Dynamics:
Driver: Increasing demand for labor safety at working sites
The reputation of a company in the market depends largely on the safety of its personnel and equipment. This has made safety and protection a top priority for organizations. As per the data provided by the International Association of Drilling Contractors (IADC), the total recorded incidence rate per 200,000 man-hours increased from 0.46 in 2016 to 0.68 in 2018.
The implementation of DTS systems helps in improving safety in various working conditions; these systems are ideal for use in hazardous environments. Safety systems rely on accurate and reliable fire detection, which makes DTS technology an appropriate choice for various industries. The prime benefit of using DTS systems is that they provide real-time temperature monitoring along the entire length of a cable instead of particular points and acts as an effective fire detection unit. The ability to withstand extreme conditions makes DTS systems inevitable for improving safety systems. This is one of the key driving factors for the growth of the market
Restraint: Optical cables are prone to physical damage
DTS systems use optical cables that have low strain sensitivity. Any bending during installation can damage these systems. The optical fiber cables must be carefully installed; else, the fiber may break. Though the design of sensor cables has improved tremendously, improper cable deployment can cause the failure of the entire DTS system.
Since the installation of DTS systems requires huge investments, such failures can lead customers to turn away from the technology for future projects. Thus, cable deployment requires special care while installing DTS systems. The occurrence of technical issues during the deployment of sensor cables is one of the restraining factors for the growth of the DTS market.
However, in the coming years, advancements in technologies are expected to reduce the physical damages to optical cables, which would, in turn, reduce the impact of this factor on the DTS market.
Opportunity: Increasing safety norms and supportive government policies related to leakage detection
Rapid urbanization and industrialization have not only boosted construction activities but have also increased the risks associated with them. Construction sites and industrial plants consist of large electrical wirings, and even a small spark can pose a threat to the people working and living in the surrounding areas.
Similarly, pipelines used in the transportation of oil and gas pose a severe threat to the employees as well as people living nearby, as a small leakage can cause huge damages.
Leaking equipment, including valves, pumps, connectors, sampling connectors, compressors, pressure relief devices, and open-ended lines used in various industries, are the major sources of emission of volatile organic compounds (VOCs) and volatile hazardous air pollutants (VHAPs). Refineries and the chemicals industry are the major sources of these leaks.
Acetaldehyde, benzene, formaldehyde, methylene chloride, naphthalene, toluene, and xylene are the major VHAPs and VOCs emitted from leaks. Valves and connectors account for more than 90% of emissions from leaks. To detect and repair leaks, a leak detection and repair (LDAR) program is implemented, where the leaking component is replaced with a new component. The primary use of distributed optical sensing systems is to detect pipeline leaks that can pollute the environment.
With regulations regarding emission standards getting stringent, the demand for distributed fiber optic sensors will increase primarily because of their capability to monitor leaks from pipelines and consequently playing a major role in monitoring emission standards. Thus, an increasing number of companies are implementing DTS systems for safety purposes. Organizations such as Occupational Safety and Health Administration (OSHA) and National Fire Protection Association (NFPA) are working for the safety of people and prevention of fires, thereby promoting the use of fire safety equipment in workplaces.
Challenge: High costs associated with DTS systems
DTS systems enable companies to gather real-time data with high accuracy in difficult work environments. The market is growing because of the various advantages of these systems, such as accuracy and reliability. However, the cost of this technology is relatively high.
Depending on the application, the type of cables used, and the operating conditions, the price of a DTS system varies, which may not be affordable for some companies that require real-time temperature sensing. Additionally, the installation and maintenance of these systems are also expensive, which makes their implementation difficult. Thus, the cost of DTS systems poses a significant challenge for the growth of this market.
The rising number of hacking incidents is also a matter of concern since they have limited security mechanisms. Companies in the drone industry provide analytics software-as-a-service to their clients, which requires cloud-based servers to process data. Since the data is transmitted and stored in an external cloud network, it is prone to hacking. Industries also need highly secured cloud servers for data security. Therefore, data security and data encryption concerns act as a challenge for the UAV market.
Distributed Temperature Sensing Market Segment Insights:
 Systems Market Segment Insights")
Based on point of sale, the DTS market includes the company’s distributed temperature sensing systems manufacturers. The increasing demand for labor safety at working sites is one of the significant factors driving the growth of this market. In addition, increasing applications in the oil & gas industry are also expected to influence the growth of the DTS market during the forecast period.
Based on Fiber Type, the multimode fibers segment registered the largest share in 2020
Based on fiber type, the DTS market is segmented into single-mode fibers and multimode fibers. The market for multimode fibers was valued at USD 607 million in 2019 and is projected to reach USD 852 million by 2025; it is expected to grow at a CAGR of 5.7% during the forecast period.
Multimode fiber based DTS systems are widely used in the oil and gas production applications because of their relative simplicity pertaining to the large diametric cores that help in multiple modes of light to propagate and their ability to provide accurate data on temperatures. The large diameter of multimode fibers also allows for more optical power to be launched in the fiber. Since DTS involves the measurement of backscattered light along the fiber length, the ability of multimode fibers to use high-power sources is an advantage over single-mode fibers.
Based on application, the fire detection segment to witness highest CAGR of market during the forecast.
Based on application, the distributed temperature sensing market is segmented into oil & gas, power cable monitoring, fire detection, process & pipeline monitoring, environmental monitoring, and other applications.
The distributed temperature sensing market for oil & gas was valued at USD 380 million in 2019 and is projected to reach USD 461 million by 2025; it is expected to grow at a CAGR of 3.1% from 2020 to 2025. DTS systems can provide underground vertical thermal profile at different depths. Using DTS systems, detection with a temperature resolution of 0.10°C and a spatial resolution of 1 meter is possible. These measurements are necessary for drilling operations, reservoir monitoring, and well completion activities. The increase in safety norms for various operations in different industries is driving the implementation of DTS systems. DTS systems play an important role in fire detection; these systems can detect the increase in temperatures and avoid major damages to equipment and surroundings.
Based on Operating Principle, optical time domain reflectometry (OTDR) segment accounted to hold largest share
The optical time domain reflectometry (OTDR) segment is expected to hold the largest size of the distributed temperature sensing market, by operating principle, in 2020. The distributed temperature sensing market for OTDR was valued at USD 652 million in 2019 and is projected to reach USD 909 million by 2025.
The OTDR operating principle is used in a majority of DTS systems. It helps in providing robust measurement and is less susceptible to issues such as reflections and bends in fibers and accessories. It also provides a long measurement range that satisfies the criteria of all applications. Compared to OTDR systems, OFDR systems can achieve a higher signal-to-noise ratio due to the narrowband detection of the backscatter signal and the quasi-continuous wave mode employed by the laser.
Distributed Temperature Sensing Market Regional Insights:
The North America region is projected to Grow at second highest CAGR during the forecast period
The growth of the DTS market in North America can be attributed to the presence of major players in the region, such as Schlumberger Limited (US), Halliburton Company (US), and OFS Fitel (US), is one of the key drivers for the demand for DTS systems in this region.
Moreover, the increasing construction activities worldwide and the expanding power transmission cables in technologically advancing countries in North America such as US and Canada are contributing to the growth of the DTS market in this region. This serves to be one of the most significant factors driving the growth of the DTS market in the region.
By 2027, Asia Pacific is projected to grow with the fastest CAGR in the forecast period
 Systems Market by Region")
Distributed Temperature Sensing (DTS) Systems Market by Region
To know about the assumptions considered for the study, download the pdf brochure
The US accounted for the largest share of the North American DTS market in 2019. The development of horizontal drilling and hydraulic fracturing technology has boosted the growth of the market for shale gas in the US and has made the country one of the top exporters of petroleum products globally.
These factors are contributing to the growth of the DTS market in the US. According to the Energy Information Administration (EIA), US, the US ranked first in terms of production of petroleum and other liquids (including biofuels, liquids derived from coal and oil shale, and refinery gain) globally in 2019. Along with the increase in fire protection and other safety measures, the Canadian Standards Association has published the Canadian Electrical Code that defines the safety standards for electrical installations and power distribution and transmission circuits.
Key Market Players in Distributed Temperature Sensing Industry
Some of the Major players in the DTS market areSchlumberger Limited (US), Halliburton Company (US), Yokogawa Electric Corporation (Japan), Weatherford International PLC (Switzerland), Sumitomo Electric Industries (Japan).These players have adopted various growth strategies such as contracts, collaboration, joint ventures, partnerships & agreements, and new product launches to further expand their presence in the DTS market.
Schlumberger Limited (Schlumberger NV, incorporated in Curacao) is one of the world’s leading providers of technologies for reservoir characterization, drilling, production, and processing to the oil & gas industry. It is one of the major suppliers of technologies, integrated project management, and information solutions to the oil & gas exploration and production industry worldwide. As of December 31, 2019, the company has approximately 105,000 employees, generates revenue in more than 120 countries, and has executive offices in Paris, Houston, London, and The Hague. The company has its presence in North America, Latin America, Europe/Commonwealth of Independent States (CIS)/Africa, the Middle East, and Asia.
Halliburton Company is one of the major companies in the energy sector that provides products and services for the exploration, development, and production of natural gas and oil. Halliburton established its first research laboratory in 1930. In 1951, the company opened its first branch in Europe, and it further divided its operations into completion and production, and drilling and evaluation in 2007. The company has 14 product service lines (PSLs) and operates through two segments—Completion and Production, and Drilling and Evaluation. Through the Completion and Production segment, the company offers services such as cementing, stimulation, intervention, pressure control, specialty chemicals, artificial lift, and completion products and services. Through the Drilling and Evaluation segment, it provides services such as field and reservoir modeling, drilling, evaluation, and precise wellbore placement solutions. The company’s customers include some of the top oil and gas companies worldwide. It provides distributed temperature systems under its intervention services portfolio in the Completion and Production segment. The company offers FiberWatch DTS for distributed temperature monitoring in various applications, e.g., heavy oil thermal environments. It measures temperature, pressure, and strain using distributed fiber optic technology. StimWatch Service and FlowWatch service are the two types of distributed sensing services used by the company to provide real-time updates on the data collected on temperature or pressure. Its distributed fiber sensors are ISO 9001-certified.
Distributed Temperature Sensing Market Report Scope:
|
Report Metrics |
Details |
| Market Size Value in 2019 | USD 691 million |
| Revenue Forecast in 2025 | USD 958 million |
| Growth Rate | 5.5% |
|
Market size available for years |
2017–2025 |
|
Base year |
2019 |
|
Forecast period |
2020–2025 |
|
Units |
Value (USD million/billion), shipment (million units) |
|
Segments covered |
operating principle, fiber type, scattering method, application, and region |
|
Geographic regions covered |
North America, APAC, Europe, and RoW |
|
Companies covered |
Schlumberger Limited (US), Halliburton Company (US), Yokogawa Electric Corporation (Japan), Weatherford International PLC (Switzerland), Sumitomo Electric Industries (Japan), OFS Fitel (US), AP Sensing GmbH (Germany), Bandweaver Technologies (China), NKT Photonics (Germany), GESO GmbH & Co. (Germany), Sensornet Ltd. (UK), Omnisens SA (Switzerland), Tendeka (UK), Silixa Ltd. (UK), Inventec B.V. (Netherlands), Omicron Electronics (Austria), AFL (US), Micron Optics (US), AVENCOM (Kazakhstan), Optromix, Inc. (US), Ziebel AS (US), SelkerMetrics, LLC (US), Fluves (Belgium), Intelligent Fiber Optic Systems Corp. (IFOS) (US), and AOMS Technologies (Canada) |
This report categorizes the distributed temperature sensing market into the following segments.
By Operating Principle:
- Optical Time Domain Reflectometry (OTDR)
- Optical Frequency Domain Reflectometry (OFDR)
By Fiber Type
- Single-mode Fibers
- Multimode Fibers
By Scattering Method:
- Rayleigh Scattering Effect
- Raman Scattering Effect
- Brillouin Scattering Effect
By Application:
-
Oil & Gas
- Upstream
- Downstream
- Power Cable Monitoring
- Fire Detection
- Process & Pipeline Monitoring
- Environmental Monitoring
By Region
-
North America
- US
- Canada
- Mexico
-
Europe
- UK
- Germany
- France
- Russia
- Rest of Europe (Denmark, Sweden, Greece, Spain, Italy, Finland, and Austria)
-
Asia Pacific (APAC)
- China
- Japan
- India
- South Korea
- Rest of APAC (Malaysia, Australia, New Zealand, Singapore, Hong Kong, Indonesia, and Taiwan)
-
Rest of the World (RoW)
- Middle East
- Africa
- South America
Distributed Temperature Sensing Market Trends Highlights:
 Systems Market by Highlights")
What is new?
- Major developments that can change the business landscape as well as market forecasts.
The companies involved in this DTS ecosystem has witnessed numerous technological advancements over the years in terms of scattering method and fiber type. Substantial investments have been made in the research & development and upgrades of DTS systems. It has also led to changes in their size, power, and performance of DTS systems.
-
Emerging Technology Trends
- Industry 4.0
- Industrial Internet of Things (IIOT)
- Artificial Intelligence and Machine Learning
- Big Data
- Real-Time Temperature Monitoring
- Real-Time Oil & Gas Leak Detection
- Addition/refinement in segmentation–Increase in depth or width of segmentation of the market.
-
Distributed Temperature Sensing Market, by Operating Principle
- Introduction
- Optical time domain reflectometry (OTDR)
- Optical frequency domain reflectometry (OFDR)
-
Distributed Temperature Sensing Market, by Fiber Type
- Introduction
- Single-Mode Fibers
- Multi-Mode Fibers
-
Distributed Temperature Sensing Market, By Application
- Introduction
- Fire Detection
- Pipeline Leakage Detection
- Process & Pipeline Monitoring
- Power Cable Monitoring
- Environmental Monitoring
-
Oil & Gas
- Upstream
- Downstream
- Rail Monitoring
-
Distributed Temperature Sensing Market, By Scattering Method
-
Introduction
- Rayleigh Scattering Effect
- Raman Scattering Effect
- Brillouin Scattering Effect
- Coverage of new market players and change in the market share of existing players of the DTS market.
Company profiles: Company profiles give a glimpse of the key players in the market with respect to their business overviews, financials, product offerings, recent developments undertaken by them, and MnM view. In the new edition of the report, we have total 25 players (15 major, 10 Startups/SME). Moreover, the share of companies operating in the DTS market and start-up matrix have also been provided in the report.
- Updated financial information and product portfolios of players operating in the DTS market.
Newer and improved representation of financial information: The new edition of the report provides updated financial information in the context of the DTS market till 2019/2020 for each listed company in the graphical representation in a single diagram (instead of multiple tables). This would help to easily analyze the present status of profiled companies in terms of their financial strength, profitability, key revenue-generating region/country, business segment focus in terms of the highest revenue-generating segment and investment on research and development activities.
- Updated market developments of the profiled players.
Recent Developments: Updated market developments such as contracts, joint ventures, partnerships & agreements, new product launches, investments, funding, and certification have been mapped for the years 2018 to 2020. For instance, in February 2020, SOCAR-AQS (Azerbaijan) and Halliburton signed a memorandum of understanding (MOU) to form a new joint venture to provide a broad suite of oilfield products and services in Azerbaijan.
- Any new data points/analysis (frameworks) which was not present in the previous version of the report
- Competitive benchmarking of startups /SME which covers details about employees, financial status, latest funding round and total funding.
- Technology analysis and case studies are added in this edition of the report to give the technological perspective and the significance of the advancements in DTS market
- The startup evaluation matrix is added in this edition of the report, covering DTS startups.
The new edition of the report consists of trends/disruptions on customer’s business, tariff & regulatory landscape, pricing analysis, and a market ecosystem map to enable a better understanding of the market dynamics for DTS.
Recent Developments in Distributed Temperature Sensing
- In January 2020, AP Sensing got a contract from the Delhi Metro Rail Corporation (DMRC) (India) for providing its Linear Heat Detection solution to monitor its phase III underground tunnel project. 13 DTS devices are in use for monitoring hotspots, tunnel temperatures that vary during congestion, and ventilation system operation modes in these tunnels.
- In January 2020, NKT Photonics introduced LIOS EN.SURE Real-Time Temperature Rating (RTTR) that enables customers to monitor and control the conductor temperature to avoid thermal damage in power cables.
- In December 2019, Yokogawa entered into a strategic alliance framework agreement to accelerate collaboration with Saudi Basic Industries Corporation (SABIC) (Saudi Arabia), one of the world’s largest petrochemical manufacturers. The agreement includes the appointment of Yokogawa as a preferred supplier of control systems for SABIC’s plants, for example, the ethylene plant (1,000 KT/year) in Jubail.
- In October 2019, OneSubSea, a subsidiary of Schlumberger, was awarded a contract by A/S Norske Shell (Norway), an oil & energy company. The company signed the agreement for an engineering, procurement, construction, and installation (EPCI) contract for the supply of a subsea multiphase compression system for the Ormen Lange Field in the Norwegian Sea.
- In October 2019, Halliburton signed a multiyear agreement with Repsol S.A. (Spain) to provide a cloud-based master data management solution for exploration and production (E&P) activities. The software as a service enables users to load, ingest, manage, and access log, well, and other E&P data across different locations for greater efficiency and productivity throughout Repsol’s asset portfolio.
- In October 2019, Yokogawa and ExRobotics B.V., a Netherlands-based developer of robotics technology for hazardous environments, signed a licensing agreement that will enable Yokogawa to sell and deploy ExRobotics’ inspection robot hardware and software platforms worldwide.
Key Benefits of the Report/Reason to Buy
The report would help market leaders/new entrants in the following ways:
- This report segments the distributed temperature sensing market comprehensively and provides the closest approximations of the overall and segment-based market sizes across different operating principles, scattering methods, fiber types, applications, and regions.
- The report would help stakeholders understand the pulse of the market and provide them with information on key drivers, restraints, challenges, and opportunities influencing the market growth.
- This report would help stakeholders understand their competitors better and gain more insights to enhance their market position. The competitive landscape section includes the competitive analysis of top players, as well as strategies such as product launches and developments, acquisitions, contracts, collaborations, agreements, partnerships, and expansions adopted by the major market players.
Target Audience
- Raw material suppliers
- DTS system manufacturers and distributors
- Original equipment manufacturers (OEMs)
- Device suppliers and distributors
- Software application providers
- Professional services/solutions providers
- Suppliers and distributors
- System integrators
- Middleware providers
- Assembly, testing, and packaging vendors
- Research institutes and organizations
- Technology standard organizations, forums, alliances, and associations
- Governments, financial institutions, and regulatory bodies
Frequently Asked Questions (FAQ):
What is the current size of the DTS market?
The DTS market is projected to grow from USD 691 million in 2019 to USD 958 million by 2025, at a CAGR of 5.7% from 2022 to 2027.
Who are the winners in the DTS market?
Schlumberger Limited (US), Halliburton Company (US), Yokogawa Electric Corporation (Japan), Weatherford International PLC (Switzerland), Sumitomo Electric Industries (Japan).
What are the drivers and opportunity leading towards the growth of the market?
Increasing demand for labor safety at working sites: The implementation of DTS systems helps in improving safety in various working conditions; these systems are ideal for use in hazardous environments.
Increasing adoption of data-based analytics: Globally, there is an increasing demand for the implementation of data-driven decision-making and strategy. It is done by finding a pattern out of data, which the managers can measure, and the insights are deciphered based on that, resulting in better decision-making and performance.
What are the factors restraining and challenging the growth of the market?
Optical cables are prone to physical damage: DTS systems use optical cables that have low strain sensitivity. Any bending during installation can damage these systems.
High costs associated with DTS systems: The cost of this technology is relatively high. Depending on the application, the type of cables used, and the operating conditions, the price of a DTS system varies, which may not be affordable for some companies that require real-time temperature sensing.
Which is the potential market for DTS in terms of the region?
North America region is expected to significantly dominate the DTS market owing to the high demand of DTS.
By operating principle, which segment is expected to grow?
OTDR-based DTS systems help in providing a robust measurement and are less susceptible to issues such as reflections and bends in the fiber and accessories.
By fiber type, which segment is expected to grow?
Multimode fibers have a relatively larger core than single-mode fibers. These are available in core sizes of 50ìm and 62.5ìm and are widely used in temperature, acoustic, strain, and pressure measurement applications.
By scattering method, which segment is expected to grow?
The market for the Rayleigh scattering effect is expected to grow at the highest CAGR during the forecast period. The Rayleigh scattering effect describes the change in the phase of the light beam passing through the medium when the light encounters particles smaller than the wavelength of radiation.
By application, which segment is expected to grow?
With the increasing industrialization and construction activities, and the growing number of safety norms, mainly in technologically advancing countries such as China, India, and Brazil, the implementation of DTS systems for fire detection applications is also growing as these systems provide temperature details along the length of the cable.
By geography, which region is expected to grow?
Along with the oil & gas sector, North America has a widespread network of power cables to supply electricity across various regions. DTS systems help in power cable and transmission line monitoring, which allows the operators to optimize the distribution and transmission networks, thereby reducing the capital and operational costs.
To speak to our analyst for a discussion on the above findings, click Speak to Analyst
-
Introduction
 Exclusive indicates content/data unique to MarketsandMarkets and not available with any competitors.
Table of Contents
1 Introduction (Page No. - 17)
1.1 Study Objectives
1.2 Market Definition and Scope
1.3 Study Scope
1.3.1 Market Covered
1.3.2 Geographic Scope
1.3.3 Years Considered
1.4 Currency
1.5 Limitations
1.6 Stakeholders
2 Research Methodology (Page No. - 21)
2.1 Research Data
2.1.1 Secondary Data
2.1.1.1 Major Secondary Sources
2.1.1.2 Secondary Sources
2.1.2 Primary Data
2.1.2.1 Primary Interviews With Experts
2.1.2.2 Key Data From Primary Sources
2.1.2.3 Key Industry Insights
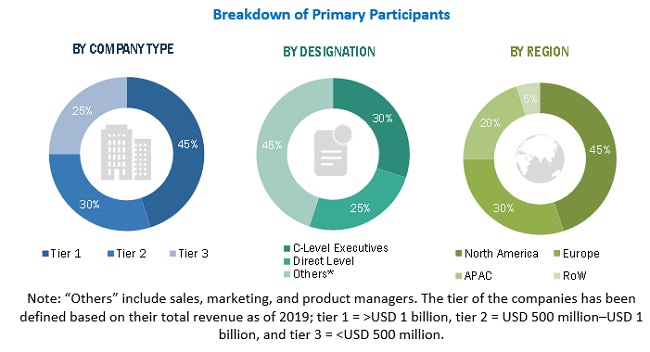
2.1.2.4 Breakdown of Primaries
2.1.3 Secondary and Primary Research
2.2 Market Size Estimation
2.2.1 Bottom-Up Approach
2.2.1.1 Approach for Capturing Market Share By Bottom-Up Approach (Demand Side)
2.2.2 Top-Down Approach
2.2.2.1 Approach for Capturing Market Share By Top-Down Approach (Supply Side)
2.3 Market Breakdown and Data Triangulation
2.4 Research Assumptions
3 Executive Summary (Page No. - 30)
4 Premium Insights (Page No. - 34)
4.1 Attractive Opportunities in Distributed Temperature Sensing Market
4.2 Market, By Scattering Method
4.3 Market, By Application
4.4 Market in North America, By Application and Country
4.5 Market, By Country
5 Market Overview (Page No. - 37)
5.1 Introduction
5.2 Market Dynamics
5.2.1 Drivers
5.2.1.1 Increasing Demand for Labor Safety at Working Sites
5.2.1.2 Reliability of DTS Systems/Sensors for Sensing and Monitoring Applications in Harsh Environments
5.2.1.3 Increasing Applications in the Oil & Gas Industry
5.2.2 Restraints
5.2.2.1 Optical Cables are Prone to Physical Damage
5.2.3 Opportunities
5.2.3.1 Increasing Safety Norms and Supportive Government Policies Related to Leakage Detection
5.2.3.2 Increasing Adoption of Data-Based Analytics
5.2.4 Challenges
5.2.4.1 High Costs Associated With DTS Systems
5.3 Value Chain Analysis
5.4 Porter’s Five Forces Analysis
5.4.1 Threat of New Entrants
5.4.2 Threat of Substitutes
5.4.3 Bargaining Power of Suppliers
5.4.4 Bargaining Power of Buyers
5.4.5 Intensity of Competitive Rivalry
6 Distributed Temperature Sensing Market, By Operating Principle (Page No. - 49)
6.1 Introduction
6.2 Optical Time Domain Reflectometry (OTDR)
6.2.1 OTDR Principle Held Larger Market Share in 2019
6.3 Optical Frequency Domain Reflectometry (OFDR)
6.3.1 OFDR Principle to Hold Smaller Market Size During Forecast Period Due to Limited Characteristics of OFDR-Based DTS Systems
7 Distributed Temperature Sensing Market, By Fiber Type (Page No. - 53)
7.1 Introduction
7.2 Single-Mode Fiber
7.2.1 Single-Mode Fiber Held Smaller Size of DTS Market in 2019
7.3 Multimode Fiber
7.3.1 Multimode Fiber-Based DTS Systems are Used in Applications That Demand Shorter Distance Coverage
8 Distributed Temperature Sensing Market, By Scattering Method (Page No. - 57)
8.1 Introduction
8.2 Rayleigh Scattering Effect
8.2.1 Rayleigh Scattering Effect to Witness Highest Growth Rate During Forecast Period
8.3 Raman Scattering Effect
8.3.1 Raman Scattering Effect is Witnessing Increasing Demand for use in DTS Systems for Safety and Security Applications
8.4 Brillouin Scattering Effect
8.4.1 Increasing use in Downhole Oil Monitoring Would Drive Market for Brillouin Scattering During Forecast Period
9 Distributed Temperature Sensing Market, By Application (Page No. - 60)
9.1 Introduction
9.2 Oil & Gas
9.2.1 Upstream
9.2.1.1 Downhole Monitoring
9.2.1.1.1 Rising Demand for Downhole Monitoring in Oil & Gas Plants to Propel Growth of Market for Oil & Gas Application
9.2.1.2 Slickline and Wireline Interventions Monitoring
9.2.1.2.1 High Implementation of DTS Systems for Wellbore Monitoring in Oil and Gas Plants
9.2.2 Downstream
9.3 Power Cable Monitoring
9.3.1 DTS Sensors are Used for Detecting Hotspots in Power Cables to Prevent Untoward Incidents
9.4 Fire Detection
9.4.1 Industrial Conveyors Monitoring
9.4.1.1 Monitoring Heat Detection Through DTS Systems Propel Its Demand in Industrial Conveyors Monitoring
9.4.2 Special Hazard Environments Fire Monitoring
9.4.2.1 Increasing Awareness Regarding Fire Protection in Hazardous Environments to Drive DTS Market Growth for Fire Detection Application
9.5 Process & Pipeline Monitoring
9.5.1 Leakage Detection
9.5.1.1 DTS Market for Leakage Detection Application to Witness Steady Growth During Forecast Period
9.6 Environmental Monitoring
9.6.1 Growing Focus on Ecological and Sewer Monitoring to Propel use of DTS Systems
10 Geographic Analysis (Page No. - 78)
10.1 Introduction
10.2 North America
10.2.1 US
10.2.1.1 US to Remain Largest Market for DTS in North America During Forecast Period
10.2.2 Canada
10.2.2.1 Extensive Oil Production Activities Fuel Demand for DTS Systems in Canada
10.2.3 Mexico
10.2.3.1 Growing Need for Fire Detection in Warehouses in Mexico Drives Demand for DTS Systems
10.3 Europe
10.3.1 UK
10.3.1.1 Increasing Need for Fire Protection Measures in Infrastructures to Drive DTS Market in UK
10.3.2 Germany
10.3.2.1 DTS Market in Germany Expected to Witness Highest Growth Among All European Countries During Forecast Period
10.3.3 France
10.3.3.1 Growth of DTS Market in France Primarily Depends on Power Cable Monitoring and Fire Detection Applications
10.3.4 Russia
10.3.4.1 Russia Expected to Lead European DTS Market During Forecast Period
10.3.5 Rest of Europe
10.4 APAC
10.4.1 China
10.4.1.1 China Held Largest Share of DTS Market in APAC in 2019
10.4.2 Japan
10.4.2.1 Growing Need for Power Cable Monitoring to Boost DTS Market in Japan
10.4.3 India
10.4.3.1 Strong Oil & Gas Sector and Rapid Expansion of Power Transmission Network Drive DTS Market in India
10.4.4 South Korea
10.4.4.1 Need to Comply With Fire Safety Norms DTS Market in South Korea
10.4.5 Rest of APAC
10.5 RoW
10.5.1 Middle East
10.5.1.1 Middle East Expected to Lead RoW DTS Market Throughout Forecast Period
10.5.2 Africa
10.5.2.1 Government Initiatives to Enhance Industrial Sector are Likely to Drive DTS Market in Africa
10.6 South America
10.6.1 Brazil
10.6.1.1 Brazil Expected to Register Highest Growth Rate in South America During Forecast Period
10.6.2 Argentina
10.6.2.1 Economic and Regulatory Changes in Energy & Power Sector Will Boost DTS Market in Argentina
10.6.3 Venezuela
10.6.3.1 DTS Systems are Used for Safe Production and Transportation of Petrochemical Products in Venezuela
10.6.4 Rest of South America
11 Competitive Landscape (Page No. - 103)
11.1 Introduction
11.2 Market Player Ranking Analysis
11.3 Competitive Leadership Mapping
11.3.1 Visionary Leaders
11.3.2 Innovators
11.3.3 Dynamic Differentiators
11.3.4 Emerging Companies
11.4 Strength of Product Portfolio (25 Companies)
11.5 Business Strategy Excellence (25 Companies)
11.6 Competitive Scenario
11.7 Competitive Situations & Trends
11.7.1 Contracts/Collaborations/Agreements/Joint Ventures/Partnerships
11.7.2 Product Launches
11.7.3 Acquisitions
11.7.4 Expansions
12 Company Profiles (Page No. - 117)
12.1 Key Players
12.1.1 Schlumberger Limited
12.1.1.1 Business Overview
12.1.1.2 Products Offered
12.1.1.3 Recent Developments
12.1.1.4 SWOT Analysis
12.1.1.5 MnM View
12.1.2 Halliburton Company
12.1.2.1 Business Overview
12.1.2.2 Products Offered
12.1.2.3 Recent Developments
12.1.2.4 SWOT Analysis
12.1.2.5 MnM View
12.1.3 Yokogawa Electric Corporation
12.1.3.1 Business Overview
12.1.3.2 Products Offered
12.1.3.3 Recent Developments
12.1.3.4 SWOT Analysis
12.1.3.5 MnM View
12.1.4 Weatherford International PLC
12.1.4.1 Business Overview
12.1.4.2 Products Offered
12.1.4.3 Recent Developments
12.1.4.4 SWOT Analysis
12.1.4.5 MnM View
12.1.5 Sumitomo Electric Industries, Ltd.
12.1.5.1 Business Overview
12.1.5.2 Products Offered
12.1.5.3 Recent Developments
12.1.5.4 SWOT Analysis
12.1.5.5 MnM View
12.1.6 OFS Fitel, LLC
12.1.6.1 Business Overview
12.1.6.2 Products Offered
12.1.7 AP Sensing GmbH
12.1.7.1 Business Overview
12.1.7.2 Products Offered
12.1.7.3 Recent Developments
12.1.8 Bandweaver Technologies
12.1.8.1 Business Overview
12.1.8.2 Products Offered
12.1.8.3 Recent Developments
12.1.9 GESO GmbH & Co.
12.1.9.1 Business Overview
12.1.9.2 Products Offered
12.1.10 NKT Photonics
12.1.10.1 Business Overview
12.1.10.2 Products Offered
12.1.10.3 Recent Developments
12.2 Other Companies
12.2.1 Omicron Electronics GmbH
12.2.2 AFL
12.2.3 Micron Optics, Inc.
12.2.4 Avencom
12.2.5 Sensornet Limited
12.2.6 Omnisens SA
12.2.7 Optromix, Inc.
12.2.8 Ziebel As
12.2.9 Silixa Ltd.
12.2.10 Tendeka
13 Appendix (Page No. - 148)
13.1 Discussion Guide
13.2 Knowledge Store: Marketsandmarkets’ Subscription Portal
13.3 Available Customizations
13.4 Related Reports
13.5 Author Details
List of Tables (78 Tables)
Table 1 Porter’s Five Forces Analysis (2019): Bargaining Power of Suppliers Had a High Impact on Distributed Temperature Sensing Market
Table 2 DTS Market, By Operating Principle, 2017–2025 (USD Million)
Table 3 DTS Market for OTDR-Based Systems, By Application, 2017–2025 (USD Million)
Table 4 DTS Market for OFDR-Based Systems, By Application, 2017–2025 (USD Million)
Table 5 Distributed Temperature Sensing Market, By Fiber Type, 2017–2025 (USD Million)
Table 6 Market for Single-Mode Fiber, By Application, 2017–2025 (USD Million)
Table 7 Market for Multimode Fiber, By Application, 2017–2025 (USD Million)
Table 8 Market, By Scattering Method, 2017–2025 (USD Million)
Table 9 Market, By Application, 2017–2025 (USD Million)
Table 10 Market for Oil & Gas, By Fiber Type, 2017–2025 (USD Million)
Table 11 Market for Oil & Gas, By Operating Principle, 2017–2025 (USD Million)
Table 12 Market for Oil & Gas, By Region, 2017–2025 (USD Million)
Table 13 Market for Oil & Gas in North America, By Country, 2017–2025 (USD Million)
Table 14 Market for Oil & Gas in Europe, By Country, 2017–2025 (USD Thousand)
Table 15 Market for Oil & Gas in APAC, By Country, 2017–2025 (USD Million)
Table 16 Market for Oil & Gas in RoW, By Region, 2017–2025 (USD Million)
Table 17 Market for Power Cable Monitoring, By Fiber Type, 2017–2025 (USD Million)
Table 18 Market for Power Cable Monitoring, By Operating Principle, 2017–2025 (USD Million)
Table 19 Market for Power Cable Monitoring, By Region, 2017–2025 (USD Million)
Table 20 Market for Power Cable Monitoring in North America, By Country, 2017–2025 (USD Million)
Table 21 Market for Power Cable Monitoring in Europe, By Country, 2017–2025 (USD Million)
Table 22 Market for Power Cable Monitoring in APAC, By Country, 2017–2025 (USD Million)
Table 23 Market for Power Cable Monitoring in RoW, By Region, 2017–2025 (USD Million)
Table 24 Market for Fire Detection, By Fiber Type, 2017–2025 (USD Million)
Table 25 Market for Fire Detection, By Operating Principle, 2017–2025 (USD Million)
Table 26 Market for Fire Detection, By Region, 2017–2025 (USD Million)
Table 27 Market for Fire Detection in North America, By Country, 2017–2025 (USD Million)
Table 28 Market for Fire Detection in Europe, By Country, 2017–2025 (USD Million)
Table 29 Market for Fire Detection in APAC, By Country, 2017–2025 (USD Million)
Table 30 Market for Fire Detection in RoW, By Region, 2017–2025 (USD Thousand)
Table 31 Distributed Temperature Sensing Market for Process & Pipeline Monitoring, By Fiber Type, 2017–2025 (USD Million)
Table 32 Market for Process & Pipeline Monitoring, By Operating Principle, 2017–2025 (USD Million)
Table 33 Market for Process & Pipeline Monitoring, By Region, 2017–2025 (USD Million)
Table 34 Market for Process & Pipeline Monitoring in North America, By Country, 2017–2025 (USD Million)
Table 35 Market for Process & Pipeline Monitoring in Europe, By Country, 2017–2025 (USD Thousand)
Table 36 Market for Process & Pipeline Monitoring in APAC, By Country, 2017–2025 (USD Million)
Table 37 Market for Process & Pipeline Monitoring in RoW, By Region, 2017–2025 (USD Million)
Table 38 Market for Environmental Monitoring, By Fiber Type, 2017–2025 (USD Million)
Table 39 Market for Environmental Monitoring, By Operating Principle, 2017–2025 (USD Million)
Table 40 Market for Environmental Monitoring, By Region, 2017–2025 (USD Million)
Table 41 Market for Environmental Monitoring in North America, By Country, 2017–2025 (USD Thousand)
Table 42 Market for Environmental Monitoring in Europe, By Country, 2017–2025 (USD Thousand)
Table 43 Market for Environmental Monitoring in APAC, By Country, 2017–2025 (USD Thousand)
Table 44 Market for Environmental Monitoring in RoW, By Region, 2017–2025 (USD Thousand)
Table 45 Market, By Region, 2017–2025 (USD Million)
Table 46 Market in North America, By Application, 2017–2025 (USD Million)
Table 47 Market in North America, By Country, 2017–2025 (USD Million)
Table 48 Market in US, By Application, 2017–2025 (USD Million)
Table 49 Market in Canada, By Application, 2017–2025 (USD Million)
Table 50 Market in Mexico, By Application, 2017–2025 (USD Thousand)
Table 51 Market in Europe, By Application, 2017–2025 (USD Million)
Table 52 Market in Europe, By Country, 2017–2025 (USD Million)
Table 53 Market in UK, By Application, 2017–2025 (USD Thousand)
Table 54 Market in Germany, By Application, 2017–2025 (USD Thousand)
Table 55 Market in France, By Application, 2017–2025 (USD Thousand)
Table 56 Market in Russia, By Application, 2017–2025 (USD Million)
Table 57 Market in Rest of Europe, By Application, 2017–2025 (USD Million)
Table 58 Distributed Temperature Sensing Market in APAC, By Application, 2017–2025 (USD Million)
Table 59 Market in APAC, By Country, 2017–2025 (USD Million)
Table 60 Market in China, By Application, 2017–2025 (USD Million)
Table 61 Market in Japan, By Application, 2017–2025 (USD Thousand)
Table 62 Market in India, By Application, 2017–2025 (USD Million)
Table 63 Market in South Korea, By Application, 2017–2025 (USD Million)
Table 64 Sensing Market in Rest of APAC, By Application, 2017–2025 (USD Million)
Table 65 Market in RoW, By Application, 2017–2025 (USD Million)
Table 66 Sensing Market in RoW, By Region, 2017–2025 (USD Million)
Table 67 Market in Middle East, By Application, 2017–2025 (USD Million)
Table 68 Market in Africa, By Application, 2017–2025 (USD Million)
Table 69 Market in South America, By Application, 2017–2025 (USD Thousand)
Table 70 Market in South America, By Country, 2017–2025 (USD Million)
Table 71 Market in Brazil, By Application, 2017–2025 (USD Thousand)
Table 72 Market in Argentina, By Application, 2017–2025 (USD Thousand)
Table 73 Market in Venezuela, By Application, 2017–2025 (USD Thousand)
Table 74 Market in Rest of South America, By Application, 2017–2025 (USD Thousand)
Table 75 Contracts/Collaborations/Agreements/Joint Ventures/Partnerships (2017–2020)
Table 76 Product Launches (2017–2020)
Table 77 Acquisitions (2017–2020)
Table 78 Expansions (2017–2020)
List of Figures (48 Figures)
Figure 1 Distributed Temperature Sensing (DTS) Market Segmentation
Figure 2 Distributed Temperature Sensing Market: Research Design
Figure 3 Market Size Estimation Methodology: Bottom-Up Approach
Figure 4 Market Size Estimation Methodology: Top-Down Approach
Figure 5 Data Triangulation
Figure 6 Assumption for the Study
Figure 7 Distributed Temperature Sensing Market, 2017–2025 (USD Million)
Figure 8 Market, By Fiber Type (2020 Vs. 2025)
Figure 9 OTDR to Hold Largest Share of Market, By Operating Principle, in 2020
Figure 10 Market for Fire Detection to Grow at Highest CAGR From 2020 to 2025
Figure 11 Middle East & Africa to Hold Largest Share of Market in 2020
Figure 12 Increasing Applications in the Oil & Gas Industry to Boost DTS Market During Forecast Period
Figure 13 Market for Rayleigh Scattering Effect to Grow at Highest CAGR From 2020 to 2025
Figure 14 Oil & Gas to Hold Largest Size of Market Through to 2025
Figure 15 Oil & Gas and US Were Largest Shareholders of DTS Market in North America in 2019
Figure 16 Market in India to Grow at Highest CAGR From 2020 to 2025
Figure 17 Impact of Drivers and Opportunities on Market
Figure 18 Impact of Challenges and Restraints on Market
Figure 19 Total Recorded Incidence Rate From 2015 to 2018
Figure 20 Major Value Added During Implementation and Installation Phase
Figure 21 Overview of Porter’s Five Forces Analysis of Distributed Temperature Sensing Market (2019)
Figure 22 Market: Porter’s Five Forces Analysis (2019)
Figure 23 Threat of New Entrants Had a Medium Impact in 2019
Figure 24 Threat of Substitutes Had a Low Impact in 2019
Figure 25 Bargaining Power of Suppliers Had a High Impact in 2019
Figure 26 Bargaining Power of Buyers Had a Medium Impact in 2019
Figure 27 Intensity of Competitive Rivalry Had a Medium Impact in 2019
Figure 28 OTDR DTS Market Expected to Grow at a Higher CAGR From 2020 to 2025
Figure 29 Multimode Fiber Type Expected to Grow at a Higher Rate Than Single-Mode Fiber Type During Forecast Period
Figure 30 Distributed Temperature Sensing Market for Rayleigh Scattering Effect to Grow at Highest CAGR From 2020 to 2025
Figure 31 Market for Fire Detection to Grow at Highest CAGR From 2020 to 2025
Figure 32 DTS Market for Oil & Gas to Grow at Highest CAGR in Middle East Among Regions in RoW
Figure 33 Market for Fire Detection Expected to Grow at Highest Rate in APAC During Forecast Period
Figure 34 Market for Environmental Monitoring Expected to Grow at Highest Rate in APAC During Forecast Period
Figure 35 Geographic Snapshot: DTS Market in APAC to Witness Highest Growth From 2020 to 2025
Figure 36 APAC to Lead Distributed Temperature Sensing Market During Forecast Period
Figure 37 North America: Market Snapshot
Figure 38 Europe: Market Snapshot
Figure 39 APAC: Market Snapshot
Figure 40 Companies Adopted Contracts/Collaborations/Agreements/ Joint Ventures/Partnerships as Key Growth Strategies During 2017–2020
Figure 41 Schlumberger Limited (US) Led DTS Market in 2019
Figure 42 DTS Market (Global) Competitive Leadership Mapping, 2019
Figure 43 Evaluation Framework: DTS Market
Figure 44 Schlumberger Limited: Company Snapshot
Figure 45 Halliburton Company: Company Snapshot
Figure 46 Yokogawa Electric Corporation: Company Snapshot
Figure 47 Weatherford International PLC: Company Snapshot
Figure 48 Sumitomo Electric Industries, Ltd.: Company Snapshot
The study involved four major activities in estimating the current size of the distributed temperature sensing market. Exhaustive secondary research has been done to collect information on the market, the peer markets, and the parent market. The next step has been to validate these findings, assumptions, and sizing with industry experts from across the value chain through primary research. Both top-down and bottom-up approaches have been employed to estimate the complete market size. After that, market breakdown and data triangulation methods have been used to estimate the market size of segments and subsegments.
Secondary Research
The research methodology used to estimate and forecast the distributed temperature sensing market begins with capturing data on the revenues of key vendors in the market through secondary research. This study involves the use of extensive secondary sources, directories, and databases such as Hoovers, Bloomberg Businessweek, Factiva, and OneSource to identify and collect information useful for the technical, market-oriented, and commercial study of the distributed temperature sensing market. Vendor offerings have also been taken into consideration to determine the market segmentation. This entire research methodology includes studying annual and financial reports of top players, presentations, press releases, journals, paid databases, trade directories, regulatory bodies, and safety standard organizations.
Primary Research
The distributed temperature sensing market’s supply chain comprises several stakeholders, such as suppliers of raw materials, original equipment manufacturers (OEMs), device manufacturers, and system integrators. The supply side is characterized by advancements in distributed temperature sensing solutions in diverse applications. Various primary sources from both the supply and demand sides of the market have been interviewed to obtain qualitative and quantitative information. The breakdown of primary respondents is as follows.
To know about the assumptions considered for the study, download the pdf brochure
Market Size Estimation
Both top-down and bottom-up approaches have been used to estimate and validate the size of the distributed temperature sensing market and its subsegments. The research methodology used to estimate the market sizes includes the following:
- Key players providing distributed temperature sensing solutions to different industries have been identified through extensive secondary research.
- The industry’s supply chain and market size, in terms of value, have been determined through primary and secondary research processes.
- All percentage shares, splits, and breakdowns have been determined using secondary sources and verified through primary sources.
Data Triangulation
After arriving at the overall market size—using the estimation processes as explained above—the market has been split into several segments and subsegments. To complete the overall market engineering process and arrive at the exact statistics of each market segment and subsegment, data triangulation and market breakdown procedures have been employed, wherever applicable. The data has been triangulated by studying various factors and trends from both the demand and supply sides of the distributed temperature sensing market.
Study Objectives
- To define, describe, and forecast the distributed temperature sensing (DTS) market segmented based on operating principle, fiber type, scattering method, application, and region, in terms of value
- To forecast the market size, in terms of value, for various segments with regard to four main regions: North America, Europe, Asia Pacific (APAC), and Rest of the World (RoW)
- To provide detailed information about the major factors influencing the growth of the DTS market (drivers, restraints, opportunities, and challenges)
- To analyze the micromarkets with respect to individual growth trends, prospects, and contributions to the total market
- To provide a detailed overview of the value chain of the DTS market and analyze the market trends with the help of Porter’s five forces analysis
- To analyze the opportunities in the market for various stakeholders by identifying the high-growth segments of the market
- To profile the key players and comprehensively analyze their market position in terms of the ranking and core competencies, along with detailing the competitive landscape of the market
- To analyze competitive developments such as partnerships and joint ventures, mergers and acquisitions, new product developments, expansions, and research and development (R&D) in the DTS market
Available Customizations
Along with the market data, MarketsandMarkets offers customizations according to a company’s specific needs. The following customization options are available for the report:
Company Information
- Detailed analysis and profiling of additional market players (Up to 5)
Critical Questions:
- What will be the new verticals in which distributed temperature sensing would be used?
- Who are the key players in the market, and how intense is the competition?


Growth opportunities and latent adjacency in Distributed Temperature Sensing Market
What are NEW applications for DTS rather than Oil/Gas/LNG, cables(subsea and underground) and environmental research? Which are the newest trends we can put our bets on? Does your scope include IoT or AI based sensing?
Distributed Temperature Sensing Market by Operating Principle (OTDR, OFDR), Fiber Type (Single-Mode, Multi-Mode), Application (Oil & Gas Production, Power Cable Monitoring, Fire Detection, Pipeline Leakage Detection) & Geography. Can you elaborate upon the operating principles and the scope of the same?
I am interested in when this report was prepared, and how markets are broken down geographically, e.g.. North America, Europe, Asia etc.? Also I could like to understand the future trends such as smart sensors, smart sensing devices, etc.
Which is the major application for DTS other than oil & gas? What are the latest trends in the market?
What the various sensing technologies that you have considered in your study?
Hi, I can see that you roll up by sector, and also roll up by geography. Does your report have a breakdown both by sector by geography or applications by region?