Corrosion Monitoring Market by Type Technique (Corrosion Coupons, Electrical resistance, Linear Polarization Resistance, Galvanic, & Ultrasonic Thickness Measurement), End-Use Industry (Oil & Gas, Chemical, Manufacturing) - Global Forecast to 2021


[157 Pages Report] The global corrosion monitoring market size was USD 176.6 Million in 2015 and is projected to reach USD 297.8 Million by 2021, at a CAGR of 9.1% between 2016 and 2021. The base year considered for the study is 2015, while the forecast period is between 2016 and 2021.
The Objectives of the Report are as follows:
- To define and segment the market for corrosion monitoring on the basis of type, technique, end-use industry, and region
- To provide detailed information regarding major factors (drivers, restraints, opportunities, and challenges) influencing the growth of the market for corrosion monitoring
- To analyze and forecast the market size of corrosion monitoring, in terms of value
- To analyze the market segmentation and project the market size, in terms of value for key regions such as North America, Europe, Asia-Pacific, South America, and the Middle East & Africa
- To analyze competitive developments such as new product launches, capacity expansions, mergers & acquisitions, and partnerships & agreements
- To strategically profile the key players in the market
Top-down and bottom-up approaches have been used to estimate and validate the size of the global market and to estimate the sizes of various other dependent submarkets in the overall corrosion monitoring market. The research study involved extensive use of secondary sources, directories, and databases such as Hoovers, Bloomberg, Chemical Weekly, Factiva, and other government and private websites to identify and collect information useful for the technical, market-oriented, and commercial study of the global market. After arriving at the overall market size, the total market was split into several segments and subsegments, which were then verified through primary research by conducting extensive interviews with key officials, such as CEOs, VPs, Directors, and other executives. Data triangulation and market breakdown procedures were employed to complete the overall market engineering process and to arrive at the exact statistics for all segments and subsegments. The breakdown of profiles of primary interviewees is depicted in the below figure:
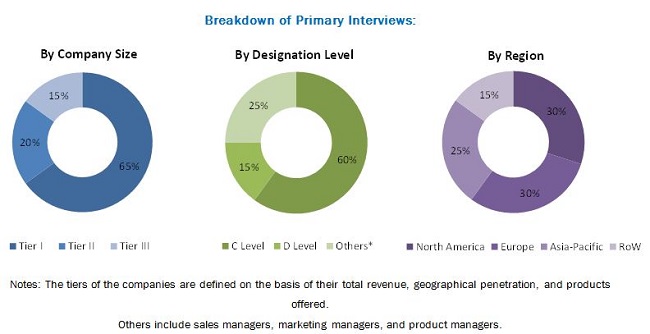
To know about the assumptions considered for the study, download the pdf brochure
Ecosystem
In the corrosion monitoring value chain, there are technology developers or suppliers such as SGS SA, Permasense, Cosasco, and others. End-use industries include companies in oil & gas and chemical sectors such as BP, Shell, Reliance, Mitsui, BASF, and so on.
Key Target Audience:
- Corrosion monitoring technology providers
- Corrosion monitoring equipment manufacturers
- Corrosion monitoring equipment end-use industries
- Government and regulatory organizations
- Investment research firms
Scope of the Report:
This research report categorizes the global market on the basis of type, technique, end-use industry, and region.
On the basis of Type:
- Intrusive
- Non-Intrusive
On the basis of Technique
- Corrosion coupons
- Electrical resistance
- Linear polarization resistance
- Galvanic
- Ultrasonic thickness measurement
- Others
On the basis of End-Use Industry
- Oil & gas
- Chemical
- Manufacturing
- Power Generation
- Pulp & paper
- Others
On the basis of Region:
- North America
- Europe
- Asia-Pacific
- South America
- Middle East & Africa
The market is further analyzed for the key countries in each of these regions.
Available Customizations:
With the given market data, MarketsandMarkets offers customizations according to the company�s specific needs. The following customization options are available for the report:
Regional Analysis:
- Country-level analysis of the market by technique
- Country-level analysis of the corrosion monitoring market by end-use industry
Company Information:
- Detailed analysis and profiling of additional market players
Product Analysis
- Product matrix, which gives a detailed comparison of product portfolio of each company
The global corrosion monitoring market is estimated to reach USD 297.8 Million by 2021, registering a CAGR of 9.1%, in terms of value, between 2016 and 2021. The increasing demand is driven by increasing awareness about potential cost savings and asset protection. The report analyzes the market on the basis of type, technique, end-use industry, and penetration of each technique in each end-use industry in each major region and country. It also covers the market behavior of leading producers, key developments, and strategies implemented to sustain and succeed in the market.
The market, on the basis of type, is segmented into intrusive and non-intrusive corrosion monitoring techniques. It is further classified into the following techniques: corrosion coupons, electrical resistance, linear polarization resistance, galvanic, and ultrasonic thickness measurement. The corrosion coupons segment accounted for the largest share of the overall market in 2015. Ultrasonic thickness measurement is the fastest-growing technique for corrosion monitoring and is expected to dominate the market. Asia-Pacific is the fastest-growing market for corrosion monitoring. This high is mostly due to high economic growth and heavy investment across industries, such as petrochemicals, chemicals, power generation, renewable power generation, and presence of global manufacturing hubs.
The end-use industries of corrosion monitoring include oil & gas, chemical, manufacturing, power generation, pulp & paper. The oil & gas segment accounted for the largest share of the overall corrosion monitoring market. Protection of assets and increasing regulations on corrosion monitoring and pipeline inspections makes the oil & gas sector the most lucrative market for market players. Upstream, midstream, and downstream industries has billions of dollars invested in assets ranging from offshore rigs to inter-state pipelines to refineries. All these assets are under constant attack of corrosion, hence, corrosion monitoring is especially important in the oil & gas industry.
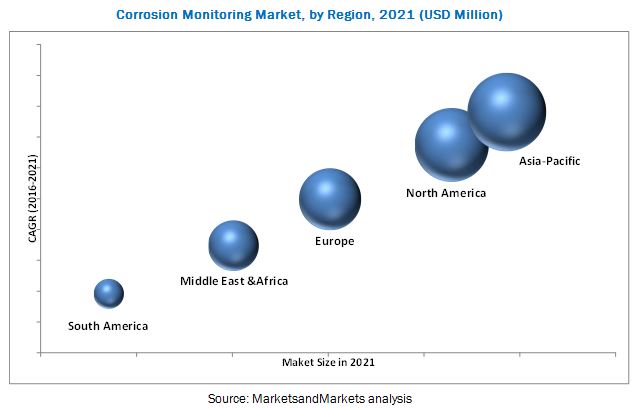
Globally, Asia-Pacific dominated the market in 2015, whereas North America, due to its increasing oil & gas activities, is the second-largest market. Asia-Pacific is also projected to be the fastest-growing market and will remain the largest market till 2021. The market for corrosion monitoring is dominated by Asia-Pacific due to the presence of emerging economies such as China and India. There are increasing industrial activities and end-use industries in these countries are increasingly focusing on asset protection and reduction of loses.
The major restrains in the market are identified to be lack of sufficient regulatory mandates in most of the markets in Asia Pacific and lack of awareness among end-use industries. Market leaders such as Permasense, SGS SA, Cosasco, and others have strong brand image, both in intrusive as well as non-intrusive type of corrosion monitoring market. Increasing demand from Asia-Pacific will lead to shifting of global majors to the region. New and local players are also expected to explore the growing market of global corrosion monitoring.
To speak to our analyst for a discussion on the above findings, click Speak to Analyst
 Exclusive indicates content/data unique to MarketsandMarkets and not available with any competitors.
Table of Contents
1 Introduction (Page No. - 15)
1.1 Objectives of the Study
1.2 Market Definition
1.3 Market Scope
1.3.1 Years Considered for the Study
1.3.2 Currency
1.4 Research Assumptions
1.5 Limitations
1.6 Stakeholders
2 Research Methodology (Page No. - 19)
2.1 Research Data
2.1.1 Secondary Data
2.1.1.1 Key Data From Secondary Sources
2.1.2 Primary Data
2.1.2.1 Key Data From Primary Sources
2.1.2.2 Key Industry Insights
2.2 Market Size Estimation
2.2.1 Bottom-Up Approach
2.2.2 Top-Down Approach
2.3 Data Triangulation
3 Executive Summary (Page No. - 27)
4 Premium Insights (Page No. - 31)
4.1 Attractive Opportunities in the Corrosion Monitoring Market
4.2 Market in Asia-Pacific
4.3 Fastest-Growing Markets
4.4 Non-Intrusive Segment to Register Faster Growth Than Intrusive Segment
4.5 Corrosion Coupons Technique to Dominate the Market During the Forecast Period
4.6 Oil & Gas Estmated to Dominate the Market Throughout the Forecast Period
5 Market Overview (Page No. - 35)
5.1 Market Segmentation
5.1.1 By Type
5.1.2 By Technique
5.1.3 By End-Use Industry
5.1.4 By Region
5.2 Market Dynamics
5.2.1 Drivers
5.2.1.1 Growing Awareness in End-Use Industries
5.2.1.2 Upcoming Projects in Downstream Sector of Oil & Gas Industry
5.2.1.3 Ageing Infrastructure in Old Industries
5.2.1.4 Stringent Environmental Regulations and Safety Standards
5.2.2 Restraints
5.2.2.1 Slowdown in Oil & Gas Upstream Industry
5.2.2.2 High Cost of Corrosion Monitoring Equipment
5.2.3 Opportunities
5.2.3.1 Demand for Accurate Corrosion Monitoring Techniques
5.2.3.2 Increasing Use in Power, Chemicals, Manufacturing, and Other Industries
5.2.4 Challenges
5.2.4.1 Installation of Equipment in Critical Conditions
5.2.4.2 Difficulty in Obtaining Accurate Reading
6 Industry Trends (Page No. - 43)
6.1 Introduction
6.2 Value Chain Analysis
6.2.1 Raw Materials
6.2.2 Corrosion Monitoring Techniques
6.2.3 Manufacturing
6.2.4 Corrosion Monitoring Equipment Suppliers/Service Providers
6.3 Porter�s Five Forces Analysis
6.3.1 Threat 0f New Entrants
6.3.2 Bargaining Power of Suppliers
6.3.3 Threat of Substitutes
6.3.4 Bargaining Power of Buyers
6.3.5 Intensity of Competitive Rivalry
7 Corrosion Monitoring Market, By Type (Page No. - 48)
7.1 Introduction
7.2 Intrusive Techniques
7.3 Non-Intrusive Techniques
8 Corrosion Monitoring Market, By Technique (Page No. - 53)
8.1 Introduction
8.2 Corrosion Coupons
8.3 Electrical Resistance
8.4 Linear Polarization Resistance
8.5 Galvanic Technique
8.6 Ultrasonic Thickness Measurement
8.7 Other Techniques
9 Corrosion Monitoring Market, By End-Use Industry (Page No. - 63)
9.1 Introduction
9.2 Oil & Gas
9.2.1 Upstream
9.2.2 Midstream
9.2.3 Downstream
9.3 Chemicals
9.4 Manufacturing
9.4.1 Pharmaceutical Industry
9.4.2 Automotive Industry
9.4.3 Food Industry
9.5 Power Generation
9.5.1 Conventional Power Generation
9.5.2 Unconventional Power Generation
9.6 Pulp & Paper
9.7 Other Industries
10 Corrosion Monitoring Market, By Region (Page No. - 76)
10.1 Introduction
10.2 North America
10.2.1 U.S.
10.2.2 Canada
10.2.3 Mexico
10.3 Europe
10.3.1 Germany
10.3.2 France
10.3.3 Spain
10.3.4 Russia
10.3.5 Italy
10.3.6 U.K.
10.3.7 Rest of Europe
10.4 Asia-Pacific
10.4.1 China
10.4.2 India
10.4.3 Japan
10.4.5 Indonesia
10.4.6 Thailand
10.4.7 Australia & New Zealand
10.4.8 Rest of Asia-Pacific
10.5 Middle East & Africa
10.5.1 Saudi Arabia
10.5.2 UAE
10.5.3 Iran
10.5.4 Rest of Middle East & Africa
10.6 South America
10.6.1 Brazil
10.6.2 Venezuela
10.6.3 Rest of South America
11 Competitive Landscape (Page No. - 127)
11.1 Overview
11.2 Competitive Trends
11.3 Mergers & Acquisitions: Most Popular Growth Strategy Between 2013 and 2016
11.3.1 Mergers & Acquisitions
11.3.2 New Product Launches
11.3.3 Contracts & Agreements
11.3.4 Expansions
11.3.5 Partnerships
12 Company Profiles (Page No. - 133)
(Overview, Financial*, Products & Services, Strategy, and Developments)
12.1 Intertek Group PLC
12.2 SGS S.A.
12.3 Cosasco
12.4 Korosi Specindo
12.5 Rysco Corrosion Services Inc.
12.6 BAC Corrosion Control Ltd.
12.7 Applied Corrosion Monitoring Ltd.
12.8 Permasense Ltd
12.9 ICORR Technologies
12.10 Pyramid Technical Services Pvt. Ltd. (PTS)
*Details Might Not Be Captured in Case of Unlisted Companies
13 Appendix (Page No. - 150)
13.1 Insights of Industry Experts
13.2 Discussion Guide
13.3 Introducing RT: Real Time Market Intelligence
13.4 Knowledge Store: Marketsandmarkets� Subscription Portal
13.5 Available Customizations
13.6 Related Reports
List of Tables (96 Tables)
Table 1 Corrosion Monitoring Market Size, By Type, 2014�2021 (USD Million)
Table 2 Market Size for Intrusive Corrosion Monitoring, By Region, 2014�2021 (USD Million)
Table 3 Market Size in Non-Intrusive, By Region, 2014�2021 (USD Million)
Table 4 Market Size, By Technique, 2014�2021 (USD Million)
Table 5 Market Size in Corrosion Coupons Technique, By Region, 2014�2021 (USD Million)
Table 6 Corrosion Monitoring Market Size in Electrical Resistance Technique, By Region, 2014�2021 (USD Million)
Table 7 Market Size in Linear Polarization Resistance Technique, By Region, 2014�2021 (USD Million)
Table 8 Market Size By Galvanic Technique, By Region, 2014�2021 (USD Million)
Table 9 Market Size in Ultrasonic Thickness Measurement Technique, By Region, 2014�2021 (USD Million)
Table 10 Market Size in Other Techniques, By Region, 2014�2021 (USD Million)
Table 11 Corrosion Monitoring Market Size, By End-Use Industry, 2014�2021 (USD Million)
Table 12 Market Size in Oil & Gas Industry, By Region, 2014�2021 (USD Million)
Table 13 Corrosion Monitoring Market Size in Chemical Industry, By Region, 2014�2021 (USD Million)
Table 14 Market Size in Manufacturing Industry, By Region, 2014�2021 (USD Million)
Table 15 Market Size in Power Generation Industry, By Region, 2014�2021 (USD Million)
Table 16 Market Size in Pulp & Paper Industry, By Region, 2014�2021 (USD Million)
Table 17 Corrosion Monitoring Market Size in Other Industries, By Region, 2014�2021 (USD Million)
Table 18 Market Size, By Region, 2014�2021 (USD Million)
Table 19 Market Size, By Type, 2014�2021 (USD Million)
Table 20 Market Size, By Technique, 2014�2021 (USD Million)
Table 21 Market Size, By End-Use Industry, 2014�2021 (USD Million)
Table 22 North America: Market Size, By Country, 2014�2021 (USD Million)
Table 23 North America: Corrosion Monitoring Market Size, By Type, 2014�2021 (USD Million)
Table 24 North America: Market Size, By Technique, 2014�2021 (USD Million)
Table 25 North America: Market Size, By End-Use Industry, 2014�2021 (USD Million)
Table 26 U.S.: Market Size, By Technique, 2014�2021 (USD Million)
Table 27 U.S.: Market Size, By End-Use Industry, 2014�2021 (USD Million)
Table 28 Canada: Market Size, By Technique, 2014�2021 (USD Million)
Table 29 Canada: Market Size, By End-Use Industry, 2014�2021 (USD Million)
Table 30 Mexico: Corrosion Monitoring Market Size, By Technique, 2014�2021 (USD Million)
Table 31 Mexico: Market Size, By End-Use Industry, 2014�2021 (USD Million)
Table 32 Europe: Market Size, By Type 2014�2021 (USD Million)
Table 33 Europe: Market Size, By Country, 2014�2021 (USD Million)
Table 34 Europe: Market Size, By Technique, 2014�2021 (USD Million)
Table 35 Europe: Corrosion Monitoring Market Size, By End-Use Industry, 2014�2021 (USD Million)
Table 36 Germany: Market Size, By Technique, 2014�2021 (USD Million)
Table 37 Germany: Market Size, By End-Use Industry, 2014�2021 (USD Million)
Table 38 France: Corrosion Monitoring Market Size, By Technique, 2014�2021 (USD Million)
Table 39 France: Market Size, By End-Use Industry, 2014�2021 (USD Million)
Table 40 Spain: Market Size, By Technique, 2014�2021 (USD Million)
Table 41 Spain: Corrosion Monitoring Market Size, By End-Use Industry, 2014�2021 (USD Million)
Table 42 Russia: Market Size, By Technique, 2014�2021 (USD Million)
Table 43 Russia: Market Size, By End-Use Industry, 2014�2021 (USD Million)
Table 44 Italy: Corrosion Monitoring Market Size, By Technique, 2014�2021 (USD Million)
Table 45 Italy: Market Size, By End-Use Industry, 2014�2021 (USD Million)
Table 46 U.K.: Market Size, By Technique, 2014�2021 (USD Million)
Table 47 U.K.: Market Size, By End-Use Industry, 2014�2021 (USD Million)
Table 48 Rest of Europe: Market Size, By Technique, 2014�2021 (USD Million)
Table 49 Rest of Europe: Market Size, By End-Use Industry, 2014�2021 (USD Million)
Table 50 Asia-Pacific: Corrosion Monitoring Market Size, By Country, 2014�2021 (USD Million)
Table 51 Asia-Pacific: Market Size, By Type, 2014�2021 (USD Million)
Table 52 Asia-Pacific: Market Size, By Technique, 2014�2021 (USD Million)
Table 53 Asia-Pacific: Market Size, By End-Use Industry, 2014�2021 (USD Million)
Table 54 China: Corrosion Monitoring Market Size, By Technique, 2014�2021 (USD Million)
Table 55 China: Market Size, By End-Use Industry, 2014�2021 (USD Million)
Table 56 India: Market Size, By Technique, 2014�2021 (USD Million)
Table 57 India: Market Size, By End-Use Industry, 2014�2021 (USD Million)
Table 58 Japan: Market Size, By Technique, 2014�2021 (USD Million)
Table 59 Japan: Market Size, By End-Use Industry, 2014�2021 (USD Million)
Table 60 South Korea: Corrosion Monitoring Market Size, By Technique, 2014�2021 (USD Million)
Table 61 South Korea: Market Size, By End-Use Industry, 2014�2021 (USD Million)
Table 62 Indonesia: Market Size, By Technique, 2014�2021 (USD Million)
Table 63 Indonesia: Market Size, By End-Use Industry, 2014�2021 (USD Million)
Table 64 Thailand: Corrosion Monitoring Market Size, By Technique, 2014�2021 (USD Million)
Table 65 Thailand: Market Size, By End-Use Industry, 2014�2021 (USD Million)
Table 66 Australia & New Zealand: Market Size, By Technique, 2014�2021 (USD Million)
Table 67 Australia & New Zealand: Market Size, By End-Use Industry, 2014�2021 (USD Million)
Table 68 Rest of Asia-Pacific: Corrosion Monitoring Market Size, By Technique, 2014�2021 (USD Million)
Table 69 Rest of Asia-Pacific: Market Size, By End-Use Industry, 2014�2021 (USD Million)
Table 70 Middle East & Africa: Market Size, By Country, 2014�2021 (USD Million)
Table 71 Middle East & Africa: Market Size, By Type, 2014�2021 (USD Million)
Table 72 Middle East & Africa: Market Size, By Technique, 2014�2021 (USD Million)
Table 73 Middle East & Africa: Corrosion Monitoring Market Size, By End-Use Industry, 2014�2021 (USD Million)
Table 74 Saudi Arabia: Market Size, By Technique, 2014�2021 (USD Million)
Table 75 Saudi Arabia: Market Size, By End-Use Industry, 2014�2021 (USD Million)
Table 76 UAE: Market Size, By Technique, 2014�2021 (USD Million)
Table 77 UAE.: Market Size, By End-Use Industry, 2014�2021 (USD Million)
Table 78 Iran: Corrosion Monitoring Market Size, By Technique, 2014�2021 (USD Million)
Table 79 Iran: Corrosion Monitoring Market Size, By End-Use Industry, 2014�2021 (USD Million)
Table 80 Rest of Middle East & Africa: Market Size, By Technique, 2014�2021 (USD Million)
Table 81 Rest of Middle East & Africa: Market Size, By End-Use Industry, 2014�2021 (USD Million)
Table 82 South America: Market Size, By Country, 2014�2021 (USD Million)
Table 83 South America: Corrosion Monitoring Market Size, By Type 2014�2021 (USD Million)
Table 84 South America: Market Size, By Technique, 2014�2021 (USD Million)
Table 85 South America: Market Size, By End-Use Industry, 2014�2021 (USD Million)
Table 86 Brazil: Market Size, By Technique, 2014�2021 (USD Million)
Table 87 Brazil: Market Size, By End-Use Industry, 2014�2021 (USD Million)
Table 88 Venezuela: Corrosion Monitoring Market Size, By Technique, 2014�2021 (USD Million)
Table 89 Venezuela: Market Size, By End-Use Industry, 2014�2021 (USD Million)
Table 90 Rest of South America: Corrosion Monitoring Market Size, By Technique, 2014�2021 (USD Million)
Table 91 Rest of South America: Market Size, By End-Use Industry, 2014�2021 (USD Million)
Table 92 Merger & Acquisitions, 2013�2016
Table 93 New Product Launches, 2013�2016
Table 94 Contracts & Agreements, 2013�2016
Table 95 Expansions, 2013�2016
Table 96 Partnerships, 2013�2016
List of Figures (54 Figures)
Figure 1 Market Segmentation
Figure 2 Corrosion Monitoring Market: Research Design
Figure 3 Market Size Estimation Methodology: Bottom-Up Approach
Figure 4 Market Size Estimation Methodology: Top-Down Approach
Figure 5 Market: Data Triangulation
Figure 6 Market, By Country - 2015 (USD Million)
Figure 7 Asia-Pacific Projected to Be the Fastest-Growing Market (USD Million)
Figure 8 Oil & Gas Will Be the Largest End-Use Industry for Corrosion Monitoring During Forecast Period (USD Million)
Figure 9 Market Share, By Region, 2015 (USD Million)
Figure 10 Asia-Pacific and Middle East & Africa to Drive the Global Demand for Corrosion Monitoring
Figure 11 Oil & Gas Industry Estimated to Account for the Largest Share of the Asia-Pacific Corrosion Monitoring Market
Figure 12 India, China, and Saudi Arabia are the Fastest-Growing Markets (2016�2021)
Figure 13 Market, By Type (2016�2021)
Figure 14 Corrosion Monitoring Market, By Technique (2016�2021)
Figure 15 Market, By End-Use Industry (2016�2021)
Figure 16 Market: By Type
Figure 17 Market: By Technique
Figure 18 Market: By End-Use Industry
Figure 19 Corrosion Monitoring Market Segmentation, By Region
Figure 20 Value Chain Analysis: Market
Figure 21 Porter�s Five Forces Analysis of the Market
Figure 22 Corrosion Monitoring Market Share, By Type, 2015 (USD Million)
Figure 23 Asia-Pacific Estimated to Lead the Market for Intrusive Corrosion Monitoring
Figure 24 Asia-Pacific Estimated to Lead the Market for Non-Intrusive Corrosion Monitoring
Figure 25 Market Share, By Technique, 2015 (USD Million)
Figure 26 Asia-Pacific Estimated to Lead Market in Corrosion Coupons Segment
Figure 27 Asia-Pacific Estimated to Lead the Market in Electrical Resistance Segment
Figure 28 Asia-Pacific Estimated to Lead the Market for Linear Polarization Resistance
Figure 29 Asia-Pacific Estimated to Lead the Market for Galvanic Technique
Figure 30 North America to Be the Largest Market for Ultrasonic Thickness Measurement in Corrosion Monitoring
Figure 31 Asia-Pacific Estimated to Lead the Market for Other Techniques
Figure 32 Market Share, By End-Use Industry, 2015 (USD Million)
Figure 33 North America Estimated to Lead Corrosion Monitoring Market in Oil & Gas Industry
Figure 34 North America Estimated to Lead the Market for Corrosion Monitoring in Chemical Industry
Figure 35 Middle East & Africa to Be the Fastest-Growing Region for Corrosion Monitoring in Manufacturing Industry
Figure 36 Asia-Pacific Estimated to Lead the Market for Corrosion Monitoring in Power Generation Industry
Figure 37 Middle East & Africa is the Fastest Growing Region for Corrosion Monitoring in Pulp & Paper Industry
Figure 38 Asia-Pacific Estimated to Lead Market in Other Industries
Figure 39 Regional Snapshot: Rapid Growth Markets are Emerging as New Hotspots
Figure 40 North America Market Snapshot: the U.S. Leads the Market for Corrosion Monitoring in North America
Figure 41 The U.S. Accounts for the Major Share of Corrosion Monitoring in North America
Figure 42 U.S. Market Snapshot: 2016 vs 2021
Figure 43 European Market Snapshot: Russia to Be the Fastest Growing Market
Figure 44 Asia-Pacific Snapshot: India to Be the Fastest Growing Market in the Region
Figure 45 China Accounts for the Major Share of Corrosion Monitoring in Asia-Pacific
Figure 46 Asia-Pacific Market Snapshot: Country-Wise Market Share of Corrosion Monitoring in Oil & Gas, Manufacturing, and Power Generation-2015 (USD Million)
Figure 47 Saudi Arabia Accounts for the Major Share in Middle East & Africa
Figure 48 Brazil Accounted for Major Share of Corrosion Monitoring Market in South America
Figure 49 New Product Launches Was the Key Growth Strategy Adopted Between 2013 and 2016
Figure 50 Market Evaluation Framework: Mergers & Acquisitions Fueled Growth Between 2013 and 2016
Figure 51 Intertek Group PLC.: Company Snapshot
Figure 52 Intertek Group PLC.: SWOT Analysis
Figure 53 SGS S.A.: Company Snapshot
Figure 54 SGS S.A.: SWOT Analysis


Growth opportunities and latent adjacency in Corrosion Monitoring Market