Confectionery Processing Equipment Market by Type (Thermal, Mixers, Blenders, Cutters, Extrusion, Cooling, Coating), Product (Hard Candies, Chewing Gums, Gummies & Jellies, Soft Confectionery), Mode of Operation, and Region - Global Forecast to 2023


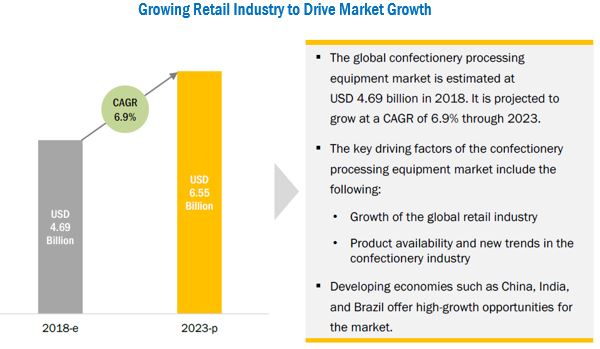
[143 Pages Report] Confectionery processing equipment market was valued at USD 4.38 Billion in 2017. It is projected to reach USD 6.55 Billion by 2023, at a CAGR of 6.90% from 2018. Confectionery processing equipment is machinery used for the production of confectionery products such as hard candies, chewing gums, gummies & jellies, and soft confectionery. The growth of the retail and confectionery industries, supported by the increased market presence of confectionery companies across the globe, drives the growth of the market.
For More details on this research, Request Free Sample Report
The objectives of the study are:
- To define, segment, and forecast the size of the confectionery processing equipment market with respect to product, type, mode of operation, and region
- To analyze the market structure by identifying various sub segments of the confectionery processing equipment market
- To forecast the size of the market for confectionery processing equipment and its various submarkets with respect to four main regions, namely, North America, Asia Pacific, Europe, and the Rest of the World (RoW)
- To provide detailed information about crucial factors that are influencing the growth of the market (drivers, restraints, opportunities, and challenges)
- To analyze opportunities in the market for stakeholders and provide details of the competitive landscape for market leaders
- To strategically profile key players and comprehensively analyze their market ranking and core competencies
- To analyze competitive developments such as expansions & investments, acquisitions, and partnerships in the market for confectionery processing equipment.
The years considered for the study are as follows:
- Base Year: 2017
- Estimated Year: 2018
- Projected Year: 2023
- Forecast Period: 2018 to 2023
This report includes estimations of the market size in terms of value (USD million). Both, top-down and bottom-up approaches have been used to estimate and validate the size of the confectionery processing equipment market and to estimate the size of various other dependent submarkets in the overall market. Key players in the market have been identified through secondary research through various sources such as the US Department of Agriculture (USDA), the Food and Agricultural Organization (FAO), the European Food Safety Authority, EUROPA, and the Institute of Food Technologist, and their market ranking in the respective regions has been determined through primary and secondary research. All percentage shares, splits, and breakdowns have been determined using secondary sources and were verified through primary sources.
To know about the assumptions considered for the study, download the pdf brochure
The confectionery processing equipment ecosystem comprises confectionery processing equipment providers such as Robert Bosch GmbH (Germany), B�hler AG (Switzerland), GEA Group (Germany), Alfa Laval (Sweden), John Bean Technologies Corporation (JBT) (US), Aasted ApS (Denmark), BCH Ltd (England), Tanis Confectionery (Netherlands), Baker Perkins Limited (UK), Sollich KG (Germany), Heat and Control, Inc. (US), and Rieckermann GmbH (Germany).
Target Audience:
- R&D institutes
- Technology providers
- Confectionery processing equipment providers
- Intermediary suppliers
- Wholesalers
- Dealers
- Consumers
- End users
The study answers several questions for stakeholders, primarily which market segments to focus on in the next two to five years for prioritizing efforts and investments.
Scope of the report
This research report categorizes the confectionery processing equipment market based on product, type, mode of operation, and region.
Based on product, the market has been segmented as follows:
- Soft confectionery
- Hard candies
- Chewing gums
- Gummies & jellies
- Others
Based on type, the market has been segmented as follows:
- Thermal
- Mixers, blenders, and cutters
- Extrusion
- Cooling
- Coating
- Others
Based on mode of operation, the market has been segmented as follows:
- Automatic
- Semi-automatic
Based on region, the market has been segmented as follows:
- North America
- Europe
- Asia Pacific
- RoW (Middle East, Africa, and South America)
Available Customizations
With the given market data, MarketsandMarkets offers customizations according to client-specific needs.
The following customization options are available for the report:
Product Analysis
- Product Matrix, which gives a detailed comparison of the product portfolio of each company
Regional Analysis
- Further breakdown of the Rest of European confectionery processing equipment market into France, the Netherlands, Spain, and Russia
- Further breakdown of the Rest of Asia Pacific confectionery processing equipment market into Thailand, Malaysia, the Philippines, and Indonesia
- Further breakdown of the South American confectionery processing equipment market into Argentina and Brazil
Company Information
- Detailed analyses and profiling of additional market players (up to five)
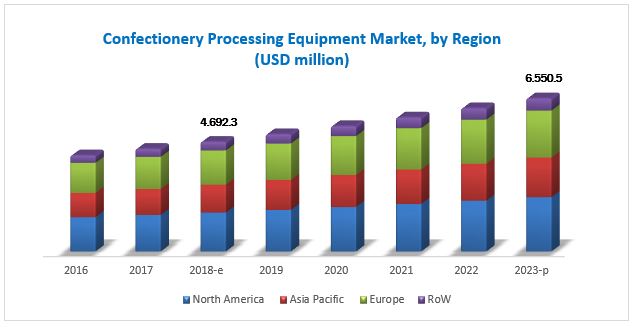
The global market for confectionery processing equipment has grown exponentially in the last few years. The market is estimated to be valued at USD 4.69 Billion in 2018, and is projected to reach USD 6.55 Billion by 2023, at a CAGR of around 6.90% during the forecast period. Emerging economies such as India, China, and countries in South America are the potential primary markets of the industry. Factors such as the growth of the retail industry have driven the growth of the confectionery processing equipment market. The market for confectionery processing equipment is witnessing growth owing to the growth in demand for confectionery items such as candies, toffees, chocolates, chewing gums, and jellies.
The confectionery processing equipment market, by product, is segmented into hard candies, chewing gums, gummies & jellies, soft confectionery, and others. The soft confectionery segment is estimated to dominate the market with the largest share in 2018 as the demand for a variety of chocolates, such as sugar-free and dark, is increasing, globally. This is followed by the hard candies segment.
The confectionery processing equipment market, based on type, is segmented into thermal, extrusion, mixers, blender, and cutters, coating, cooling, and others. The extrusion segment is projected to grow at the highest CAGR among all confectionery processing equipment types from 2018 to 2023. Extrusion equipment is used to make confectionery products of different shapes and sizes. The need to provide innovative products is one of the factors expected to augment the demand for extrusion products.
Based on mode of operation, the confectionery processing equipment market is segmented into automatic and semi-automatic. The automatic segment is anticipated to be relatively larger as against the semi-automatic segment. Automatic operation helps to reduce labor costs as well as time and ensures high-quality products.
For More details on this research, Request Free Sample Report
The North American region is estimated to dominate the confectionery processing equipment market in 2018, The market in Asia Pacific is expected to grow at the highest CAGR during the review period. The market for confectionery processing equipment is developing rapidly in Asia Pacific due to high consumption of convenience foods and the establishment of key confectionery product manufacturers. Population growth, rise in disposable income, changes in eating habits, and urbanization are the key factors that drive the demand for confectionery products in the region.
The major restraining factor for the growth of the confectionery processing equipment market is increase in awareness regarding the ill-effects of sugar consumption among consumers. This trend is witnessed in regions such as North America and Europe, and is expected to restrain the growth of the confectionery products market, which would subsequently impact the market for confectionery processing equipment.
New product launches, acquisitions, expansions, partnerships, mergers, and agreements are the key strategies adopted by the players to ensure their growth in the market. The market is dominated by players such as Robert Bosch GmbH (Germany), B�hler AG (Switzerland), GEA Group (Germany), Alfa Laval (Sweden), John Bean Technologies Corporation (JBT) (US), Aasted ApS (Denmark), BCH Ltd (England), Tanis Confectionery (Netherlands), Baker Perkins Limited (UK), Sollich KG (Germany), Heat and Control, Inc. (US), and Rieckermann GmbH (Germany).
To speak to our analyst for a discussion on the above findings, click Speak to Analyst
 Exclusive indicates content/data unique to MarketsandMarkets and not available with any competitors.
Table of Contents
1 Introduction (Page No. - 14)
1.1 Objectives of the Study
1.2 Market Definition
1.3 Study Scope
1.4 Periodization Considered
1.5 Currency Considered
1.6 Stakeholders
2 Research Methodology (Page No. - 18)
2.1 Research Data
2.1.1 Secondary Data
2.1.1.1 Key Data From Secondary Sources
2.1.2 Primary Data
2.1.2.1 Key Data From Primary Sources
2.1.2.2 Key Industry Insights
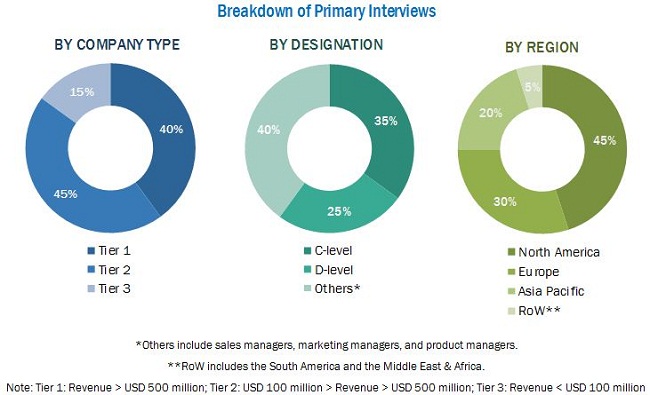
2.1.2.3 Breakdown of Primary Interviews
2.2 Market Size Estimation
2.3 Market Breakdown & Data Triangulation
2.4 Research Assumptions & Limitations
3 Executive Summary (Page No. - 27)
4 Premium Insights (Page No. - 31)
4.1 Attractive Opportunities in the Confectionery Processing Equipment Market
4.2 Market For Confectionery Processing Equipment, By Equipment Type
4.3 Market For Confectionery Processing Equipment, By Mode of Operation & Region
4.4 Asia Pacific: Market For Confectionery Processing Equipment, By Product & Country
4.5 Market For Confectionery Processing Equipment, 2018 vs 2023
5 Market Overview (Page No. - 36)
5.1 Introduction
5.2 Market Dynamics
5.2.1 Drivers
5.2.1.1 Growth of the Global Retail Industry
5.2.1.2 Product Availability and New Trends in the Confectionery Industry
5.2.2 Restraints
5.2.2.1 Increase in Awareness Regarding the Ill Effects of Sugar Consumption Among Consumers
5.2.3 Opportunities
5.2.3.1 Growth Opportunities in the Asia Pacific Region
5.2.3.2 Increase in Demand for Sugar-Free and Organic Confectionery Products
5.2.4 Challenges
5.2.4.1 High R&D Expenditure
5.3 Supply Chain Analysis
6 Confectionery Processing Equipment Market, By Type (Page No. - 44)
6.1 Introduction
6.2 Thermal Equipment
6.3 Extrusion Equipment
6.4 Mixers, Blenders, and Cutters
6.5 Cooling Equipment
6.6 Coating Equipment
6.7 Other Equipment
7 Confectionery Processing Equipment Market, By Product (Page No. - 52)
7.1 Introduction
7.2 Soft Confectionery
7.3 Hard Candies
7.4 Chewing Gums
7.5 Gummies & Jellies
7.6 Others
8 Confectionery Processing Equipment Market, By Mode of Operation (Page No. - 64)
8.1 Introduction
8.2 Automatic
8.3 Semi-Automatic
9 Confectionery Processing Equipment Market, By Region (Page No. - 68)
9.1 Introduction
9.2 North America
9.2.1 US
9.2.2 Canada
9.2.3 Mexico
9.3 Europe
9.3.1 Germany
9.3.2 Italy
9.3.3 Switzerland
9.3.4 Belgium
9.3.5 UK
9.3.6 Rest of Europe
9.4 Asia Pacific
9.4.1 China
9.4.2 Japan
9.4.3 India
9.4.4 Australia & New Zealand
9.4.5 Rest of Asia Pacific
9.5 RoW
9.5.1 South America
9.5.2 Middle East & Africa
10 Competitive Landscape (Page No. - 101)
10.1 Overview
10.2 Market Ranking
10.3 Competitive Scenario
10.3.1 New Product Launch
10.3.2 Expansions
10.3.3 Acquisitions
10.3.4 Partnerships, Mergers, & Agreements
11 Company Profile (Page No. - 108)
(Business Overview, Products Offered, Recent Developments, SWOT Analysis, MnM View)*
11.1 Bosch
11.2 B�hler AG
11.3 GEA Group
11.4 Alfa Laval
11.5 JBT Corporation
11.6 Aasted
11.7 BCH Ltd.
11.8 Tanis Confectionery
11.9 Baker Perkins
11.10 Sollich
11.11 Heat and Control, Inc.
11.12 Rieckermann GmbH
*Details on Business Overview, Products Offered, Recent Developments, SWOT Analysis, MnM View Might Not Be Captured in Case of Unlisted Companies.
12 Appendix (Page No. - 135)
12.1 Discussion Guide
12.2 Knowledge Store: Marketsandmarkets� Subscription Portal
12.3 Introducing RT: Real-Time Market Intelligence
12.4 Available Customizations
12.5 Related Reports
12.6 Author Details
List of Tables (61 Tables)
Table 1 US Doller Exchange Rate, 2014�2017
Table 2 Confectionery Processing Equipment Market Size, By Type, 2016�2023 (USD Million)
Table 3 Thermal Equipment Market Size, By Region, 2016�2023 (USD Million)
Table 4 Extrusion Equipment Market Size, By Region, 2016�2023 (USD Million)
Table 5 Mixers, Blenders, and Cutters Market Size, By Region, 2016�2023 (USD Million)
Table 6 Cooling Equipment Market Size, By Region, 2016�2023 (USD Million)
Table 7 Coating Equipment Market Size, By Region, 2016�2023 (USD Million)
Table 8 Other Equipment Market Size, By Region, 2016�2023 (USD Million)
Table 9 Market Size For Confectionery Processing Equipment, By Product, 2016�2023 (USD Million)
Table 10 Market Size For Soft Confectionery Processing Equipment, By Region, 2016�2023 (USD Million)
Table 11 Market Size For Soft Confectionery Processing Equipment, By Countries, 2016�2023 (USD Million)
Table 12 Hard Candies Processing Equipment Market Size, By Region, 2016�2023 (USD Million)
Table 13 Hard Candies Processing Equipment Market Size, By Countries, 2016�2023 (USD Million)
Table 14 Chewing Gums Processing Equipment Market Size, By Region, 2016�2023 (USD Million)
Table 15 Chewing Gums Processing Equipment Market Size, By Countries, 2016�2023 (USD Million)
Table 16 Confectionery Processing Equipment Market Size for Gummies & Jellies, By Region, 2016�2023 (USD Million)
Table 17 Gummies & Jellies Confectionery Processing Equipment Market Size, By Countries, 2016�2023 (USD Million)
Table 18 Other Confectionery Product Processing Equipment Market Size, By Region, 2016�2023 (USD Million)
Table 19 Other Confectionery Product Processing Equipment Market Size, By Countries, 2016�2023 (USD Million)
Table 20 Market Size For Confectionery Processing Equipment, By Mode of Operation, 2016�2023 (USD Million)
Table 21 Market Size For Automatic Confectionery Processing Equipment, By Region, 2016�2023 (USD Million)
Table 22 Market Size For Semi-Automatic Confectionery Processing Equipment, By Region, 2016�2023 (USD Million)
Table 23 Market Size For Confectionery Processing Equipment, By Region, 2016�2023 (USD Million)
Table 24 Market Size For Confectionery Processing Equipment, By Countries, 2016�2023 (USD Million)
Table 25 North America: Market Size For Confectionery Processing Equipment, By Country, 2016�2023 (USD Million
Table 26 North America: Market Size For Confectionery Processing Equipment, By Type, 2016�2023 (USD Million)
Table 27 North America: Market Size For Confectionery Processing Equipment, By Product, 2016�2023 (USD Million)
Table 28 North America: Market Size For Confectionery Processing Equipment, By Mode of Operation, 2016�2023 (USD Million)
Table 29 US: Market Size For Confectionery Processing Equipment, By Product, 2016-2023 (USD Million)
Table 30 Canada: Market Size For Confectionery Processing Equipment, By Product, 2016-2023 (USD Million)
Table 31 Mexico:Market Size For Confectionery Processing Equipment, By Product, 2016-2023 (USD Million)
Table 32 Europe: Market Size For Confectionery Processing Equipment, By Country, 2016�2023 (USD Million)
Table 33 Europe: Market Size For Confectionery Processing Equipment, By Type, 2016�2023 (USD Million)
Table 34 Europe: Market Size For Confectionery Processing Equipment, By Product, 2016�2023 (USD Million)
Table 35 Europe: Market Size For Confectionery Processing Equipment, By Mode of Operation, 2016�2023 (USD Million)
Table 36 Germany: Market Size For Confectionery Processing Equipment, By Product, 2016�2023 (USD Million)
Table 37 Italy: Market Size For Confectionery Processing Equipment, By Product, 2016�2023 (USD Million)
Table 38 Switzerland: Market Size For Confectionery Processing Equipment, By Product, 2016�2023 (USD Million)
Table 39 Belgium: Market Size For Confectionery Processing Equipment, By Product, 2016�2023 (USD Million)
Table 40 UK: Market Size For Confectionery Processing Equipment, By Product, 2016�2023 (USD Million)
Table 41 Rest of Europe: Market Size For Confectionery Processing Equipment, By Product, 2016�2023 (USD Million)
Table 42 Asia Pacific: Market Size For Confectionery Processing Equipment, By Country, 2016�2023 (USD Million)
Table 43 Asia Pacific: Market Size For Confectionery Processing Equipment, By Type, 2016�2023 (USD Million)
Table 44 Asia Pacific: Market Size For Confectionery Processing Equipment, By Product, 2016�2023 (USD Million)
Table 45 Asia Pacific: Market Size For Confectionery Processing Equipment, By Mode of Operation, 2016�2023 (USD Million)
Table 46 China: Market Size For Confectionery Processing Equipment, By Product, 2016�2023 (USD Million)
Table 47 Japan: Market Size For Confectionery Processing Equipment, By Product, 2016�2023 (USD Million)
Table 48 India: Market Size For Confectionery Processing Equipment, By Product, 2016�2023 (USD Million)
Table 49 Australia: Market Size For Confectionery Processing Equipment, By Product, 2016�2023 (USD Million)
Table 50 Rest of Asia Pacific: Market Size For Confectionery Processing Equipment, By Product, 2016�2023 (USD Million)
Table 51 RoW: Market Size For Confectionery Processing Equipment, By Region, 2016�2023 (USD Million)
Table 52 RoW: Market Size For Confectionery Processing Equipment, By Type, 2016�2023 (USD Million)
Table 53 RoW:Market Size For Confectionery Processing Equipment, By Product, 2016�2023 (USD Million)
Table 54 RoW: Market Size For Confectionery Processing Equipment, By Mode of Operation, 2016�2023 (USD Million)
Table 55 South America: Market Size For Confectionery Processing Equipment, By Product, 2016�2023 (USD Million)
Table 56 Middle East & Africa: Market Size For Confectionery Processing Equipment, By Product, 2016�2023 (USD Million)
Table 57 Top Five Companies in the Confectionery Processing Equipment Market, 2016
Table 58 New Product Launch, 2013�2017
Table 59 Expansions, 2013�2017
Table 60 Acquisitions, 2013-2017
Table 61 Partnerships, Mergers, & Agreements 2013-2017
List of Figures (46 Figures)
Figure 1 Confectionery Processing Equipment Market Segmentation
Figure 2 Regional Scope
Figure 3 Confectionery Processing Equipment Market: Research Design
Figure 4 Breakdown of Primary Interviews: By Company Type, Designation, and Region
Figure 5 Market Size Estimation Methodology: Top-Down Approach
Figure 6 Market Size Estimation Methodology: Bottom-Up Approach
Figure 7 Market Breakdown & Data Triangulation
Figure 8 Research Assumptions
Figure 9 Research Limitations
Figure 10 Market Size For Confectionery Processing Equipment, By Type, 2018 vs 2023
Figure 11 Market Size For Confectionery Processing Equipment, By Mode of Operation, 2018 vs 2023
Figure 12 Market Size For Confectionery Processing Equipment, By Product, 2018 vs 2023 (USD Million)
Figure 13 Market Share of Confectionery Processing Equipment, By Region, 2017
Figure 14 Growing Retail Industry to Drive Market Growth
Figure 15 Extrusion Segment to Witness the Fastest Growth Between 2018 & 2023
Figure 16 Automatic Segment Estimated to Dominate the Market, in Terms of Value, in All Regions in 2017
Figure 17 Soft Confectionery Segment Accounted for the Largest Share in Asia Pacific in 2017
Figure 18 North America is Projected to Dominate the Market For Confectionery Processing Equipment Through 2023
Figure 19 Confectionery Processing Equipment Market: Drivers, Restraints, Opportunities, and Challenges
Figure 20 US: Export of Chocolate Confectionery, 2012�2016
Figure 21 Asia Pacific: Population Growth, 2010�2016
Figure 22 Research & Development Expenditure Incurred By Key Players in the Market For Confectionery Processing Equipment, 2014�2017 (USD Million)
Figure 23 Confectionery Processing Equipment Market: Supply Chain Analysis
Figure 24 Thermal Equipment to Lead the Market Through 2023
Figure 25 Soft Confectionery Segment to Lead the Market Through 2023
Figure 26 Automatic Segment to Dominate the Market For Confectionery Processing Equipment Through 2023
Figure 27 North America to Lead the Market By 2023
Figure 28 North America: Market Snapshot
Figure 29 Europe: Leading Importers of Food Processing Equipment Parts (Including Confectionery), 2015
Figure 30 Europe: Market Snapshot
Figure 31 German Production of Confectionery, 2017 (USD Million)
Figure 32 Share of Leading Export Markets for Chocolate Confectionery, 2016
Figure 33 Asia Pacific: Market Snapshot
Figure 34 Imports of Machinery Used in Confectionery Processing (USD Million)
Figure 35 Key Developments of the Leading Players in the Market For Confectionery Processing Equipment During 2013�2017
Figure 36 Market Evaluation Framework
Figure 37 Bosch: Company Snapshot
Figure 38 Bosch: SWOT Analysis
Figure 39 B�hler AG: Company Snapshot
Figure 40 B�hler: SWOT Analysis
Figure 41 GEA Group: Company Snapshot
Figure 42 GEA Group: SWOT Analysis
Figure 43 Alfa Laval: Company Snapshot
Figure 44 Alfa Laval: SWOT Analysis
Figure 45 JBT Corporation: Company Snapshot
Figure 46 JBT Corporation: SWOT Analysis


Growth opportunities and latent adjacency in Confectionery Processing Equipment Market