Cell Signaling Market by Type (Endocrine, Paracrine), Pathway (Akt, AMPK, Hedgehog, Notch), Product (Consumables, Instruments), Technology (Flow Cytometry, ELISA, Mass Spectrometry) & Application (Research, Cancer, Immunology) - Global Forecast to 2022


[212 Pages Report]The cell signaling market is expected to grow from USD 2.53 billion in 2017 to USD 3.51 billion by 2022, at a CAGR of 6.8%. This report aims to estimate the market size and potential for growth in the cell signaling market across different segments such as type, product, technology, pathway, applications, and regions. This study also provides detailed information regarding factors influencing the growth of the market such as drivers, restraints, challenges and opportunities.
Market Dynamics
Drivers
- Rising Incidence of Chronic Diseases
- Availability of Funding for Cell-Based Research
- Technological Advancements in Cell-Based Research Instruments
- Growth of End-Use Industries
Restraints
- High Cost of Cell Signaling Systems
- Ethical Issues Related to Embryonic Stem Cell Signaling Research
Opportunities
- Emerging Markets
- Emergence of Microfluidics in Cell Biology Research
Challenges
- Complexities Related to Antibody and Reagent Development
Availability of funding cell based research is key driver for the global cell signalling market
Governments of various countries are promoting and supporting cell-based research activities such as cell signalling, single-cell analysis, and stem cell research. A large portion of the funding from governments is provided to academic research societies to promote cell-based research, which helps in the evaluation of diagnostic and therapeutic applications of various types of cells in the management of chronic and infectious diseases. By driving research into the application and end-user industries for cell analysis, the availability of support plays a significant role in aiding market growth.
Objectives Of The Study
- To define, describe, and forecast the cell signaling market on the basis of signaling type, product, technology, pathway, application, and region
- To provide detailed information regarding the major factors influencing growth of the market (drivers, restraints, and opportunities)
- To strategically analyze micromarkets1 with respect to individual growth trends, future prospects, and contributions to the overall market
- To analyze the opportunities in the market for stakeholders and provide details of a competitive landscape for market leaders
- To forecast revenue of the market segments with respect to four main regional segments, namely, North America, Europe, Asia, and the Rest of the World (RoW)2
- To profile key players and comprehensively analyze their market shares and core competencies3 in terms of market development and growth strategies
- To track and analyze competitive developments such as agreements, collaborations, and partnerships; acquisitions; and product launches in the cell signaling market
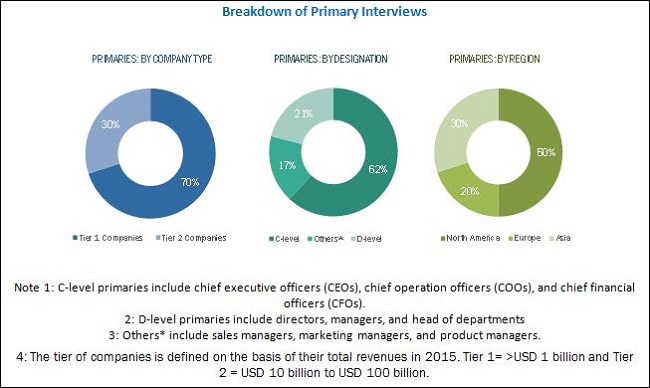
The research methodology used to estimate and forecast the cell signaling market begins with capturing data from secondary sources such as WHO, NCBI, UN DESA, GLOBOCAN, CRG, and others. The bottom-up procedure was employed to arrive at the overall market size of the cell signaling market from the revenue of the key players. After arriving at the overall market size, the entire market was split into several segments and subsegments which are then verified through primary research by conducting extensive interviews with CEOs, VPs, directors, executives, and others.
To know about the assumptions considered for the study, download the pdf brochure
The cell signaling ecosystem comprises reagent and antibody manufacturers such as Merck KGaA (Germany), Becton, Dickinson and Company (U.S.), Beckman Coulter, Inc. (U.S.) (a subsidiary of Danaher Corporation), Thermo Fisher Scientific Inc. (U.S.), Bio-Rad Laboratories, Inc. (U.S.), QIAGEN N.V. (Netherlands), PerkinElmer Inc. (U.S.), Promega Corporation (U.S.), Bio-Techne Corporation (U.S.), Cell Signaling Technology, Inc. (U.S.), Abcam plc (U.K.), Miltenyi Biotec (Germany), Cell Biolabs, Inc. (U.S.), Full Moon BioSystems, Inc. (U.S.), Cisbio Bioassays (France), BioVision, Inc. (U.S.), Rockland Immunochemicals Inc. (U.S.), Tonbo Biosciences (U.S.), StressMarq Biosciences Inc. (U.S.), BPS Bioscience, Inc. (U.S.), Abeomics, Inc. (U.S.), RayBiotech, Inc. (U.S.), MEDICAL & BIOLOGICAL LABORATORIES CO.,LTD. (Japan), Sino Biological, Inc. (U.S.), and Santa Cruz Biotechnology, Inc. (U.S.).
Major Market Developments
- In 2016, Thermo Fisher Scientific Inc. (U.S.) acquired FEI Company (U.S.) to strengthen its high-performance electron Microscopy business.
- In 2017, Becton, Dickinson and Company (U.S.) launched BD Resolve Single-Cell Gene Expression platform. This has strengthen the position of company in cell signalling market.
- In 2016, Cell Signaling Technology Inc. (U.S.) launched CellSimple Cell Analyzer. This helped company to strengthen the presence in cell signalling market.
Key Target Audience:
- Cell signaling associations
- Research & consulting firms
- Distributors of cell signaling research products
- Contract manufacturers of cell signaling consumables and instruments
- Research institutes and clinical research organizations (CROs)
- Venture capitalists
- Government associations
Critical questions the report answers
- How the market developments of key players impact the overall industry?
- What are the restraining factors for this market?
Scope of the Report:
This report categorizes the cell signaling market into the following segments:
Cell Signaling Market, by Product
- Consumables
- Instruments
Cell Signaling Market, by Type
- Endocrine Signaling
- Paracrine Signaling
- Autocrine Signaling
- Juxtacrine Signaling
- Other Signaling Types
Cell Signaling Market, by Pathway
- Akt
- AMPK
- ErbB/HER
- Hedgehog (Hh)
- JAK/STAT
- NF-êB
- Notch
- Other Signaling Pathways
Cell Signaling Market, by Technology
- Microscopy
- Western Blotting
- Flow Cytometry
- Immunohistochemistry (IHC)
- ELISA
- Mass Spectrometry
- Other Technologies
Cell Signaling Market, by Application
- Research Applications
- Medical Applications
Cell Signaling Market, by Region
-
North America
- U.S.
- Canada
-
Europe
- Germany
- France
- U.K.
- Italy
- Spain
- Rest of Europe (RoE)
-
Asia
- China
- Japan
- India
- Rest of Asia (RoA)
- Rest of the World (RoW)
Available Customization Options:
With the given market data, MarketsandMarkets offers customizations as per the company’s specific needs. The following customization options are available for the report:
- Company Information: Detailed company profiles of five or more market players
- Opportunities Assessment: A detailed report underlining the various growth opportunities presented in the market
The cell signaling market is projected to reach USD 3.51 billion by 2022 from USD 2.53 billion in 2017, at a CAGR of 6.8%. The term “cell signaling” is used to define the complex interactive system of signals that regulates and mediate various cellular responses in the human body.
Cell signaling is used to study signaling pathways of cells in drug discovery and therapeutic development, to distinguish drug resistance patterns in cancerous cells. It also identifies the major signaling pathways impacted by specific drug treatments. Cell signaling pathways—also called signal transduction pathways—act as connecting links between environmental stimuli and the corresponding cellular response. These signaling pathways mainly consist of proteins that can interact, move to specific locations, or be modified.
Growth in the Medical Supplies market is primarily driven by rising incidence of chronic diseases, and availability of funding for cell-based research activities. Other factors that are also positively affecting the growth of this market are technological advancements in cell-based research instruments and growth in life science and biopharmaceutical industries. However, ethical issues related to embryonic stem cell signaling research and the high cost of cell signaling systems are expected to hinder the growth of this market.
Based on the type, the cell signaling market is segmented into paracrine, autocrine, endocrine, juxtacrine, and other signaling types (neuronal and intracrine). The endocrine signaling segment is estimated to account the largest share of cell signaling market in 2017.
By product, the cell signaling market is segmented into consumables (reagents, assay kits, antibodies, and other consumables) and instruments. In 2017, the consumables segment is estimated to account the largest share of the cell signaling market.
Based on technology, the cell signaling market is segmented into microscopy, western blotting, immunohistochemistry (IHC), flow cytometry, enzyme-linked immunosorbent assay (ELISA), mass spectrometry, and other technologies (immunofluorescence and immunoprecipitation). The microscopy segment is estimated to account the largest share of cell signaling market in 2017.
Based on application, the cell signaling market is segmented into research applications (stem cell, immunology, cancer, and other research applications), and medical applications. The research applications segment is estimated to account the largest share of cell signaling market in 2017.
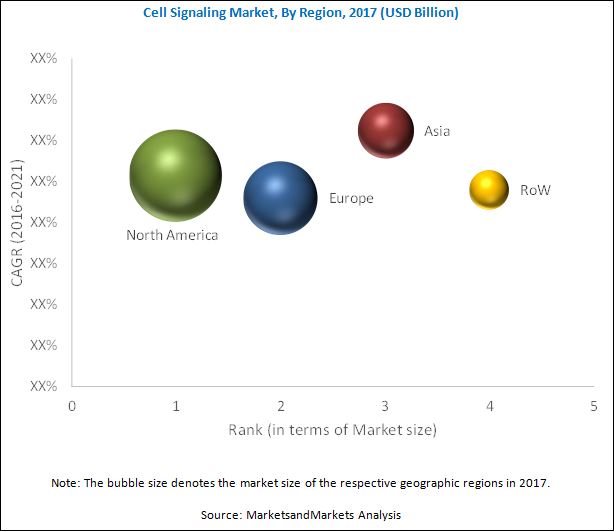
In 2017, the medical supplies market is dominated by North America, followed by Europe. North America is expected to continue to dominate the market by 2022. Asia is projected to witness the highest CAGR, centered at China, Japan, and India, during the forecast period.
Research application drive the growth of cell signalling Market during the forecast period
Research Application
Research is an important application segment in the cell signaling industry and has witnessed significant growth in recent years owing to the increasing incidence of chronic diseases, technological advancements in cell biology instruments, and increase in the cell-based research activities across the globe.
The rising number of patients suffering from chronic diseases such as cancer, diabetes, cardiovascular disorders, and neurological conditions has led to an increase in cell signaling-based research across the globe. According to the 2014 report of the American Heart Foundation, nearly 17.3 million people die due to cardiovascular diseases (CVDs) each year, accounting for 30% of global deaths. This number is projected to increase to 23.6 million by 2030. Moreover, according to the WHO, cancer is the second-most-common cause of death in the U.S.; 1,658,370 cancer cases were diagnosed in the country in 2015 (Source: American Cancer Society). The growing incidence of these diseases is one of the major factors driving the demand for cell biology-based procedures across the globe.
Critical questions the report answers:
- Where will all these developments take the industry in the mid to long term?
- What are the upcoming industry applications?
Ethical issues related to embryonic stem cell signalling research is a major factor restraining the growth of the market. Research in cell biology necessitates the use of animals and humans, as animal and human cells are used in gene therapy studies that involve the recombination of genes and stem cell research therapies. These cells are also used for in vivo toxicity and pharmacokinetic testing of drugs that may harm animals and humans. In addition, stem cell research studies use human embryos for clinical applications that often lead to the destruction of the embryos.
The major players in the Cell Signaling Market include QIAGEN N.V. (Netherlands), Beckman Becton, Dickinson and Company (U.S.), Thermo Fisher Scientific Inc. (U.S.), Merck KGaA (Germany), Promega Corporation (U.S.), PerkinElmer Inc. (U.S.), Bio-Rad Laboratories, Inc. (U.S.), Coulter, Inc. (U.S.) (a subsidiary of Danaher Corporation), Bio-Techne Corporation (U.S.), Miltenyi Biotec (Germany), Abcam plc (U.K.), Cell Signaling Technology, Inc. (U.S.), Cisbio Bioassays (France), Cell Biolabs, Inc. (U.S.), Full Moon BioSystems, Inc. (U.S.), Tonbo Biosciences (U.S.), BioVision, Inc. (U.S.), StressMarq Biosciences Inc. (U.S.), RayBiotech, Inc. (U.S.), Rockland Immunochemicals Inc. (U.S.), Abeomics, Inc. (U.S.), BPS Bioscience, Inc. (U.S.), MEDICAL & BIOLOGICAL LABORATORIES CO.,LTD. (Japan), Sino Biological, Inc. (U.S.), and Santa Cruz Biotechnology, Inc. (U.S.).
To speak to our analyst for a discussion on the above findings, click Speak to Analyst
 Exclusive indicates content/data unique to MarketsandMarkets and not available with any competitors.
Table of Contents
1 Introduction (Page No. - 20)
1.1 Objectives of the Study
1.2 Market Definition
1.3 Market Scope
1.3.1 Markets Covered
1.3.2 Years Considered for the Study
1.4 Currency
1.5 Limitations
1.6 Stakeholders
2 Research Methodology (Page No. - 23)
2.1 Secondary Data
2.1.1 Key Data From Secondary Sources
2.2 Primary Data
2.2.1 Key Data From Primary Sources
2.3 Market Size Estimation
2.3.1 Bottom-Up Approach
2.3.2 Top-Down Approach
2.4 Market Breakdown & Data Triangulation
2.5 Assumptions for the Study
3 Executive Summary (Page No. - 31)
4 Premium Insights (Page No. - 36)
4.1 Cell Signaling: Market Overview
4.2 Geographic Analysis: Market By Signaling Type & Region (2017)
4.3 Cell Signaling Market, By Pathway, 2017–2022
4.4 Geographical Snapshot of the Market
5 Market Overview (Page No. - 39)
5.1 Introduction
5.2 Market Dynamics
5.2.1 Drivers
5.2.1.1 Rising Incidence of Chronic Diseases
5.2.1.2 Availability of Funding for Cell-Based Research
5.2.1.3 Technological Advancements in Cell-Based Research Instruments
5.2.1.4 Growth of End-Use Industries
5.2.2 Restraints
5.2.2.1 High Cost of Cell Signaling Systems
5.2.2.2 Ethical Issues Related to Embryonic Stem Cell Signaling Research
5.2.3 Opportunities
5.2.3.1 Emerging Markets
5.2.3.2 Emergence of Microfluidics in Cell Biology Research
5.2.4 Challenges
5.2.4.1 Complexities Related to Antibody and Reagent Development
6 Global Cell Signaling Market, By Signaling Type (Page No. - 47)
6.1 Introduction
6.2 Endocrine Signaling
6.3 Paracrine Signaling
6.4 Autocrine Signaling
6.5 Juxtacrine Signaling
6.6 Other Signaling Types
7 Global Cell Signaling Market, By Product (Page No. - 54)
7.1 Introduction
7.2 Consumables
7.2.1 Antibodies
7.2.2 Reagents
7.2.3 Assay Kits
7.2.4 Other Consumables
7.3 Instruments
8 Global Cell Signaling Market, By Technology (Page No. - 63)
8.1 Introduction
8.2 Microscopy
8.3 Flow Cytometry
8.4 Mass Spectrometry
8.5 Western Blotting
8.6 Elisa
8.7 Immunohistochemistry
8.8 Other Technologies
9 Global Cell Signaling Market, By Pathway (Page No. - 71)
9.1 Introduction
9.2 AKT Signaling Pathway
9.3 AMPK Signaling Pathway
9.4 ErbB/HER Signaling Pathway
9.5 Hedgehog Signaling Pathway
9.6 JAK/STAT Signaling Pathway
9.7 Notch Signaling Pathway
9.8 NF-KB Signaling Pathway
9.9 Other Signaling Pathways
10 Cell Signaling Market, By Application (Page No. - 79)
10.1 Introduction
10.2 Research Applications
10.2.1 Cancer Research
10.2.2 Immunology Research
10.2.3 Stem Cells Research
10.2.4 Other Research Applications
10.3 Medical Applications
11 Global Cell Signaling Market, By Region (Page No. - 87)
11.1 Introduction
11.2 North America
11.2.1 U.S.
11.2.2 Canada
11.3 Europe
11.3.1 Germany
11.3.2 France
11.3.3 U.K.
11.3.4 Italy
11.3.5 Spain
11.3.6 Rest of Europe (RoE)
11.4 Asia
11.4.1 China
11.4.2 Japan
11.4.3 India
11.4.4 Rest of Asia (RoA)
11.5 Rest of the World (RoW)
12 Competitive Landscape (Page No. - 157)
12.1 Introduction
12.2 Vendor Dive Overview
12.2.1 Vanguards
12.2.2 Innovators
12.2.3 Dynamic Players
12.2.4 Emerging Players
12.3 Competitive Benchmarking
12.3.1 Product Offerings (For All 25 Players)
12.3.2 Business Strategy (For All 25 Players)
*Top 25 Companies Analyzed for This Study are - Merck KGaA (Germany), Thermo Fisher Scientific Inc. (U.S.), Becton, Dickinson and Company (U.S.), Beckman Coulter, Inc. (U.S.) (A Subsidiary of Danaher Corporation), Bio-Rad Laboratories, Inc. (U.S.), Perkinelmer Inc. (U.S.), Qiagen N.V. (Netherlands), Cell Signaling Technology, Inc. (U.S.), Promega Corporation (U.S.), Bio-Techne Corporation (U.S.), Abcam PLC (U.K.), Miltenyi Biotec (Germany), Full Moon Biosystems, Inc. (U.S.), Cell Biolabs, Inc. (U.S.), Cisbio Bioassays (France), Rockland Immunochemicals Inc. (U.S.), Biovision, Inc. (U.S.), Tonbo Biosciences (U.S.), Bps Bioscience, Inc. (U.S.), Stressmarq Biosciences Inc. (U.S.), Abeomics, Inc. (U.S.), Sino Biological, Inc. (U.S.), Raybiotech, Inc. (U.S.), Medical & Biological Laboratories Co.,Ltd. (Japan), and Santa Cruz Biotechnology, Inc. (U.S.)
13 Company Profiles (Page No. - 161)
(Overview, Products and Services, Financials, Strategy & Development)*
13.1 Merck KGaA
13.2 Thermo Fisher Scientific Inc.
13.3 Becton, Dickinson and Company
13.4 Beckman Coulter Inc. (A Subsidiary of Danaher Corporation)
13.5 Bio-Rad Laboratories, Inc.
13.6 Perkinelmer, Inc
13.7 Qiagen N.V.
13.8 Cell Signaling Technology, Inc.
13.9 Promega Corporation
13.10 Bio-Techne Corporation
*Details on Overview, Products and Services, Financials, Strategy & Development Might Not Be Captured in Case of Unlisted Companies.
14 Key Innovators (Page No. - 201)
14.1 Cisbio Bioassays
14.1.1 Innovations
14.2 Miltenyi Biotec
14.2.1 Innovations
14.3 Cell Biolabs, Inc.
14.3.1 Innovations
15 Appendix (Page No. - 203)
15.1 Industry Insights
15.2 Discussion Guide
15.3 Knowledge Store: Marketsandmarkets’ Subscription Portal
15.4 Introducing RT: Real-Time Market Intelligence
15.5 Available Customizations
15.6 Related Reports
15.7 Author Details
List of Tables (157 Tables)
Table 1 Cell Signaling: Market Snapshot
Table 2 Projected Increase in Cancer Patients, By Type (2012, 2015, and 2035)
Table 3 Cell Signaling Market Size, By Type, 2015-2022 (USD Million)
Table 4 Endocrine Signaling Market Size, By Region, 2015–2022 (USD Million)
Table 5 Paracrine Signaling Market Size, By Region, 2015–2022 (USD Million)
Table 6 Autocrine Signaling Market Size, By Region, 2015–2022 (USD Million)
Table 7 Juxtacrine Signaling Market Size, By Region, 2015–2022 (USD Million)
Table 8 Other Cell Signaling Types Market Size, By Region, 2015–2022 (USD Million)
Table 9 Cell Signaling Market Size, By Product, 2015–2022 (USD Million)
Table 10 Cell Signaling Consumables Market Size, By Region, 2015–2022 (USD Million)
Table 11 Cell Signaling Consumables Market Size, By Type, 2015–2022 (USD Million)
Table 12 Cell Signaling Antibodies Market Size, By Region, 2015–2022 (USD Million)
Table 13 Cell Signaling Reagents Market Size, By Region, 2015–2022 (USD Million)
Table 14 Cell Signaling Assay Kits Market Size, By Region, 2015–2022 (USD Million)
Table 15 Other Cell Signaling Consumables Market Size, By Region, 2015–2022 (USD Million)
Table 16 Cell Signaling Instruments Market Size, By Region, 2015–2022 (USD Million)
Table 17 Cell Signaling Market Size, By Technology, 2015-2022 (USD Million)
Table 18 Cell Signaling Market Size for Microscopy, By Region, 2015–2022 (USD Million)
Table 19 Cell Signaling Market Size for Flow Cytometry, By Region, 2015–2022 (USD Million)
Table 20 Cell Signaling Market Size for Mass Spectrometry, By Region, 2015–2022 (USD Million)
Table 21 Cell Signaling Market Size for Western Blotting, By Region, 2015–2022 (USD Million)
Table 22 Cell Signaling Market Size for Elisa, By Region, 2015–2022 (USD Million)
Table 23 Cell Signaling Market Size for Immunohistochemistry, By Region, 2015–2022 (USD Million)
Table 24 Cell Signaling Market Size for Other Technologies, By Region, 2015–2022 (USD Million)
Table 25 Cell Signaling Market Size, By Pathway, 2015-2022 (USD Million)
Table 26 AKT Signaling Pathway Market Size, By Region, 2015–2022 (USD Million)
Table 27 AMPK Signaling Pathway Market Size, By Region, 2015–2022 (USD Million)
Table 28 ErbB/HER Signaling Pathway Market Size, By Region, 2015–2022 (USD Million)
Table 29 Hedgehog Signaling Pathway Market Size, By Region, 2015–2022 (USD Million)
Table 30 JAK/STAT Signaling Pathway Market Size, By Region, 2015–2022 (USD Million)
Table 31 Notch Signaling Pathway Market Size, By Region, 2015–2022 (USD Million)
Table 32 NF-KB Signaling Pathway Market Size, By Region, 2015–2022 (USD Million)
Table 33 Other Signaling Pathways Market Size, By Region, 2015–2022 (USD Million)
Table 34 Cell Signaling Market Size, By Application, 2015–2022 (USD Million)
Table 35 Cell Signaling Market Size for Research Applications, By Region, 2015–2022 (USD Million)
Table 36 Cell Signaling Market Size for Research Applications, By Type, 2015–2022 (USD Million)
Table 37 Cell Signaling Market Size for Cancer Research, By Region, 2015–2022 (USD Million)
Table 38 Cell Signaling Market Size for Immunology Research, By Region, 2015–2022 (USD Million)
Table 39 Cell Signaling Market Size for Stem Cells Research, By Region, 2015–2022 (USD Million)
Table 40 Cell Signaling Market Size for Other Research Applications, By Region, 2015–2022 (USD Million)
Table 41 Cell Signaling Market Size for Medical Applications, By Region, 2015–2022 (USD Million)
Table 42 Cell Signaling Market Size By Region, 2015–2022 (USD Million)
Table 43 North America: Market Size By Country, 2015–2022 (USD Million)
Table 44 North America: Market Size By Signaling Type, 2015–2022 (USD Million)
Table 45 North America: Market Size By Pathway, 2015–2022 (USD Million)
Table 46 North America: Market Size By Product, 2015–2022 (USD Million)
Table 47 North America: Cell Signaling Consumables Market Size, By Type, 2015–2022 (USD Million)
Table 48 North America: Market Size By Technology, 2015–2022 (USD Million)
Table 49 North America: Market Size By Application, 2015–2022 (USD Million)
Table 50 North America: Cell Signaling Research Applications Market Size, By Type, 2015–2022 (USD Million)
Table 51 U.S.: Market Size By Signaling Type, 2015–2022 (USD Million)
Table 52 U.S.: Market Size By Pathway, 2015–2022 (USD Million)
Table 53 U.S.: Market Size By Product, 2015–2022 (USD Million)
Table 54 U.S.: Cell Signaling Consumables Market Size, By Type, 2015–2022 (USD Million)
Table 55 U.S.: Market Size By Technology, 2015–2022 (USD Million)
Table 56 U.S.: Market Size By Application, 2015–2022 (USD Million)
Table 57 U.S.: Cell Signaling Research Applications Market Size, By Type, 2015–2022 (USD Million)
Table 58 Canada: Market Size By Signaling Type, 2015–2022 (USD Million)
Table 59 Canada: Market Size By Pathway, 2015–2022 (USD Million)
Table 60 Canada: Market Size By Product, 2015–2022 (USD Million)
Table 61 Canada: Cell Signaling Consumables Market Size, By Type, 2015–2022 (USD Million)
Table 62 Canada: Market Size By Technology, 2015–2022 (USD Million)
Table 63 Canada: Market Size By Application, 2015–2022 (USD Million)
Table 64 Canada: Cell Signaling Research Applications Market Size, By Type, 2015–2022 (USD Million)
Table 65 Europe: Market Size By Country, 2015–2022 (USD Million)
Table 66 Europe: Market Size By Signaling Type, 2015–2022 (USD Million)
Table 67 Europe: Market Size By Pathway, 2015–2022 (USD Million)
Table 68 Europe: Market Size By Product, 2015–2022 (USD Million)
Table 69 Europe: Cell Signaling Consumables Market Size, By Type, 2015–2022 (USD Million)
Table 70 Europe: Market Size By Technology, 2015–2022 (USD Million)
Table 71 North America: Market Size By Application, 2015–2022 (USD Million)
Table 72 Europe: Cell Signaling Research Applications Market Size, By Type, 2015–2022 (USD Million)
Table 73 Germany: Market Size By Signaling Type, 2015–2022 (USD Million)
Table 74 Germany: Market Size By Pathway, 2015–2022 (USD Million)
Table 75 Germany: Market Size By Product, 2015–2022 (USD Million)
Table 76 Germany: Cell Signaling Consumables Market Size, By Type, 2015–2022 (USD Million)
Table 77 Germany: Market Size By Technology, 2015–2022 (USD Million)
Table 78 Germany: Market Size By Application, 2015–2022 (USD Million)
Table 79 Germany: Cell Signaling Research Applications Market Size, By Type, 2015–2022 (USD Million)
Table 80 France: Market Size By Signaling Type, 2015–2022 (USD Million)
Table 81 France: Market Size By Pathway, 2015–2022 (USD Million)
Table 82 France: Market Size By Product, 2015–2022 (USD Million)
Table 83 France: Cell Signaling Consumables Market Size, By Type, 2015–2022 (USD Million)
Table 84 France: Market Size By Technology, 2015–2022 (USD Million)
Table 85 France: Market Size By Application, 2015–2022 (USD Million)
Table 86 France: Cell Signaling Research Applications Market Size, By Type, 2015–2022 (USD Million)
Table 87 U.K.: Market Size By Signaling Type, 2015–2022 (USD Million)
Table 88 U.K.: Market Size By Pathway, 2015–2022 (USD Million)
Table 89 U.K.: Market Size By Product, 2015–2022 (USD Million)
Table 90 U.K.: Cell Signaling Consumables Market Size, By Type, 2015–2022 (USD Million)
Table 91 U.K.: Market Size By Technology, 2015–2022 (USD Million)
Table 92 U.K.: Market Size By Application, 2015–2022 (USD Million)
Table 93 U.K.: Cell Signaling Research Applications Market Size, By Type, 2015–2022 (USD Million)
Table 94 Italy: Market Size By Signaling Type, 2015–2022 (USD Million)
Table 95 Italy: Market Size By Pathway, 2015–2022 (USD Million)
Table 96 Italy: Market Size By Product, 2015–2022 (USD Million)
Table 97 Italy: Cell Signaling Consumables Market Size, By Type, 2015–2022 (USD Million)
Table 98 Italy: Market Size By Technology, 2015–2022 (USD Million)
Table 99 Italy: Market Size By Application, 2015–2022 (USD Million)
Table 100 Italy: Cell Signaling Research Applications Market Size, By Type, 2015–2022 (USD Million)
Table 101 Spain: Market Size By Signaling Type, 2015–2022 (USD Million)
Table 102 Spain: Market Size By Pathway, 2015–2022 (USD Million)
Table 103 Spain: Market Size By Product, 2015–2022 (USD Million)
Table 104 Spain: Cell Signaling Consumables Market Size, By Type, 2015–2022 (USD Million)
Table 105 Spain: Market Size By Technology, 2015–2022 (USD Million)
Table 106 Spain: Market Size By Application, 2015–2022 (USD Million)
Table 107 Spain: Cell Signaling Research Applications Market Size, By Type, 2015–2022 (USD Million)
Table 108 RoE: Market Size,By Signaling Type, 2015–2022 (USD Million)
Table 109 RoE: Market Size By Pathway, 2015–2022 (USD Million)
Table 110 RoE: Market Size By Product, 2015–2022 (USD Million)
Table 111 RoE: Cell Signaling Consumables Market Size, By Type, 2015–2022 (USD Million)
Table 112 RoE:Market Size By Technology, 2015–2022 (USD Million)
Table 113 RoE: Market Size By Application, 2015–2022 (USD Million)
Table 114 RoE: Cell Signaling Research Applications Market Size, By Type, 2015–2022 (USD Million)
Table 115 Asia: Market Size By Country, 2015–2022 (USD Million)
Table 116 Asia: Market Size By Signaling Type, 2015–2022 (USD Million)
Table 117 Asia: Market Size By Pathway, 2015–2022 (USD Million)
Table 118 Asia: Market Size By Product, 2015–2022 (USD Million)
Table 119 Asia: Cell Signaling Consumables Market Size, By Type, 2015–2022 (USD Million)
Table 120 Asia: Market Size By Technology, 2015–2022 (USD Million)
Table 121 Asia: Market Size By Application, 2015–2022 (USD Million)
Table 122 Asia: Cell Signaling Research Applications Market Size, By Type, 2015–2022 (USD Million)
Table 123 China: Market Size By Signaling Type, 2015–2022 (USD Million)
Table 124 China: Market Size By Pathway, 2015–2022 (USD Million)
Table 125 China: Market Size By Product, 2015–2022 (USD Million)
Table 126 China: Cell Signaling Consumables Market Size, By Type, 2015–2022 (USD Million)
Table 127 China:Market Size By Technology, 2015–2022 (USD Million)
Table 128 China: Market Size By Application, 2015–2022 (USD Million)
Table 129 China: Cell Signaling Research Applications Market Size, By Type, 2015–2022 (USD Million)
Table 130 Japan: Market Size By Signaling Type, 2015–2022 (USD Million)
Table 131 Japan: Market Size By Pathway, 2015–2022 (USD Million)
Table 132 Japan: Market Size By Product, 2015–2022 (USD Million)
Table 133 Japan: Cell Signaling Consumables Market Size, By Type, 2015–2022 (USD Million)
Table 134 Japan: Market Size By Technology, 2015–2022 (USD Million)
Table 135 Japan: Market Size By Application, 2015–2022 (USD Million)
Table 136 Japan: Cell Signaling Research Applications Market Size, By Type, 2015–2022 (USD Million)
Table 137 India: Market Size By Signaling Type, 2015–2022 (USD Million)
Table 138 India: Market Size By Pathway, 2015–2022 (USD Million)
Table 139 India: Market Size By Product, 2015–2022 (USD Million)
Table 140 India: Cell Signaling Consumables Market Size, By Type, 2015–2022 (USD Million)
Table 141 India: Market Size By Technology, 2015–2022 (USD Million)
Table 142 India: Market Size By Application, 2015–2022 (USD Million)
Table 143 India: Cell Signaling Research Applications Market Size, By Type, 2015–2022 (USD Million)
Table 144 RoA: Market Size By Signaling Type, 2015–2022 (USD Million)
Table 145 RoA: Market Size By Pathway, 2015–2022 (USD Million)
Table 146 RoA: Market Size By Product, 2015–2022 (USD Million)
Table 147 RoA: Cell Signaling Consumables Market Size, By Type, 2015–2022 (USD Million)
Table 148 RoA: Market Size By Technology, 2015–2022 (USD Million)
Table 149 RoA: Market Size By Application, 2015–2022 (USD Million)
Table 150 RoA: Cell Signaling Research Applications Market Size, By Type, 2015–2022 (USD Million)
Table 151 RoW: Market Size By Signaling Type, 2015–2022 (USD Million)
Table 152 RoW: Market Size By Pathway, 2015–2022 (USD Million)
Table 153 RoW: Market Size By Product, 2015–2022 (USD Million)
Table 154 RoW: Cell Signaling Consumables Market Size, By Type, 2015–2022 (USD Million)
Table 155 RoW: Market Size By Technology, 2015–2022 (USD Million)
Table 156 RoW: Market Size By Application, 2015–2022 (USD Million)
Table 157 RoW: Cell Signaling Research Applications Market Size, By Type, 2015–2022 (USD Million)
List of Figures (76 Figures)
Figure 1 Research Design
Figure 2 Cell Signaling Market: Bottom-Up Approach
Figure 3 Top-Down Approach
Figure 4 Data Triangulation Methodology
Figure 5 Cell Signaling Market Size, By Signaling Type, 2017 vs 2022 (USD Billion)
Figure 6 Cell Signaling Market Size, By Pathway, 2017 vs 2022 (USD Billion)
Figure 7 Cell Signaling Market Size, By Product, 2017 vs 2022 (USD Billion)
Figure 8 Cell Signaling Market Size, By Technology, 2017 vs 2022 (USD Billion)
Figure 9 Cell Signaling Market Size, By Application, 2017 vs 2022 (USD Billion)
Figure 10 Cell Signaling Market Size, By Region, 2017 vs 2022 (USD Billion)
Figure 11 Growing Prevalence of Chronic Diseases and Availability of Funding for Cell-Based Research are Driving the Growth of the Cell Signaling Market During the Forecast Period
Figure 12 North America & Endocrine Segments are Estimated to Command the Largest Market Share in 2017
Figure 13 AKT Segment to Register the Highest CAGR During the Forecast Period
Figure 14 Asia to Register the Highest CAGR Between 2017 & 2022
Figure 15 Cell Signaling Market: Drivers, Restraints, and Opportunities
Figure 16 Diabetes Cases, 2015 vs 2040 (Million)
Figure 17 Endocrine Signaling Segment to Dominate the Cell Signaling Market During the Forecast Period
Figure 18 North America to Dominate the Endocrine Signaling Market During the Forecast Period
Figure 19 North America to Dominate the Autocrine Signaling Market During the Forecast Period
Figure 20 Consumables to Dominate the Cell Signaling Market During the Forecast Period
Figure 21 Antibodies to Dominate the Cell Signaling Consumables Market in 2017–2022
Figure 22 North America to Dominate the Cell Signaling Instruments Market During 2017–2022
Figure 23 Microscopy Segment to Dominate the Cell Signaling Technology Market During the Forecast Period
Figure 24 AKT Pathway Segment to Dominate the Cell Signaling Market in 2017–2022
Figure 25 Research Applications Segment Will Continue to Dominate the Cell Signaling Market in 2022
Figure 26 Asian Cell Signaling Market to Register the Highest CAGR During the Forecast Period
Figure 27 North America: Cancer Incidence & Mortality, 2012–2035
Figure 28 North America: Market Snapshot
Figure 29 U.S.: Cancer Incidence & Mortality, 2012–2035
Figure 30 Endocrine Segment to Account for the Largest Share of the U.S. Cell Signaling Market in 2017
Figure 31 Canada: Cancer Incidence & Mortality, 2012–2035
Figure 32 Europe: Cancer Incidence & Mortality, 2012–2035
Figure 33 Europe: Market Snapshot
Figure 34 Germany: Cancer Incidence & Mortality, 2012–2035
Figure 35 Germany: Revenue & R&D Expenditures of Major Biotechnology Companies, 2012–2015 (USD Billion)
Figure 36 AKT Segment to Register the Highest CAGR in the German Cell Signaling Market During the Forecast Period
Figure 37 France: Cancer Incidence & Mortality, 2012–2035
Figure 38 U.K.: Cancer Incidence & Mortality, 2012–2035
Figure 39 Italy: Cancer Incidence & Mortality, 2012–2035
Figure 40 Spain: Cancer Incidence & Mortality, 2012–2035
Figure 41 Asia: Cancer Incidence & Mortality, 2012–2035
Figure 42 Asia: Market Snapshot
Figure 43 China: Cancer Incidence & Mortality, 2012–2035
Figure 44 Japan: Cancer Incidence & Mortality, 2012–2035
Figure 45 Consumables Segment to Register the Highest CAGR in the Japanese Cell Signaling Market During the Forecast Period
Figure 46 India: Cancer Incidence & Mortality, 2012–2035
Figure 47 RoW: Market Snapshot
Figure 48 Dive Chart: Cell Signaling Market
Figure 49 Merck KGaA: Company Snapshot (2016)
Figure 50 Merck KGaA: Product Offering Scorecard
Figure 51 Merck KGaA: Business Strategy Scorecard
Figure 52 Thermo Fisher Scientific Inc.: Company Snapshot (2016)
Figure 53 Thermo Fisher Scientific Inc.: Product Offering Scorecard
Figure 54 Thermo Fisher Scientific Inc.: Business Strategy Scorecard
Figure 55 Becton, Dickinson and Company: Company Snapshot (2016)
Figure 56 Becton, Dickinson and Company: Product Offering Scorecard
Figure 57 Becton, Dickinson and Company: Business Strategy Scorecard
Figure 58 Danaher Corporation: Company Snapshot (2016)
Figure 59 Danaher Corporation: Product Offering Scorecard
Figure 60 Danaher Corporation: Business Strategy Scorecard
Figure 61 Bio-Rad Laboratories, Inc.: Company Snapshot (2016)
Figure 62 Bio-Rad Laboratories, Inc.: Product Offering Scorecard
Figure 63 Bio-Rad Laboratories, Inc.:: Business Strategy Scorecard
Figure 64 Perkinelmer, Inc.: Company Snapshot (2016)
Figure 65 Perkinelmer, Inc.: Product Offering Scorecard
Figure 66 Perkinelmer, Inc.: Business Strategy Scorecard
Figure 67 Qiagen N.V.: Company Snapshot (2016)
Figure 68 Qiagen N.V.: Product Offering Scorecard
Figure 69 Qiagen N.V.: Business Strategy Scorecard
Figure 70 Cell Signaling Technology Inc.: Product Offering Scorecard
Figure 71 Cell Signaling Technology Inc.: Business Strategy Scorecard
Figure 72 Promega Corporation: Product Offering Scorecard
Figure 73 Promega Corporation: Business Strategy Scorecard
Figure 74 Bio-Techne Corporation: Company Snapshot (2016)
Figure 75 Bio-Techne Corporation: Product Offering Scorecard
Figure 76 Bio-Techne Corporation: Business Strategy Scorecard

 Generating Response ...


Growth opportunities and latent adjacency in Cell Signaling Market