Catalytic Converter Market by Type (FWCC, TWCC, SCR, DOC, and LNT), Material (Platinum, Palladium, and Rhodium), Vehicle Type (Passenger Cars, LCV, Bus & Truck, Construction, and Agriculture & Mining), Aftermarket and Region - Global Forecast to 2025


The global catalytic converter market was estimated to be worth USD 42.4 billion in 2018 and is poised to reach USD 73.1 billion by 2025, growing at a CAGR of 8.10% from 2018 to 2025. The Asia Oceania region is projected to lead the catalytic converter market during the forecast period owing to the highest vehicle production compared to other regions such as North America and Europe. The increasing demand for passenger cars along with the rising stringency in emission norms would further fuel the demand for catalytic converters, especially in the European and North American countries.

The SCR segment is expected to be the largest contributor in the catalytic converter market during the forecast period
The SCR technology offers benefits including enhanced NOx reduction than LNT by nearly 90%, and hence, it is mostly preferred in diesel vehicles across the globe. SCR has a maximum installation rate in European and North American countries owing to the ongoing emission norms such as Euro 6 and Tier 3 respectively. Europe has a large adoption rate of diesel passenger cars and LCVs. Thus, it has a higher installation rate of SCRs compared to other regions such as Asia Oceania and North America for these vehicle types. Further, the newer trucks and buses in developed countries must withstand the permissible NOx limits and should be fitted with SCRs. Moreover, owing to the ongoing and upcoming stringent emission norms in developing countries such as China, India, and Thailand, the demand for SCRs is expected to increase significantly across all diesel vehicle types by 2022 at a global level.
Passenger car is estimated to dominate the catalytic converter market during the forecast period
By vehicle type, the passenger car segment is estimated to dominate the catalytic converter market owing to its largest share in vehicle production all over the world. Asia Oceania also happens to be one of the largest markets for passenger cars. However, the region has a low adoption rate for various aftertreatment devices. Moreover, the Asia Oceania passenger car market is dominated by gasoline engines that also restrict the adoption rate of various diesel aftertreatment devices. The adoption rate of aftertreatment devices in HDVs such as buses and trucks are higher as these vehicles are equipped with large diesel engines and emit a higher amount of harmful gases compared to passenger cars.
Asia Oceania is expected to account for the largest market size during the forecast period
Asia Oceania has the largest market share of vehicle production with about 54–56% of the total vehicle production. China, India, and Japan are the largest vehicle production hubs because of rising urbanization, increasing GDP, and industrialization among others. With the growing vehicle production, vehicle emissions have also increased significantly. Considering this, few countries such as China, Japan, and India have implemented vehicle emission norms. For instance, China and India are currently running on China IV and BS IV. However, they are planning to implement China VI and BS VI by 2020 which is equivalent to Euro VI. Moving toward strict emission norms will create a huge demand for various aftertreatment devices. In Asia Oceania, China and Japan are the leading countries for the catalytic converter market, by aftertreatment device.

Market Dynamics
Drivers
Stringent emission and fuel efficiency regulations around the globe to fuel the demand for catalytic converters
Exhaust emission from automobile sources has become a major contributor to air pollution and environmental problem. Increasing vehicle production has, in turn, increased emissions around the world.
Increasing aftermarket for catalytic converters
The demand for a catalytic converter in the aftermarket is influenced by factors such as increasing average age of vehicles, improving infrastructure, growing number of vehicles on the road, average miles driven, replacement cycle of catalytic converter, and growing concern about vehicle maintenance.
Increasing demand for SCR in heavy diesel engines
There has been an increase in emissions of polluting substances such as CO2 and NOx particles from vehicles into the environment. At present, there are two types of catalytic converters available for reducing NOx particle emissions from diesel engine vehicles, namely, Selective Catalytic Reduction (SCR) and Lean NOx-Trap (LNT).
Restraints
Increasing sales of battery electric vehicles
The global battery electric vehicle market has grown rapidly. Factors such as rising concerns over global warming and air pollution and the federal and state government support to reduce air pollution are driving the BEV market. BEVs use an electric motor to propel the vehicle. Hence, these vehicles are not equipped with an exhaust system or catalytic converters.
Opportunities
Nanoparticles for Catalytic Reduction
Catalytic converters use precious metals as catalysts to reduce the emission of harmful gases from the engine. These metals primarily include platinum, palladium, and rhodium. Nanotechnology is one of the solutions that scientists have found, to increase the effectiveness of the converter.
Introduction of Real Drive Emission (RDE) tests
The Real Drive Emission (RDE) test uses a Portable Emission Measurement System (PEMS) to measure harmful pollutants from the exhaust gas such as NOx emitted by a car while driving on the road. The RDE test is crucial to minimize the difference between approved vehicle emission results and those in the real world.
Recycling of automotive catalysts
Vehicle exhaust contains many harmful compounds such as carbon monoxide, hydrocarbons, and nitrogen oxides. Their volumes in the automotive exhaust gas can be decreased by fitting catalytic converters to the exhaust gas system. The price of these materials is very high, and that is why there is a need to collect and reuse the precious metals inside auto catalysts.
Challenges
Fluctuating price of precious group metals
Catalytic converters primarily use precious group metals such as platinum, palladium, and rhodium for the control of vehicular emissions. However, these precious metals are very expensive and add to the cost of catalytic converters. Furthermore, increasing stringency of emission regulations across the globe demands more use of these precious metals for the reduction of vehicular emissions, thereby increasing the cost of catalytic converters. The high cost of catalytic converter owing to the rising price and consumption of precious metals is a major challenge for catalytic converter manufacturers.
Controlling Adulteration in DEF
An appropriate concentration of DEF is needed to reduce NOx emissions and increase the life of SCR components.
Scope of the Report
|
Report Metric |
Details |
|
Market Size Available for Years |
2016–2025 |
|
Base Year Considered |
2017 |
|
Forecast Period |
2018–2025 |
|
Forecast Units |
Value (USD million/billion) and Volume (‘000/million units) |
|
Segments Covered |
Catalytic Converter Type, Vehicle Type, Off-Highway Vehicle Type, Material, Aftermarket, and Region |
|
Geographies Covered |
Asia Oceania, Europe, North America, and RoW |
|
Companies Covered |
Faurecia (France), Tenneco (US), Johnson Matthey (UK) (Germany), Eberspächer (Germany), and Umicore (Belgium) |
This research report categorizes the catalytic converter market based on catalytic converter type, vehicle type, off-highway vehicle type, material, aftermarket, and region.
Market, By Type
- Three-way catalytic converter (TWCC)
- Four-way catalytic converter (FWCC)
- Diesel oxidation catalyst (DOC)
- Selective catalytic reduction (SCR)
- Lean NOx trap (LNT)
Market, By Material
- Palladium
- Platinum
- Rhodium
- Others (Ruthenium, Iridium, Zeolites, and Vanadium)
Market, By Vehicle Type
- Passenger car
- Light commercial vehicle
- Truck
- Bus
Aftermarket, By Vehicle Type
- Passenger car
- Light commercial vehicle
- Heavy commercial vehicle
Market, By Off-highway Vehicle Type
- Agricultural Tractors
- Construction Equipment
- Mining Equipment
Market, By Region
- North America
- Europe
- Asia Oceania
- RoW
Key Market Players
The catalytic converter market is dominated by the global players and comprises several regional players. Some of the key players in the market are Faurecia (France), Tenneco (US), Continental (Germany), Eberspächer (Germany), Johnson Matthey (UK), Umicore (Belgium), Futaba (Japan), BAEF (Germany), CDTI Materials (US), and Benteler International (Austria). Faurecia is anticipated to be a dominant player in the market. Faurecia adopted the strategies of expansion, new product development, partnership, and mergers & acquisitions to retain its leading position in the market. Strengthening the product portfolio and global presence by building customer relationships, Faurecia has left a mark not only in the current market but also in emerging markets such as India. This is the strategy that Faurecia is following to maintain its leadership in the catalytic market.
Key Questions Addressed By The Report
- Which type of catalytic converter is going to dominate in the future?
- How are the industry players addressing the challenge of maintaining a balance between performance and low-cost diesel catalytic converter?
- When is SCR going to get mass adoption in the catalytic converter market for all vehicle types?
- What could be the market size of catalytic converters for off-highway vehicles?
- What could be the size of catalytic converters for the aftermarket?
Available Customizations
With the given market data, MarketsandMarkets offers customizations according to the company’s specific needs.
The following customization options are available for the report:
Market, by vehicle type, by country
- Passenger car
- LCV
- Truck
- Bus
Market, by fuel type, by country
- Gasoline
- Diesel
Market, by fuel type, by technology
- Gasoline
- Diesel
To speak to our analyst for a discussion on the above findings, click Speak to Analyst
 Exclusive indicates content/data unique to MarketsandMarkets and not available with any competitors.
Table of Contents
1 Introduction (Page No. - 19)
1.1 Objectives of the Study
1.2 Market Definition
1.3 Market Scope
1.3.1 Markets Covered
1.3.2 Years Considered for the Study
1.4 Currency
1.5 Limitations
1.6 Package Size
1.7 Stakeholders
2 Research Methodology (Page No. - 23)
2.1 Research Data
2.2 Secondary Data
2.2.1 Key Secondary Sources for Vehicle Production
2.2.2 Key Secondary Sources for Market Sizing
2.2.3 Key Data From Secondary Sources
2.3 Primary Data
2.3.1 Sampling Techniques & Data Collection Methods
2.3.2 Primary Participants
2.4 Market Size Estimation
2.4.1 Bottom-Up Approach: Catalytic Converter Oe Market
2.4.2 Bottom-Up Approach: Catalytic Converter Material Market
2.4.3 Bottom-Up Approach: Catalytic Converter Aftermarket
2.5 Market Breakdown and Data Triangulation
2.6 Assumptions
2.6.1 Global Assumptions
3 Executive Summary (Page No. - 33)
4 Premium Insights (Page No. - 36)
4.1 Attractive Opportunities in Catalytic Converter Market
4.2 Market in Asia Oceania, By Type and Country
4.3 Market, By Country
4.4 Market, By Type
4.5 Market, By Vehicle Type
4.6 Market, By Off-Highway Vehicle
4.7 Market, By Region
4.8 Market, By Material
5 Market Overview (Page No. - 44)
5.1 Introduction
5.2 Market Dynamics
5.2.1 Drivers
5.2.1.1 Stringent Emission and Fuel Efficiency Regulations Around the Globe to Fuel the Demand for Catalytic Converters
5.2.1.1.1 Region-Wise Emission and Fuel Efficiency Targets
5.2.1.1.2 Tier 4/Stage 4 Emission Regulations for Off-Highway Engines
5.2.1.1.3 Role of Catalytic Converters in Emission Control
5.2.1.2 Increasing Aftermarket for Catalytic Converters
5.2.1.2.1 Increasing Average Age and Miles Driven of Vehicles
5.2.1.2.2 Catalytic Converter Theft
5.2.1.3 Increasing Demand for SCR in Heavy Diesel Engines
5.2.2 Restraints
5.2.2.1 Increasing Sales of Battery Electric Vehicles
5.2.3 Opportunities
5.2.3.1 Nanoparticles for Catalytic Reduction
5.2.3.2 Introduction of Real Drive Emission (RDE) Tests
5.2.3.3 Recycling of Automotive Catalysts
5.2.4 Challenges
5.2.4.1 Fluctuating Price of Precious Group Metals
5.2.4.2 Controlling Adulteration in Def
5.3 Revenue Missed:Opportunities for Catalytic Converter Manufacturers
5.4 Catalytic Converter Market- Scenarios
5.3.1 Pessimistic
5.3.2 Most Likely
5.3.2 Optimistic
5.3 Recommendation
6 Industry Trends (Page No. - 58)
6.1 Technology Overview
6.1.1 Research Methodology
6.1.2 Assumptions
6.1.3 Industry Insights
6.1.4 Major Components and Their Functions in an Automotive Catalytic Converter
6.1.4.1 Exhaust Manifold
6.1.4.2 Catalytic Converter
6.1.4.2.1 Substrate
6.1.4.2.2 Wash-Coat
6.1.4.2.3 Catalyst
6.1.4.3 Muffler
6.1.4.4 Tail-Pipe
6.1.2 Advanced Catalytic Converter Types
6.1.2.1 Three-Way Catalytic Converter
6.1.2.2 Four-Way Catalytic Converter
6.1.2.3 Selective Catalytic Reduction
6.1.2.4 Diesel Oxidation Catalyst
6.1.2.5 Lean Nox Trap
6.1.2.6 Catalytic Converter Product Life Cycle
6.1.3 Automotive Catalyst Materials
6.1.3.1 Platinum
6.1.3.2 Palladium
6.1.3.3 Rhodium
6.2 Emission and Fuel Economy Norms
6.2.1 Emission Regulations
6.2.2 Co2 and Fuel Economy Regulations
6.2.3 Fuel Sulphur Regulations
6.3 Revenue Impact Analysis
7 Catalytic Converter Market, By Type (Page No. - 73)
Note - the Chapter is Further Segmented at Regional Level and Considered Regions are Asia Oceania, Europe, North America and RoW
7.1 Introduction
7.1.1 Research Methodology
7.1.2 Assumptions and Definitions
7.1.3 Industry Insights
7.2 Three Way Catalytic Converter (TWCC)
7.2.1 TWCC Leads the Catalytic Converter Market Owing to Dominant Presence of Gasoline Vehicles
7.3 Four-Way Catalytic Converter (FWCC)
7.3.1 FWCC to Show Fastest Growth for Gasoline Vehicles Catalytic Converter
7.4 Diesel Oxidation Catalyst (DOC)
7.4.1 DOC is Estimated to have the Largest Market for Diesel Vehicles Owing to Its Stringent Usage in Europe and North America
7.5 Selective Catalytic Reduction (SCR)
7.5.1 SCR is Estimated to have Fastest Growth Owing to the Ongoing and Upcoming Stringent Emission Norms in Developing Countries
7.6 Lean Nox Trap (LNT)
7.6.1 LNT is Estimated to Show Stagnant Growth Owing to Decreasing Demand for Diesel Vehicles in Europe and North America
8 Catalytic Converter Market, By Vehicle Type (Page No. - 84)
Note - the Chapter is Further Segmented at Regional Level and Considered Regions are Asia Oceania, Europe, North America and RoW
8.1 Introduction
8.1.1 Research Methodology
8.1.2 Assumptions and Definitions
8.1.3 Industry Insights
8.2 Passenger Car
8.2.1 Passenger Car Leads the Catalytic Converter Market Owing to Its Large Usage Compared to Other Vehicles
8.3 Light Commercial Vehicle (LCV)
8.3.1 LCV has the Prominent Market Share as It has Found Increasing Usage in Us, China, and India
8.4 Truck
8.4.1 Truck is the Fastest Growing Segment for Catalytic Converters as It is Witnessing Increasing Usage of SCR Technology
8.5 Bus
8.5.1 Bus has the Lowest Market for Catalytic Converters as It has Lowest Vehicle Production Share Among Other Vehicles
9 Catalytic Converter Market, By Material (Page No. - 94)
Note - the Chapter is Further Segmented at Regional Level (Asia Oceania, Europe, North America and RoW) and Vehicle Type (Passenger Car, LCV, Truck, Bus)
9.1 Introduction
9.1.1 Research Methodology
9.1.2 Assumptions and Definitions
9.1.3 Industry Insights
9.2 Palladium
9.2.1 Palladium Leads the Market Owing to Its Growing Usage in Gasoline Vehicles
9.3 Platinum
9.3.1 Platinum has the Second Largest Market as It has the Capability of Both Oxidation and Reduction
9.4 Rhodium
9.4.1 Rhodium is Seeing Increasing Usage Owing to Its Capability of Removing Nox Emissions
9.5 Others
9.5.1 Other Materials Market is Estimated to Show Fastest Growth Owing to Investments in Less Costly Precious Materials
10 Catalytic Converter Market, By Off-Highway Vehicle (Page No. - 106)
Note - the Chapter is Further Segmented at Regional Level and Considered Regions are Asia Oceania, Europe, North America and RoW
10.1 Introduction
10.1.1 Research Methodology
10.1.2 Assumptions and Definitions
10.1.3 Industry Insights
10.2 Agriculture Tractors
10.2.1 Agriculture Tractors Lead the Market for Off-Highway Vehicles
10.3 Construction Equipment
10.3.1 Construction Equipment has the Second Largest Share in the Market Owing to Increasing Industrialization
10.4 Mining Equipment
10.4.1 Mining Equipment Also has Prominent Market Share
12 Catalytic Converter Market, By Region (Page No. - 121)
Note - the Chapter is Further Segmented at Regional and Country Level By Catalytic Converter Type and Considered Catalytic Converter Type are Diesel Oxidation Catalyst, Four-Way Catalytic Converter, Three-Way Catalytic Converter, Selective Catalytic Reduction, and Lean Nox Trap
12.1 Introduction
12.1.1 Research Methodology
12.1.2 Assumptions
12.1.3 Industry Insights
12.2 Asia Oceania
12.2.1 China
12.2.1.1 TWCC is the Prominent Catalytic Converter Market in China
13.2.1.2 China Vehicle Production , By Vehicle Type
12.2.2 India
12.2.2.1 India is Estimated to Be the Fastest Market in Asia Oceania
13.2.2.2 India Vehicle Production , By Vehicle Type
12.2.3 Japan
12.2.3.1 Japan is the Second Largest Market for Catalytic Converters in Asia Oceania
13.2.3.2 Japan Vehicle Production , By Vehicle Type
12.2.4 South Korea
12.2.4.1 SCR is Estimated to Be the Largest Market in South Korea as of 2018
13.2.4.2 South Korea Vehicle Production , By Vehicle Type
12.2.5 Thailand
12.2.5.1 DOC is Estimated to Be the Largest Market During the Forecast Period
13.2.5.2 Thailand Vehicle Production , By Vehicle Type
12.2.6 Rest of Asia Oceania
12.2.6.1 SCR is Estimated to Be the Largest Market By 2025
13.2.6.2 Rest of Asia Oceania Vehicle Production , By Vehicle Type
12.3 Europe
12.3.1 Germany
12.3.1.1 Germany is Estimated to Be the Largest Market for Catalytic Converters in the Region
13.3.1.2 Germany Vehicle Production , By Vehicle Type
12.3.2 France
12.3.2.1 SCR is Estimated to Be the Largest Market By 2025
13.3.2.2 France Vehicle Production , By Vehicle Type
12.3.3 Russia
12.3.3.1 TWCC is Estimated to Be the Largest Market By Volume in 2018
13.3.6.2 Russia Vehicle Production , By Vehicle Type
12.3.4 Spain
12.3.4.1 DOC is Estimated to Be the Largest Market By Volume
13.3.3.2 Spain Vehicle Production , By Vehicle Type
12.3.5 UK
12.3.5.1 SCR is Estimated to Be the Largest Market in the UK as of 2018
13.3.5.2 UK Vehicle Production , By Vehicle Type
12.3.6 Turkey
12.3.6.1 SCR is Estimated to Be the Largest Market During the Forecast Period
13.3.4.2 Turkey Vehicle Production , By Vehicle Type
12.3.7 Rest of Europe
12.3.7.1 SCR is Projected to Be the Fastest Market
13.3.7.2 Rest of Europe Vehicle Production , By Vehicle Type
12.4 North America
12.4.1 Canada
12.4.1.1 SCR is Estimated to Be the Largest Market By 2025
12.4.1.2 Canada Vehicle Production , By Vehicle Type
12.4.2 Mexico
12.4.2.1 Mexico is Estimated to Be the Fastest Growing Market in North America
12.4.2.2 Mexico Vehicle Production , By Vehicle Type
12.4.3 US
12.4.3.1 Catalytic Converters Such as DOC have Almost 100% Adoption Rate for Diesel Vehicles in the US
12.4.3.2 US Vehicle Production , By Vehicle Type
12.5 Rest of the World (RoW)
12.5.1 Brazil
12.5.1.1 TWCC is Estimated to Be the Largest Market By Volume as of 2018
12.5.1.2 Brazil Vehicle Production , By Vehicle Type
12.5.2 Iran
12.5.2.1 Iran is the Fastest Growing Market in RoW
12.5.2.2 Iran Vehicle Production , By Vehicle Type
12.5.3 Rest of RoW
12.5.3.1 SCR is Estimated to Be the Largest Market By 2025
12.5.3.2 Rest of RoW Vehicle Production , By Vehicle Type
13 Competitive Landscape (Page No. - 156)
13.1 Overview
13.2 Competitive Leadership Mapping
13.2.1 Visionary Leaders
13.2.2 Innovators
13.2.3 Dynamic Differentiators
13.2.4 Emerging Companies
13.3 Competitive Leadership Mapping: Catalytic Converter Manufacturers
13.3.1 Competitive Benchmarking
13.3.1.1 Company-Wise Business Strategy Analysis
13.3.1.2 Company-Wise Product Offering Analysis
13.3.2 Catalytic Converter Material Manufacturers
13.3.3 Competitive Benchmarking
13.3.3.1 Company-Wise Business Strategy Analysis
13.3.3.2 Company-Wise Product Offering Analysis
13.4 Catalytic Converter Market: Market Share Analysis
13.5 Competitive Scenario
13.5.1 Expansions
13.5.2 New Product Launches/New Product Developments
13.5.3 Supply Contracts
13.5.4 Mergers & Acquisitions
13.5.5 Partnerships/Joint Ventures
14 Company Profiles (Page No. - 171)
(Business Overview, Products Offered, Recent Developments, SWOT Analysis, MnM View)*
14.1 Faurecia
14.1.1 Business Overview
14.1.2 Product Portfolio
14.1.3 Recent Developments
14.1.4 SWOT Analysis
14.2 Tenneco
14.2.1 Business Overview
14.2.2 Product Portfolio
14.2.3 Recent Developments
14.2.4 SWOT Analysis
14.3 Johnson Matthey
14.3.1 Business Overview
14.3.2 Product Portfolio
14.3.3 Recent Developments
14.3.4 SWOT Analysis
14.4 Eberspächer
14.4.1 Business Overview
14.4.2 Product Portfolio
14.4.3 Recent Developments
14.4.4 SWOT Analysis
14.5 Umicore
14.5.1 Business Overview
14.5.2 Product Portfolio
14.5.3 Recent Developments
14.5.4 SWOT Analysis
14.6 Benteler
14.6.1 Business Overview
14.6.2 Product Portfolio
14.6.3 Recent Developments
14.7 Futaba
14.7.1 Business Overview
14.7.2 Product Portfolio
14.7.3 Recent Developments
14.8 BSF
14.8.1 Business Overview
14.8.2 Product Portfolio
14.8.3 Recent Developments
14.9 Continental
14.9.1 Business Overview
14.9.2 Product Portfolio
14.9.3 Recent Developments
14.10 CDTI Materials
14.10.1 Business Overview
14.10.2 Product Portfolio
14.10.3 Recent Developments
14.11 Additional CPS
14.11.1 North America
14.11.1.1 Nett Technologies
14.11.1.2 Katcon
14.11.1.3 Cummins
14.11.1.4 Cri Catalyst
14.11.2 Europe
14.11.2.1 Bosal
14.11.2.2 Boysen
14.11.2.3 Magneti Marelli
14.11.2.4 Heraeus
14.11.3 Asia Oceania
14.11.3.1 Sango
14.11.3.2 Calsonic Kansei
14.11.3.3 Ibiden
14.11.3.4 Yutaka Giken
*Details on Business Overview, Products Offered, Recent Developments, SWOT Analysis, MnM View Might Not Be Captured in Case of Unlisted Companies
15 Appendix (Page No. - 200)
15.1 Insights of Industry Experts
15.2 Discussion Guide
15.3 Knowledge Store: Marketsandmarkets’ Subscription Portal
15.4 Available Customization
15.4.1 Catalytic Converter Market, By Vehicle Type, By Country
15.4.1.1 Passenger Cars
15.4.1.2 LCV
15.4.1.3 Trucks
15.4.1.4 Buses
15.4.2 Market, By Fuel Type, By Country
15.4.2.1 Gasoline
15.4.2.2 Diesel
15.4.3 Market, By Fuel Type, By Technology
15.4.3.1 Gasoline
15.4.3.2 Diesel
15.5 Related Reports
15.6 Author Details
List of Tables (156 Tables)
Table 1 Market Definitions
Table 2 Currency Exchange Rates (W.R.T. USD)
Table 3 Overview of Emission Regulation Specifications for Passenger Cars
Table 4 Emission Norms Specifications in Key Countries for Passenger Cars
Table 5 The US Tier 4 Off-Highway Final Regulations
Table 6 EU Stage 4 Off-Highway Regulations
Table 7 Catalytic Converter Average Life, By Type
Table 8 Catalytic Converter Average Life, By Vehicle Type
Table 9 Government Incentives for Electric Vehicles, By Country
Table 10 Urea Specification for Automotive Def
Table 11 De-Ionized Water Specification for Automotive Def
Table 12 Catalytic Converter Market, By Type, 2018 vs 2025 (Million Units)
Table 13 Market, By Type, 2018 vs 2025 (USD Billion)
Table 14 TWCC: Market, By Region, 2016–2025 (Million Units)
Table 15 TWCC: Market, By Region, 2016–2025 (USD Billion)
Table 16 FWCC: Market, By Region, 2016–2025 (Million Units)
Table 17 FWCC: Market, By Region, 2016–2025 (USD Billion)
Table 18 DOC: Market, By Region, 2016–2025 (Million Units)
Table 19 DOC: Market, By Region, 2016–2025 (USD Billion)
Table 20 SCR: Market, By Region, 2016–2025 (Million Units)
Table 21 SCR: Market, By Region, 2016–2025 (USD Billion)
Table 22 LNT: Market, By Region, 2016–2025 (Million Units)
Table 23 LNT: Market, By Region, 2016–2025 (USD Billion)
Table 24 Estimated Pgm Usage for Catalytic Converter Type in Us
Table 25 Catalytic Converter Market, By Vehicle Type, 2018 vs 2025 (‘000 Units)
Table 26 Market, By Vehicle Type, 2018 vs 2025 (USD Million)
Table 27 Passenger Car: Market, By Region, 2016–2025 (‘000 Units)
Table 28 Passenger Car: Market, By Region, 2016–2025 (USD Million)
Table 29 LCV: Market, By Region, 2016–2025 (‘000 Units)
Table 30 LCV: Market, By Region, 2016–2025 (USD Million)
Table 31 Truck: Market, By Region, 2016–2025 (‘000 Units)
Table 32 Truck: Market, By Region, 2016–2025 (USD Million)
Table 33 Bus: Market, By Region, 2016–2025 (‘000 Units)
Table 34 Bus: Market, By Region, 2016–2025 (USD Million)
Table 35 Gasoline Light Duty Vehicles Pgm Usage in Us
Table 36 Gasoline Light Duty Vehicles Pgm Usage in Us
Table 37 Catalytic Converter Market, By Material, 2018 vs 2025 (Tons)
Table 38 Market, By Material, 2018 vs 2025 (USD Million)
Table 39 Palladium: Market, By Region, 2016–2025 (Tons)
Table 40 Palladium: Market, By Region, 2016–2025 (USD Million)
Table 41 Palladium: Market, By Vehicle Type, 2016–2025 (Tons)
Table 42 Palladium: Market, By Vehicle Type, 2016–2025 (USD Million)
Table 43 Platinum: Market, By Region, 2016–2025 (Tons)
Table 44 Platinum: Market, By Region, 2016–2025 (USD Million)
Table 45 Platinum: Market, By Vehicle Type, 2016–2025 (Tons)
Table 46 Platinum: Market, By Vehicle Type, 2016–2025 (USD Million)
Table 47 Rhodium: Market, By Region, 2016–2025 (Tons)
Table 48 Rhodium: Market, By Region, 2016–2025 (USD Million)
Table 49 Rhodium: Market, By Vehicle Type, 2016–2025 (Tons)
Table 50 Rhodium: Market, By Vehicle Type, 2016–2025 (USD Million)
Table 51 Others: Market, By Region, 2016–2025 (Tons)
Table 52 Others: Market, By Region, 2016–2025 (USD Million)
Table 53 Others: Market, By Vehicle Type, 2016–2025 (Tons)
Table 54 Others: Market, By Vehicle Type, 2016–2025 (USD Million)
Table 55 Market, By Off-Highway Vehicle, 2018 vs 2025 (‘000 Units)
Table 56 Market, By Off-Highway Vehicle, 2018 vs 2025 (USD Million)
Table 57 Agriculture Tractors: Market, By Region, 2016–2025 (‘000 Units)
Table 58 Agriculture Tractors: Market, By Region, 2016–2025 (USD Million)
Table 59 Construction Equipment: Market, By Region, 2016–2025 (‘000 Units)
Table 60 Construction Equipment: Market, By Region, 2016–2025 (USD Million)
Table 61 Mining Equipment: Market, By Region, 2016–2025 (‘000 Units)
Table 62 Mining Equipment: Market, By Region, 2016–2025 (USD Million)
Table 63 Catalytic Converter Aftermarket, By Vehicle Type, 2018 vs 2025 (Million Units)
Table 64 Catalytic Converter Aftermarket, By Vehicle Type, 2018 vs 2025 (USD Million)
Table 65 Passenger Car: Catalytic Converter Aftermarket, By Region, 2016–2025 (Million Units)
Table 66 Passenger Car: Catalytic Converter Aftermarket, By Region, 2016–2025 (USD Million)
Table 67 LCV: Catalytic Converter Aftermarket, By Region, 2016–2025 (Million Units)
Table 68 LCV: Catalytic Converter Aftermarket, By Region, 2016–2025 (USD Million)
Table 69 HCV: Catalytic Converter Aftermarket, By Region, 2016–2025 (Million Units)
Table 70 HCV: Catalytic Converter Aftermarket, By Region, 2016–2025 (USD Million)
Table 71 Catalytic Converter Market, By Region, 2016–2025 (‘000 Units)
Table 72 Market, By Region, 2016–2025 (USD Million)
Table 73 Asia Oceania Vehicle Production, By Vehicle Type, 2012-2016 (Units)
Table 74 Asia Oceania: Market, By Country, 2016–2025 (‘000 Units)
Table 75 Asia Oceania: Market, By Country, 2016–2025 (USD Million)
Table 76 China Vehicle Production, By Vehicle Type, 2012-2016 (Units)
Table 77 China: Market, By Type, 2016–2025 (‘000 Units)
Table 78 China: Market, By Type, 2016–2025 (USD Million)
Table 79 India Vehicle Production, By Vehicle Type, 2012-2016 Units)
Table 80 India: Market, By Type, 2016–2025 (‘000 Units)
Table 81 India: Market, By Type, 2016–2025 (USD Million)
Table 82 Japan Vehicle Production, By Vehicle Type, 2012-2016 Units)
Table 83 Japan: Market, By Type, 2016–2025 (‘000 Units)
Table 84 Japan: Market, By Type, 2016–2025 (USD Million)
Table 85 South Korea Vehicle Production, By Vehicle Type, 2012-2016 Units)
Table 86 South Korea: Market, By Type, 2016–2025 (‘000 Units)
Table 87 South Korea: Market, By Type, 2016–2025 (USD Million)
Table 88 Thailand Vehicle Production, By Vehicle Type, 2012-2016 Units)
Table 89 Thailand: Market, By Type, 2016–2025 (‘000 Units)
Table 90 Thailand: Market, By Type, 2016–2025 (USD Million)
Table 91 Rest of Asia Vehicle Production, By Vehicle Type, 2012-2016 Units)
Table 92 Rest of Asia Oceania: Market, By Type, 2016–2025 (‘000 Units)
Table 93 Rest of Asia Oceania: Market, By Type, 2016–2025 (USD Million)
Table 94 Europe Vehicle Production, By Vehicle Type, 2012-2016 (Units)
Table 95 Europe: Market, By Country, 2016–2025 (‘000 Units)
Table 96 Europe: Market, By Country, 2016–2025 (USD Million)
Table 97 Germany Vehicle Production, By Vehicle Type, 2012-2016 (Units)
Table 98 Germany: Market, By Type, 2016–2025 (‘000 Units)
Table 99 Germany: Market, By Type, 2016–2025 (USD Million)
Table 100 France Vehicle Production, By Vehicle Type, 2012-2016 (Units)
Table 101 France: Market, By Type, 2016–2025 (‘000 Units)
Table 102 France: Market, By Type, 2016–2025 (USD Million)
Table 103 Russia Vehicle Production, By Vehicle Type, 2012-2016 (Units)
Table 104 Russia: Market, By Type, 2016–2025 (‘000 Units)
Table 105 Russia: Market, By Type, 2016–2025 (USD Million)
Table 106 Spain Vehicle Production, By Vehicle Type, 2012-2016 (Units)
Table 107 Spain: Market, By Type, 2016–2025 (‘000 Units)
Table 108 Spain: Market, By Type, 2016–2025 (USD Million)
Table 109 UK Vehicle Production, By Vehicle Type, 2012-2016 (Units)
Table 110 UK: Market, By Type, 2016–2025 (‘000 Units)
Table 111 UK: Market, By Type, 2016–2025 (USD Million)
Table 112 Turkey Vehicle Production, By Vehicle Type, 2012-2016 (Units)
Table 113 Turkey: Market, By Type, 2016–2025 (‘000 Units)
Table 114 Turkey: Market, By Type, 2016–2025 (USD Million)
Table 115 Rest of Europe Vehicle Production, By Vehicle Type, 2012-2016 (Units)
Table 116 Rest of Europe: Market, By Type, 2016–2025 (‘000 Units)
Table 117 Rest of Europe: Market, By Type, 2016–2025 (USD Million)
Table 118 North America Vehicle Production, By Vehicle Type, 2012-2016 (Units)
Table 119 North America: Market, By Country, 2016–2025 (‘000 Units)
Table 120 North America: Market, By Country, 2016–2025 (USD Million)
Table 121 Canada Vehicle Production, By Vehicle Type, 2012-2016 (Units)
Table 122 Canada: Market, By Type, 2016–2025 (‘000 Units)
Table 123 Canada: Market, By Type, 2016–2025 (USD Million)
Table 124 Mexico Vehicle Production, By Vehicle Type, 2012-2016 (Units)
Table 125 Mexico: Market, By Type, 2016–2025 (‘000 Units)
Table 126 Mexico: Market, By Type, 2016–2025 (USD Million)
Table 127 US Vehicle Production, By Vehicle Type, 2012-2016 (Units)
Table 128 US: Market, By Type, 2016–2025 (‘000 Units)
Table 129 US: Market, By Type, 2016–2025 (USD Million)
Table 130 RoW Vehicle Production, By Vehicle Type, 2012-2016 (Units)
Table 131 RoW: Market, By Country, 2016–2025 (‘000 Units)
Table 132 RoW: Market, By Country, 2016–2025 (USD Million)
Table 133 Brazil Vehicle Production, By Vehicle Type, 2012-2016 (Units)
Table 134 Brazil: Market, By Type, 2016–2025 (‘000 Units)
Table 135 Brazil: Market, By Type, 2016–2025 (USD Million)
Table 136 Iran Vehicle Production, By Vehicle Type, 2012-2016 (Units)
Table 137 Iran: Market, By Type, 2016–2025 (‘000 Units)
Table 138 Iran: Market, By Type, 2016–2025 (USD Million)
Table 139 Rest of RoW Vehicle Production, By Vehicle Type, 2012-2016 (Units)
Table 140 Rest of RoW: Market, By Type, 2016–2025 (‘000 Units)
Table 141 Rest of RoW: Market, By Type, 2016–2025 (USD Million)
Table 142 Expansions
Table 143 New Product Launches/New Product Developments, 2014–2018
Table 144 Supply Contracts
Table 145 Mergers & Acquisitions
Table 146 Partnerships/Joint Ventures
Table 147 Faurecia: Recent Developments
Table 148 Tenneco: Recent Developments
Table 149 Johnson Matthey: Recent Developments
Table 150 Eberspacher: Recent Developments
Table 151 Umicore: Recent Developments
Table 152 Benteler: Recent Developments
Table 153 Futaba: Recent Developments
Table 154 BSF : Recent Developments
Table 155 Continental: Recent Developments
Table 156 CDTI Materials: Recent Developments
List of Figures (64 Figures)
Figure 1 Catalytic Converter Market Segmentation
Figure 2 Market: Research Design
Figure 3 Research Design Model
Figure 4 Breakdown of Primary Interviews
Figure 5 Data Triangulation
Figure 6 Market: Market Outlook
Figure 7 Market, By Region, 2018 vs 2022 vs 2025 (USD Million)
Figure 8 Attractive Market Opportunities in Market
Figure 9 Selective Catalytic Reduction and Three-Way Catalytic Converter Accounted for the Largest Share in the Asia Oceania Market, 2018, (USD Billion)
Figure 10 India, Mexico, and Brazil are Expected to Grow at the Fastest Rate During the Forecast Period
Figure 11 Selective Catalytic Reduction is Expected to Lead the Market, By Type, 2018 Vs.2025 (USD Billion)
Figure 12 Passenger Car is Expected to Lead the Market, By Vehicle Type, 2018 Vs.2025 (USD Billion)
Figure 13 Agricultual Tractors Expected to Lead the Market, By Off-Highway Vehicle, 2018 Vs.2025 (USD Billion)
Figure 14 North America is Expected to Hold the Largest Market for Catalytic Converters Over the Forecast Period
Figure 15 Palladium is Expected to have Largest Market, By Material Type, 2018 Vs.2025 (USD Billion)
Figure 16 Catalytic Converter Market: Market Dynamics
Figure 17 On-Road Light and Heavy-Duty Vehicle Emission Regulation Outlook, 2014–2025
Figure 18 Non-Road Vehicle Emission Regulation Outlook, 2014–2025
Figure 19 BEV Sales, 2016–2025 (‘000 Units)
Figure 20 Platinum & Palladium Price, 2005–2018 (USD)
Figure 21 Working of an Automotive Catalytic Converter
Figure 22 Vehicle Exhaust Manifold
Figure 23 Catalytic Converter Working Model
Figure 24 Working of A Three-Way Catalytic Converter
Figure 25 Working of A Four-Way Catalytic Converter
Figure 26 Working of an Automotive SCR System
Figure 27 Working of A Diesel Oxidation Catalyst
Figure 28 Working of A Lean Nox Trap
Figure 29 Overview of Emission Regulation for Passenger Cars
Figure 30 Overview of Emission Regulation for Light Commercial Vehicles
Figure 31 Overview of Emission Regulation for Heavy Commercial Vehicles
Figure 32 US: Near Future & Upcoming Co2 Regulations for Light Duty Vehicles
Figure 33 Average New Car Co2 Emission Level
Figure 34 Overview of Diesel Fuel Sulphur Limits
Figure 35 Overview of Gasoline Fuel Sulphur Limits
Figure 36 Catalytic Converter Market, By Type, 2018 vs 2025 (USD Billion)
Figure 37 Market, By Vehicle Type, 2018 vs 2025 (USD Million)
Figure 38 Market, By Material, 2018 vs 2025 (USD Billion)
Figure 39 Market, By Off-Highway Vehicle, 2018 vs 2025 (USD Million)
Figure 40 Catalytic Converter Aftermarket, By Vehicle Type, 2018 vs 2025 (USD Million)
Figure 41 Market, By Country, 2018 (USD Billion)
Figure 42 Market, By Region, 2018 vs 2025 (USD Billion)
Figure 43 Market: Regional Market Share & Growth Rate, 2018 (Value)
Figure 44 Asia Oceania: Market Snapshot
Figure 45 Europe: Market Snapshot
Figure 46 North America: Market, By Country, 2018 vs 2025 (USD Million)
Figure 47 RoW: Market Size, By Country, 2018 vs 2025 (USD Million)
Figure 48 Companies Adopted Expansion & New Product Development as the Key Growth Strategy From 2014 to 2018
Figure 49 Catalytic Converter Material Suppliers Market Share Analysis in 2017
Figure 50 Faurecia: Company Snapshot
Figure 51 SWOT Analysis: Faurecia
Figure 52 Tenneco: Company Snapshot
Figure 53 SWOT Analysis: Tenneco
Figure 54 Johnson Matthey: Company Snapshot
Figure 55 SWOT Analysis: Johnson Matthey
Figure 56 Eberspächer: Company Snapshot
Figure 57 SWOT Analysis: Eberspächer
Figure 58 Umicore: Company Snapshot
Figure 59 SWOT Analysis: Umicore
Figure 60 Benteler: Company Snapshot
Figure 61 Futaba: Company Snapshot
Figure 62 BASF: Company Snapshot
Figure 63 Continental: Company Snapshot
Figure 64 CDTI Materials: Company Snapshot
The study involves 4 main activities to estimate the current size of the catalytic converter market. Exhaustive secondary research was done to collect information on the market, such as catalytic converter type and usage of different materials in catalytic converters. The next step was to validate these findings, assumptions, and market analysis with industry experts across value chains through primary research. Bottom-up approaches were employed to estimate the complete market size for different segments considered under this study.
Secondary Research
The secondary sources referred for this research study include automotive industry organizations such as the Organisation Internationale des Constructeurs d'Automobiles (OICA); corporate filings (such as annual reports, investor presentations, and financial statements); and trade, business, and automotive associations. Secondary data has been collected and analyzed to arrive at the overall market size, which is further validated by multiple industry experts.
Primary Research
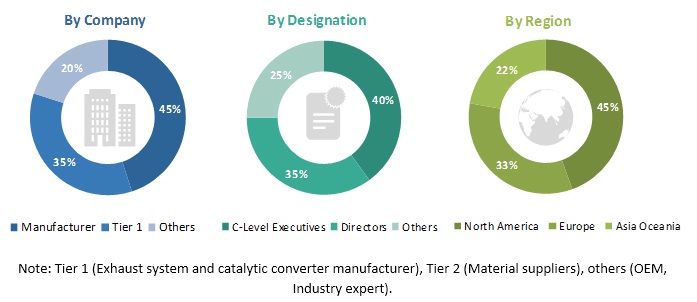
Extensive primary research has been conducted after acquiring an understanding of the market scenario through secondary research. Several primary interviews have been conducted with market experts from both the demand- (OEMs) and supply-side (exhaust system and catalytic converter manufacturers) across major regions, namely, North America, Europe, Asia Oceania, and Rest of the World. Primary data has been collected through questionnaires, emails, and telephonic interviews. In the canvassing of primaries, we have strived to cover various departments within organizations, such as sales, operations, and administration, to provide a holistic viewpoint in our report.
After interacting with industry experts, we have also conducted brief sessions with highly experienced independent consultants to reinforce the findings from our primaries. This, along with the in-house subject matter experts’ opinions, has led us to the findings as described in the remainder of this report.
To know about the assumptions considered for the study, download the pdf brochure
Market Size Estimation
The bottom-up approach has been used to estimate and validate the size of the market. The market size, by type, in terms of volume, is derived by multiplying the country-level fuel breakup of each vehicle type with country-level production of each vehicle type (passenger car, LCV, truck, and bus) and country-level catalytic converter type penetration rate (which is estimated using secondary research and then validated by primary interviews) for each vehicle type. The country-level market size, by volume, is multiplied with country-level average OE price (AOP) of each type of catalytic converter for each vehicle type to get the country-level market, by value. The summation of the country-level market would give the regional level, and then further addition provides the global market, by type [three-way catalytic converter (TWCC), four-way catalytic converter (FWCC), selective catalytic reduction (SCR), diesel oxidation catalyst (DOC), and lean NOx trap (LNT)].
The total value of each country is then summed up to derive the total value of the market, by type. Similar methodology has been followed for market of off-highway vehicle (construction equipment, mining equipment, and agriculture tractors) based on type. For deriving the market for catalytic converters, by material, the total volume of the market is multiplied with the average weight of each type of catalytic converter. This will give the market, in terms of weight, for each type which is further multiplied with the percentage usage of each material (platinum, palladium, rhodium, and others) used to make catalytic converters. This will give the total market for each material, in terms of weight. The market size, by weight, is multiplied with the average selling price of each type of material to get the regional-level market, by value. The summation of the regional-level market would give the global market, by material.
The catalytic converter aftermarket, by vehicle type-passenger car, LCV, and HCV, in terms of volume- has been derived by multiplying the regional-level parc of each vehicle type with regional-level average miles driven for each vehicle type. The total derived miles driven at the regional level of each vehicle type is then divided by regional-level average life of each catalytic converter for each vehicle type to analyze the catalytic converter aftermarket, by vehicle type, in terms of volume. The regional aftermarket size, by volume, is multiplied with a regional-level average selling price of each catalytic converter for each vehicle type, which gives the global catalytic converter aftermarket, by vehicle type, in terms of value.
Data Triangulation
All percentage shares, splits, and breakdowns have been determined using secondary sources and verified by primary sources. All parameters that are said to affect the markets covered in this research study have been accounted for, viewed in extensive detail, and analyzed to obtain the final quantitative and qualitative data. This data has been consolidated, enhanced with detailed inputs and analysis from MarketsandMarkets, and presented in the report. The data was triangulated by studying various factors and trends from both, the demand and supply sides, in the market.
Report Objectives
- To define, describe, and forecast the global market based on type, material, aftermarket, off-highway vehicle, vehicle type, and region
- To forecast the market, by volume and value, on the basis of type [three-way catalytic converter (TWCC), four-way catalytic converter (FWCC), diesel oxidation catalyst (DOC), selective catalytic reduction (SCR), and lean NOx trap (LNT)]
- To forecast the market, by volume and value, on the basis material (platinum, palladium, rhodium, and others)
- To forecast the market, in terms of volume and value, based on vehicle type (passenger car, LCV, bus, and truck)
- To forecast the market, in terms of volume and value, based on aftermarket (passenger car, LCV, and HCV)
- To forecast the market, in terms of volume and value, based on off-highway vehicle (construction equipment, mining equipment, and agriculture tractors)
- To forecast the market, in terms of volume and value, based on 4 key regions—Asia Oceania (China, India, Japan, South Korea, Thailand, and Rest of Oceania), Europe (France, Germany, Italy, Russia, Spain, Turkey, the UK, and Rest of Europe), North America (Canada, Mexico, and the US), and RoW (Iran, Brazil, and Rest of RoW)
- To provide detailed information about major factors influencing the growth of the market (drivers, restraints, opportunities, and industry-specific challenges)
- To provide detailed information about industry trends in the market, which would include emission regulations, technology overview, and revenue impact
- To analyze the opportunities in the market for stakeholders and provide details of the competitive leadership mapping for market players
- To strategically profile key players and comprehensively analyze their market shares and core competencies
- To track and analyze competitive developments such as joint ventures, mergers & acquisitions, new product developments, and R&D in the market
Available Customizations
With the given market data, MarketsandMarkets offers customizations according to the company’s specific needs.
The following customization options are available for the report:
By vehicle type, by country
- Passenger car
- LCV
- Truck
- Bus
By fuel type, by country
- Gasoline
- Diesel
By fuel type, by technology
- Gasoline
- Diesel


Growth opportunities and latent adjacency in Catalytic Converter Market
What is the average price for a catalytic converter for light duty vehicles to an OEM manufacturer? Not what a consumer would pay for a replacement, but what a car company would pay to Tenneco or other manufacturer of converters pay?
Our company is a manufacturer of catalytic converter support mat . We want to know the global market. Thank you.
Looking for retailer opportunity in USA market for catalytic converters. Which are based in North America for last 10 -15 years.
I am writing a business brief about catalyst converters target market. I would like to compare a local manufacturer (BASF) with their main competitors.