Busbar Protection Market by Voltage (Medium Voltage, High Voltage, and Extra High Voltage), Impedance (Low Impedance and High Impedance), End-User (Utilities, Industries, and Transportation), and Region - Global Forecast to 2023


[137 Pages Report] The global busbar protection market was valued at USD 3.04 Billion in 2017; it is projected to reach USD 4.31 Billion by 2023, growing at a CAGR of 6.10%. Increasing investment to modernize the transmission & distribution infrastructure and increasing emphasis on renewable energy sources globally are the main drivers for the busbar protection market. Development of digital protection relay (modern relay) is also fueling the growth of the market.
This report segments the busbar protection market on the basis of voltage, impedance, end-user, and region. The years considered for the study are as follows:
- Base Year: 2017
- Estimated Year: 2018
- Projected Year: 2023
- Forecast Period: 2018�2023
The base year considered for company profiles is 2017. Whenever information was unavailable for the base year, the prior year has been considered.
Objectives of the Study
- To define, describe, and forecast the global busbar protection market on the basis of voltage, impedance, end-user, and region
- To provide a detailed information regarding the major factors influencing the growth of the market (drivers, restraints, opportunities, and industry-specific challenges)
- To strategically analyze the market with respect to individual growth trends, future prospects, and contribution of each segment to the market
- To analyze opportunities in the market for stakeholders and provide details of a competitive landscape for market leaders
- To forecast the market size of segments with respect to five major regions (along with countries), namely, North America, Europe, Asia Pacific, South America, the Middle East & Africa
- To strategically profile key players and comprehensively analyze their market shares and core competencies
- To analyze competitive developments such as contracts & agreements, mergers & acquisitions, new product developments, and expansions in the market
Research Methodology
This research study involved the use of extensive secondary sources, directories, and databases, such as Hoover�s, Bloomberg Businessweek, Factiva, and OneSource, to identify and collect information useful for a technical, market-oriented, and commercial study of the busbar protection market. Primary sources are mainly industry experts from the core and related industries, suppliers, manufacturers, service providers, technology developers, standards and certification organizations of companies, and organizations related to all the segments of this industry�s value chain. The points below explain the research methodology.
- Study of the annual revenues and market developments of the major players that provide busbar protection market solutions
- Assessment of future trends and growth of the busbar protection market based on voltage, impedance, and end-user.
- Assessment of the busbar protection market with respect to the technology used for different end-users and regions
- Study of contracts & developments related to the busbar protection market by key players across different regions
- Finalization of the overall market sizes by triangulating the supply-side data, which includes product launches, and annual revenues of companies supplying busbar protections across the world
After arriving at the overall market size, the total market has been split into several segments and subsegments. The figure given below illustrates the breakdown of primaries conducted during the research study, based on company type, designation, and region.
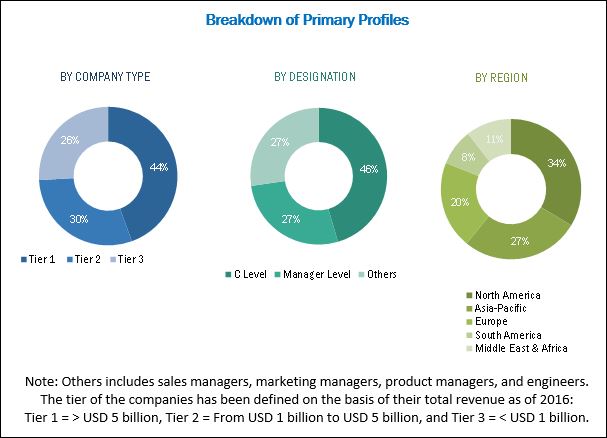
To know about the assumptions considered for the study, download the pdf brochure
The key players in the busbar protection market include ABB (Switzerland), Schneider Electric (France), GE (US), Siemens (Germany), Mitsubishi Electric (Japan), NR Electric (China), Toshiba (Japan), Eaton (Ireland), and ZIV (Spain).
Target Audience:
The report�s target audience includes:
- Distribution utilities
- Government and industry associations
- Power generation companies
- Protective relays manufacturing companies
- State and national regulatory authorities
- Substation EPC contractors
- Transmission utilities
Scope of the report:
By Voltage
- Medium Voltage
- High Voltage
- Extra High Voltage
By Impedance
- Low Impedance
- High Impedance
By End-User
- Utilities
- Industries (Oil & Gas, Metal & Mining, and Cement and Chemicals)
- Transportations (Railways and Metros)
By Region
- North America
- South America
- Europe
- Asia Pacific
- Middle East & Africa
Available Customizations:
With the given market data, MarketsandMarkets offers customizations as per the client�s specific needs. The following customization options are available for the report:
Regional Analysis
- Further breakdown of region/country-specific analysis
Company Information
- Detailed analysis and profiling of additional market players (up to 5)
The global busbar protection market is expected to grow at a CAGR of 6.10%, from 2018 to 2023, to reach a market size of USD 4.31 Billion by 2023 from USD 3.20 Billion in 2018. The increasing investment to modernize the transmission & distribution infrastructure is the main driver for the growth of the busbar protection market. The development of digital protection relay (modern relay) is also fuelling the growth of the busbar protection market. Delays in grid expansion projects due to government regulations and environmental clearances is the main restraint for the busbar protection market.
The report segments the busbar protection market, on the basis of voltage, into medium, high, and extra high voltage. The extra high-voltage segment accounted for the largest market share in 2017, driven by the demand from Asia Pacific, Europe, the Americas, and Africa. The increasing installation of offshore wind farms and solar farms is creating an opportunity for busbar protection systems in the extra high-voltage segment.
The global busbar protection market, by end-user, has been segmented into utilities, industries, and transportations, with the transportations segment growing at a faster pace. Growth in demand for reliable power supply led to increased investments in transmission and distribution infrastructure, which further results in growing demand for the busbar protection during the forecast period.
The global busbar protection market, by impedance, has been segmented into low and high, with the low-impedance segment growing at a faster pace. Modern microprocessor-based low-impedance busbar protection relays utilize sophisticated algorithms to detect faults in the bus bar schemes. The low-impedance busbar protection system can be configured as de-centralized busbar protection system and centralized busbar protection system. The increasing investment in the smart grid and smart substation is expected to create the demand for microprocessor-based low-impedance busbar protection systems.
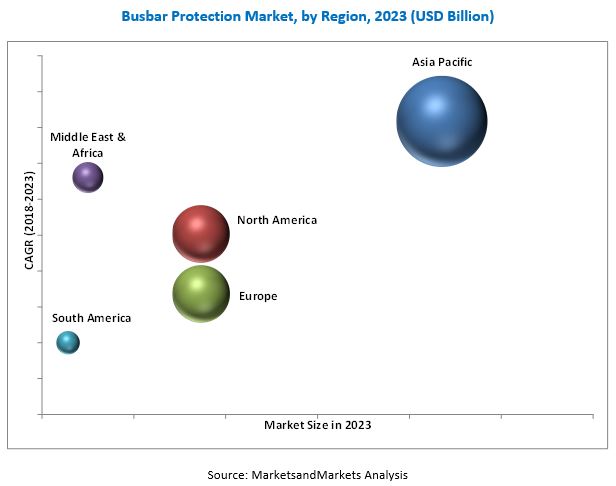
In this report, the busbar protection market has been analyzed with respect to five regions, namely, Europe, North America, Asia Pacific, South America and the Middle East & Africa. The Asia Pacific market led the busbar protection market, with the largest market share, by value, in 2017, and the trend is projected to continue till 2023. The Asia Pacific is the fastest growing market for busbar protection during the forecast period. The growth of the Asia Pacific busbar protection market can be attributed to the increasing investment in grid expansion projects from countries such as China, Japan, and India. Huge investments in renewable energy and replacement of aging transmission & distribution infrastructure are some of the major factors responsible for the growth of the busbar protection market.
The figure given below shows the projected market sizes of various regions with respective CAGRs for 2023.
The major factor restraining the growth of the busbar protection market is delays in grid expansion projects.
Some of the leading players in the busbar protection market, based on their recent developments and other strategic industrial activities, are ABB (Switzerland), Schneider Electric (France), GE (US), Siemens (Germany), Mitsubishi Electric (Japan), NR Electric (China), Toshiba (Japan), Eaton (Ireland), and ZIV (Spain).
These players have adopted growth strategies such as contracts & agreements, partnerships, collaborations, alliances, and joint ventures, mergers & acquisitions, and investments & expansions to capture a larger share of the busbar protection market.
To speak to our analyst for a discussion on the above findings, click Speak to Analyst
 Exclusive indicates content/data unique to MarketsandMarkets and not available with any competitors.
Table of Contents
1 Introduction (Page No. - 12)
1.1 Objectives
1.2 Market Definition
1.3 Market Scope
1.3.1 Market Covered
1.3.2 Regional Scope
1.3.3 Years Considered for the Study
1.3.4 Currency
1.4 Stakeholders
2 Research Methodology (Page No. - 16)
2.1 Research Data
2.1.1 Secondary Data
2.1.1.1 Key Data From Secondary Sources
2.1.2 Primary Data
2.1.2.1 Key Data From Primary Sources
2.1.2.2 Key Industry Insights
2.1.2.3 Breakdown of Primaries
2.2 Market Size Estimation
2.2.1 Bottom-Up Approach
2.2.2 Top-Down Approach
2.3 Market Breakdown and Data Triangulation
2.4 Research Assumption
2.4.1 Assumption of the Research Study
3 Executive Summary (Page No. - 25)
4 Premium Insights (Page No. - 30)
4.1 Attractive Opportunities in the Busbar Protection Market
4.2 Market, By End-User
4.3 Market, By Voltage
4.4 Market, By Impedance
5 Market Overview (Page No. - 34)
5.1 Introduction
5.2 Market Dynamics
5.2.1 Drivers
5.2.1.1 Increasing Investments in Transmission and Distribution Infrastructure
5.2.1.2 Operational Benefits of Busbar Protection Relays
5.2.2 Restraints
5.2.2.1 Delays in Grid Expansion Projects
5.2.3 Opportunities
5.2.3.1 Adoption of HVDC Technology
5.2.3.2 Increased Investments in Smart Grids and Energy Systems
5.2.4 Challenges
5.2.4.1 Cost Constraints for MV Substations
6 Market, By Voltage (Page No. - 39)
6.1 Introduction
6.2 Medium Voltage
6.3 High Voltage
6.4 Extra High Voltage
7 Market, By Impedance (Page No. - 44)
7.1 Introduction
7.2 High Impedance
7.3 Low Impedance
8 Market, By End-User (Page No. - 48)
8.1 Introduction
8.2 Utilities
8.3 Industries
8.4 Transportation
9 Market, By Region (Page No. - 52)
9.1 Introduction
9.2 North America
9.2.1 By Voltage
9.2.2 By Impedance
9.2.3 By End-User
9.2.4 By Country
9.2.4.1 US
9.2.4.2 Canada
9.2.4.3 Mexico
9.3 Asia Pacific
9.3.1 By Voltage
9.3.2 By Impedance
9.3.3 By End-User
9.3.4 By Country
9.3.4.1 China
9.3.4.2 India
9.3.4.3 Japan
9.3.4.4 Australia
9.3.4.5 South Korea
9.3.4.6 Indonesia
9.3.4.7 Rest of Asia Pacific
9.4 Europe
9.4.1 By Voltage
9.4.2 By Impedance
9.4.3 By End-User
9.4.4 By Country
9.4.4.1 Germany
9.4.4.2 UK
9.4.4.3 France
9.4.4.4 Italy
9.4.4.5 Norway
9.4.4.6 Russia
9.4.4.7 Rest of Europe
9.5 South America
9.5.1 By Voltage
9.5.2 By Impedance
9.5.3 By End-User
9.5.4 By Country
9.5.4.1 Brazil
9.5.4.2 Argentina
9.5.4.3 Rest of South America
9.6 Middle East & Africa
9.6.1 By Voltage
9.6.2 By Impedance
9.6.3 By End-User
9.6.4 By Country
9.6.4.1 Saudi Arabia
9.6.4.2 UAE
9.6.4.3 South Africa
9.6.4.4 Nigeria
9.6.4.5 Egypt
9.6.4.6 Rest of the Middle East & Africa
10 Competitve Landscape (Page No. - 86)
10.1 Introduction
10.2 Ranking of Players & Market Structure
10.3 Competitive Scenario
10.3.1 Contracts & Agreements
10.3.2 Investments and Expansions
10.3.3 Mergers & Acquisitions
10.3.4 Others
11 Company Profiles (Page No. - 92)
(Business Overview, Products Offered, Recent Developments, MnM View)*
11.1 Benchmarking
11.2 ABB
11.3 GE
11.4 Schneider Electric
11.5 Siemens
11.6 Mitsubishi Electric
11.7 Andritz
11.8 Basler Electric
11.9 Eaton
11.10 Erlphase Power Technologies
11.11 NR Electric
11.12 SEL
11.13 Toshiba
11.14 ZIV
*Details on Business Overview, Products Offered, Recent Developments, MnM View Might Not Be Captured in Case of Unlisted Companies.
12 Appendix (Page No. - 127)
12.1 Insights of Industry Experts
12.2 Discussion Guide
12.3 Knowledge Store: Marketsandmarkets� Subscription Portal
12.4 Introducing RT: Real-Time Market Intelligence
12.5 Available Customisation
12.6 Releated Report
12.7 Author Details
List of Tables (68 Tables)
Table 1 Busbar Protection Market Snapshot
Table 2 T&D Infrastructure Expansion Plans
Table 3 Key Smart Grid Investment Initiatives
Table 4 Busbar Protection Market Size, By Voltage, 2016�2023 (USD Million)
Table 5 Medium Voltage: Market Size, By Region, 2016�2023 (USD Million)
Table 6 High Voltage: Market Size, By Region, 2016�2023 (USD Million)
Table 7 Extra High Voltage: Market Size, By Region, 2016�2023 (USD Million)
Table 8 Busbar Protection Market Size, By Impedance, 2016�2023 (USD Million)
Table 9 High Impedance: Market Size, By Region, 2016�2023 (USD Million)
Table 10 Low Impedance: Market Size, By Region, 2016�2023 (USD Million)
Table 11 Busbar Protection Market Size, By End-User, 2016�2023 (USD Million)
Table 12 Utilities: Market Size, By Region, 2016�2023 (USD Million)
Table 13 Industries: Market Size, By Region, 2016�2023 (USD Million)
Table 14 Transportation: Market Size, By Region, 2016�2023 (USD Million)
Table 15 Busbar Protection Market Size, By Region, 2016�2023 (USD Million)
Table 16 Busbar Protection Market, Top Five Countries Largest Market, 2016�2023 (USD Million)
Table 17 Busbar Protection Market, Top Five Fastest Growing Markets, 2016�2023 (USD Million)
Table 18 North America: Market Size, By Voltage, 2016�2023 (USD Million)
Table 19 North America: Market Size, By Impedance, 2016�2023 (USD Million)
Table 20 North America: Market Size, By End-User, 2016�2023 (USD Million)
Table 21 North America: Market Size, By Country, 2016�2023 (USD Million)
Table 22 US: Market Size, By Voltage, 2016�2023 (USD Million)
Table 23 Canada: Market Size, By Voltage, 2016�2023 (USD Million)
Table 24 Mexico: Market Size, By Voltage, 2016�2023 (USD Million)
Table 25 Asia Pacific: Market Size, By Voltage, 2016�2023 (USD Million)
Table 26 Asia Pacific: Market Size, By Impedance, 2016�2023 (USD Million)
Table 27 Asia Pacific: Market Size, By End-User, 2016�2023 (USD Million)
Table 28 Asia Pacific: Market Size, By Country, 2016�2023 (USD Million)
Table 29 China: Market Size, By Voltage, 2016�2023 (USD Million)
Table 30 India: Market Size, By Voltage, 2016�2023 (USD Million)
Table 31 Japan: Market Size, By Voltage, 2016�2023 (USD Million)
Table 32 Australia: Market Size, By Voltage, 2016�2023 (USD Million)
Table 33 South Korea: Market Size, By Voltage, 2016�2023 (USD Million)
Table 34 Indonesia: Market Size, By Voltage, 2016�2023 (USD Million)
Table 35 Rest of Asia Pacific: Market Size, By Voltage, 2016�2023 (USD Million)
Table 36 Europe: Market Size, By Voltage, 2016�2023 (USD Million)
Table 37 Europe: Market Size, By Impedance, 2016�2023 (USD Million)
Table 38 Europe: Market Size, By End-User, 2016�2023 (USD Million)
Table 39 Europe: Market Size, By Country, 2016�2023 (USD Million)
Table 40 Germany: Market Size, By Voltage, 2016�2023 (USD Million)
Table 41 UK: Market Size, By Voltage, 2016�2023 (USD Million)
Table 42 France: Market Size, By Voltage, 2016�2023 (USD Million)
Table 43 Italy: Market Size, By Voltage, 2016�2023 (USD Million)
Table 44 Norway: Market Size, By Voltage, 2016�2023 (USD Million)
Table 45 Russia: Market Size, By Voltage, 2016�2023 (USD Million)
Table 46 Rest of Europe: Market Size, By Voltage, 2016�2023 (USD Million)
Table 47 South America: Market Size, By Voltage, 2016�2023 (USD Million)
Table 48 South America: Market Size, By Impedance, 2016�2023 (USD Million)
Table 49 South America: Market Size, By End-User, 2016�2023 (USD Million)
Table 50 South America: Market Size, By Country, 2016�2023 (USD Million)
Table 51 Brazil: Market Size, By Voltage, 2016�2023 (USD Million)
Table 52 Argentina: Market Size, By Voltage, 2016�2023 (USD Million)
Table 53 Rest of South America: Market Size, By Voltage, 2016�2023 (USD Million)
Table 54 Middle East & Africa: Market Size, By Voltage, 2016�2023 (USD Million)
Table 55 Middle East & Africa: Market Size, By Impedance, 2016�2023 (USD Million)
Table 56 Middle East & Africa: Market Size, By End-User, 2016�2023 (USD Million)
Table 57 Middle East & Africa: Market Size, By Country, 2016�2023 (USD Million)
Table 58 Saudi Arabia: Market Size, By Voltage, 2016�2023 (USD Million)
Table 59 UAE: Market Size, By Voltage, 2016�2023 (USD Million)
Table 60 South Africa: Market Size, By Voltage, 2016�2023 (USD Million)
Table 61 Nigeria: Market Size, By Voltage, 2016�2023 (USD Million)
Table 62 Egypt: Market Size, By Voltage, 2016�2023 (USD Million)
Table 63 Rest of the Middle East & Africa: Market Size, By Voltage, 2016�2023 (USD Million)
Table 64 Abb�The Most Active Player in the Market Between 2015 and February 2018
Table 65 Contracts & Agreements, 2015�March 2018
Table 66 Investments and Expansions, 2015�March 2018
Table 67 Mergers & Acquisitions, 2015�March 2018
Table 68 Others, 2015�March 2018
List of Figures (32 Figures)
Figure 1 Busbar Protection Market Segmentation
Figure 2 Research Design
Figure 3 Breakdown of Priamries: By Compnay Type, Designation, and Region
Figure 4 Bottom-Up Approach
Figure 5 Top-Down Approach
Figure 6 Data Triangulation Methodolgy
Figure 7 Market, By Region, 2018�2023 (USD Million)
Figure 8 Market Size, By End-User, 2018�2023 (USD Billion)
Figure 9 Market Share, By Voltage, 2017 (USD Million)
Figure 10 Market Size, By Impedance, 2017�2023 (USD Million)
Figure 11 Opportunities in the Extra High Voltage Segment of the Market, 2018�2023
Figure 12 Utilities Segment is Leading the Market
Figure 13 Extra High Voltage Dominated the Asia Pacific Market in 2017
Figure 14 Low Impedacne Led the Market in 2017
Figure 15 Busbar Protection Market: Market Dynamics
Figure 16 Market Share, By Voltage, 2018�2023 (USD Million)
Figure 17 Market Share, By Impedance, 2017
Figure 18 Market Share, By End-User, 2017
Figure 19 Market, By Region, 2017
Figure 20 Regional Snapshot: the Market in Asia Pacific is Expected to Grow at the Highest CAGR During the Forecast Period
Figure 21 North America: Market Snapshot
Figure 22 Asia Pacific: Market Snapshot
Figure 23 Key Developments in Market, 2015-March 2018
Figure 24 ABB Led the Market in 2017
Figure 25 ABB: Company Snapshot
Figure 26 GE: Company Snapshot
Figure 27 Schneider Electric: Company Snapshot
Figure 28 Siemens: Company Snapshot
Figure 29 Mitsubishi Electric: Company Snapshot
Figure 30 Andritz: Company Snapshot
Figure 31 Eaton: Company Snapshot
Figure 32 Toshiba: Company Snapshot


Growth opportunities and latent adjacency in Busbar Protection Market