Blow-fill-seal Technology Market by Material (Polypropylene & Polyethylene), Product (Bottles, Vials, Ampoules), End-use Industry (Pharmaceutical), and Region (North & South America, Europe, Asia Pacific, Middle East & Africa) - Global Forecast to 2023


[139 Pages Report] The blow-fill-seal technology market has been growing in accordance with the growth trends of the pharmaceutical industries. Rising demand for the anti-contamination packaging mediums for pharmaceutical mediums have increased the traction for the blow-seal technology market,
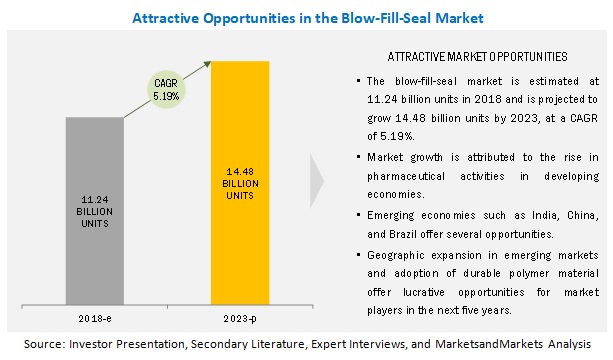
The global market for blow-fill-seal was valued at USD 278.13 million in 2017 and is projected to reach USD 385.97 million by 2023, at a CAGR of 5.7% from 2017. Due to factors such as rising per capita income and rising trends of pharmaceutical packaged products. The blow-fill-seal market is estimated to 11.24 billion units in 2018 and is predicted to grow to 14.48 billion units by 2023, at a CAGR of 5.19%.
The market for vials to grow at the highest CAGR during the forecast period
The vials product type segment is projected to grow at the highest CAGR from 2018 to 2023. As the vials are primarily used for multi-dose medical applications in the pharmaceutical industry.
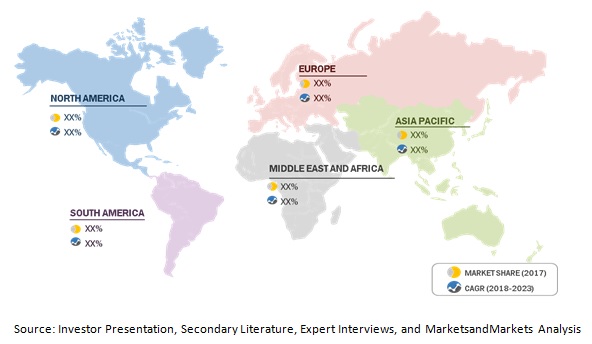
APAC to account for the largest market size during the forecast period
The Asia Pacific region is projected to be the fastest-growing market for blow-fill-seal technology. Factors such as the growing healthcare & pharmaceutical industry in China and India are driving the growth of the Asia Pacific blow-fill-seal technology market.
Market Dynamics
Driver: Increasing demand from pharmaceuticals and healthcare industries
A growing number of pharmaceutical manufacturers are using advanced sterilization technologies to minimize operator intervention and the risk of contamination in filling and packaging liquid parenteral drugs. Blow-fill-seal (BFS) technology provides various advantages, including flexibility in packaging design, low operating cost, assurance of high degree of sterility, limited space requirement, limited component inventory, and limited labor requirement, making it is a preferred technology for packaging drugs. Advancements in BFS technology are enabling packaging of a wider variety of containers, such as vials with inserted tips/caps, twist-off & re-closeable vials, multi-dose use bottles, eyewash & contact lens solution bottles, unit dose Pre-filled syringes & injectable, and electrolyte & sports drinks bottles. The demand for advanced aseptic packagings, such as bottles, vials, pre-filled syringes, and ampoules using the blow-fill-seal (BFS) technology is increasing in the pharmaceutical sector. Thus, due to the increase in demand for these product types, the market for blow-fill-seal (BFS) technology is set to grow substantially.
Opportunity: Increasing demand from the aseptic packaging industry
BFS technology provides a sterile solution, fulfilling the requirement for aseptic conditions by reducing human interference in the fill & finish process. Aseptic packaging using BFS technology provides high accuracy in terms of the number of uncontaminated products packed per minute. BFS technology is automated using which containers are formed, filled, and sealed in one continuous operation. BFS machinery is designed to prevent the potential for extraneous contamination, making it suitable for a single dose (unit-dose) aseptic and sterilized drug products. BFS technology is widely used for the aseptic packaging of respiratory, ophthalmic, oral, and Pre-filled syringes & injectable drugs. These products do not require refrigeration and are, therefore, convenient for consumers and cost-effective for distributors.
Challenge: Cost-to-benefit ratio a concern to small manufacturers
BFS technology is capital-intensive; the initial capital required to establish a BFS technology plant is high. Advanced technologies and a regulated environment are required to pack products aseptically using BFS technology. Players with high-investment capabilities are entering the market, as high returns are received only in the long term. Thus, small manufacturers are reluctant to invest as they do not have the capital required for the high initial investments. This discourages manufacturers from investing in this technology and reduces the upstream demand in the market.
Scope of the Report
|
Report Metric |
Details |
|
Market size available for years |
2016 � 2023 |
|
Base year considered |
2017 |
|
Forecast period |
2016 � 2023 |
|
Forecast units |
Million/Billion (USD), Billion (Units) |
|
Segments covered |
Material, Product, End-Use, and Region |
|
Geographies covered |
North America, Europe, APAC, RoW (South America, Middle East, and Africa) |
|
Companies covered |
Top key market players, including |
The research report categorizes the Blow-Fill-Seal market to forecast the revenues and analyze the trends in each of the following sub-segments:
Blow-Fill-Seal Market, By Material
- Polypropylene (PP)
- Polyethylene (PE)
Blow-Fill�Seal Market, By Product
- Bottles
- Ampoules
- Vials
- Prefilled syringes & injectable
Blow-Fill�Seal Market, By End-Use
- Pharmaceuticals
- Others (chemical, personal care, and food & beverage)
Market, By Region
- North America
- Europe
- Asia Pacific (APAC)
- South America
- The Middle East and Africa
Key Market Players
Catalent (US), Recipharm (Sweden), Unither Pharmaceuticals (France), Pharmapack (Japan), Rommelag (Germany).
Recent Developments
Date |
Company Name |
Description |
|
November 2017 |
Curida (US) |
Curida signed a contingency agreement with The Norwegian Armed forces, with the aim to get flexible access to goods and services while optimizing the cost of the raw materials. |
|
May 2017 |
Weiler Engineering (US) |
Noxilizer and Weiler Engineering signed an exclusive supply agreement for the blow-fill-seal market. With this agreement, Noxilizer will provide the NOX FLEX� Rapid Biodecontamination units for new Weiler Engineering, Inc. ASEP-TECH Blow-Fil-Seal systems. This will strengthen the company�s product portfolio |
|
July 2016 |
Curida (US) |
Curida and PCI Biotech entered into a manufacturing agreement with the aim to cater to the increasing demand of blow-fill-seal packaging technology from the pharmaceutical sector. |
|
December 2015 |
Recipharm (Sweden) |
Recipharm entered into a strategic manufacturing agreement with Alcon. This agreement was aimed at increasing the manufacturing range of ophthalmic products using Blow Fill Seal technology. |
Critical questions the report answers:
- What are the upcoming trends for the Blow-Fill-Seal market?
- Which segment provides the most opportunity for growth?
- Who are the leading vendors operating in this market?
- What are the opportunities for new market entrants?
To speak to our analyst for a discussion on the above findings, click Speak to Analyst
 Exclusive indicates content/data unique to MarketsandMarkets and not available with any competitors.
Table of Contents
1 Introduction (Page No. - 17)
1.1 Objectives of the Study
1.2 Market Definition
1.3 Study Scope
1.3.1 Regional Scope
1.3.2 Periodization Considered
1.4 Currency Considered
1.5 Units Considered
1.6 Stakeholders
2 Research Methodology (Page No. - 20)
2.1 Research Data
2.1.1 Secondary Data
2.1.1.1 Key Data From Secondary Sources
2.1.2 Primary Data
2.1.2.1 Key Data From Primary Sources
2.2 Market Size Estimation
2.3 Data Triangulation
2.4 Market Share Estimation
2.5 Research Assumptions & Limitations
2.5.1 Assumptions Made for This Study
2.5.2 Limitations Made for This Study
3 Executive Summary (Page No. - 28)
4 Premium Insights (Page No. - 32)
4.1 Developing Economies to Register High Growth in Demand for Blow-Fill-Seal Technology
4.2 Blow-Fill-Seal Technology Market, By Material
4.3 Blow-Fill-Seal Technology Market, By Product
5 Market Overview (Page No. - 34)
5.1 Introduction
5.2 Market Dynamics
5.2.1 Drivers
5.2.1.1 Increasing Demand From the Pharmaceutical & Healthcare Industries
5.2.1.2 Growth of the Parent Industry
5.2.1.3 Shift in Consumer Preference Against the Use of Food Preservatives
5.2.2 Opportunities
5.2.2.1 Increasing Demand From the Aseptic Packaging Industry
5.2.3 Challenges
5.2.3.1 Cost-To-Benefit Ratio A Concern to Small Manufacturers
6 Blow-Fill-Seal Technology Market, By Product (Page No. - 37)
6.1 Introduction
6.2 Bottles
6.3 Vials
6.4 Ampoules
6.5 Pre-Filled Syringes & Injectables
7 Blow-Fill-Seal Market, By Raw Material (Page No. - 41)
7.1 Introduction
7.2 Polypropylene (PP)
7.3 Polyethylene (PE)
7.3.1 High-Density Polyethylene
7.3.2 Low-Density Polyethylene (LDPE)
8 Blow-Fill-Seal Technology Market, By End-Use (Page No. - 45)
8.1 Introduction
8.2 Pharmaceuticals:
8.3 Others
9 Blow-Fill-Seal Technology Market, By Region (Page No. - 49)
9.1 Introduction
9.2 North America
9.2.1 US
9.2.2 Canada
9.2.3 Mexico
9.3 Europe
9.3.1 Germany
9.3.2 UK
9.3.3 France
9.3.4 Italy
9.3.5 Russia
9.3.6 Spain
9.3.7 Rest of Europe
9.4 Asia Pacific
9.4.1 China
9.4.2 Japan
9.4.3 Australia
9.4.4 India
9.4.5 Rest of Asia Pacific
9.5 Middle East & Africa
9.5.1 Turkey
9.5.2 UAE
9.5.3 South Africa
9.5.4 Rest of Middle East & Africa
10 Competitive Landscape (Page No. - 106)
10.1 Overview
10.2 Market Ranking of Key Players
10.2.1 Catalent
10.2.2 Recipharm AB
10.2.3 Unither Pharmaceuticals (France)
10.2.4 Sealed Air Corporation
10.2.5 Westrock
10.3 Competetive Scenario
10.3.1 Aggremnets
10.3.2 Expansions
10.3.3 Acquisitions
11 Company Profiles (Page No. - 110)
11.1 Introduction
(Business Overview, Products Offered, Recent Developments, SWOT Analysis, MnM View)*
11.2 Catalent
11.3 Recipharm
11.4 Unither Pharmaceuticals
11.5 Rommelag
11.6 Pharmapack
11.7 Unipharma
11.8 Curida
11.9 Weiler Engineering
11.10 The Ritedose Corporation
11.11 Unicep Packaging
11.12 Additional Company Profiles
11.12.1 Lyondellbasell
11.12.2 Gerresheimer
11.12.3 Bioconnection
11.12.4 Nupharma Group
11.12.5 Salvat
11.12.6 Primapharma
11.12.7 Asept Pak
11.12.8 Plastikon
11.12.9 Birgi Mefar Group
11.12.10 Unolab
*Details on Business Overview, Products Offered, Recent Developments, SWOT Analysis, MnM View Might Not Be Captured in Case of Unlisted Companies.
12 Appendix (Page No. - 133)
12.1 Discussion Guide: Bloe-Fill-Seal Technology Market
12.2 Knowledge Store: Marketsandmarkets Subscription Portal
12.3 Available Customizations
12.4 Related Reports
12.5 Author Details
List of Tables (160 Tables)
Table 1 Blow-Fill-Seal Technology Market Size, By Product, 2016�2023 (USD Million)
Table 2 Blow-Fill-Seal Technology Market Size, By Product, 2016-2023 (Million Units)
Table 3 Blow-Fill-Seal Technology Market Size, By Material, 2016-2023 (USD Million)
Table 4 Blow-Fill-Seal Technology Market Size, By Material, 2016-2023 (Billion Units)
Table 5 PP Properties
Table 6 HDPE Properties
Table 7 LDPE Properties
Table 8 Blow-Fill-Seal Technology Size, By End-Use, 2016�2023 (USD Million)
Table 9 Blow-Fill-Seal Technology Size, By End-Use, 2016�2023 (Million Units)
Table 10 Blow-Fill-Seal Technology By Market Size, By Region, 2016�2023 (USD Million)
Table 11 Blow-Fill-Seal Technology By Market Size, By Region, 2016�2023 (Million Units)
Table 12 North America: Blow-Fill-Seal Technology Market Size, By Country, 2016�2023 (USD Million)
Table 13 North America: Blow-Fill-Seal Technology Market Size, By Country, 2016�2023 (Million Units)
Table 14 North America: Blow-Fill-Seal Technology Market Size, By Material, 2016�2023 (USD Million)
Table 15 North America: Blow-Fill-Seal Technology Market Size, By Product, 2016�2023 (Million Units)
Table 16 North America: Blow-Fill-Seal Technology Market Size, By Product, 2016�2023 (USD Million)
Table 17 North America: Blow-Fill-Seal Technology Market Size, By Product, 2016�2023 (Million Units)
Table 18 North America: Blow-Fill-Seal Technology Market Size, By End-Use, 2016�2023 (USD Million)
Table 19 North America: Blow-Fill-Seal Technology Market Size, By End-Use, 2016�2023 (Million Units)
Table 20 US: Blow-Fill-Seal Technology Market Size, By Material, 2016�2023 (USD Million)
Table 21 US: Blow-Fill-Seal Technology Market Size, By Product, 2016�2023 (Million Units)
Table 22 US: By Market Size, By Product, 2016�2023 (USD Million)
Table 23 US: Blow-Fill-Seal Technology Market Size, By Product, 2016�2023 (Million Units)
Table 24 US: Blow-Fill-Seal Technology Market Size, By End-Use, 2016-2023 (USD Million)
Table 25 US: Blow-Fill-Seal Technology Market Size, By End-Use, 2016�2023 (Million Units)
Table 26 Canada: Blow-Fill-Seal Technology Market Size, By Material, 2016�2023 (USD Million)
Table 27 Canada: By Market Size, By Material, 2016�2023 (Million Units)
Table 28 Canada: By Market Size, By Product, 2016�2023 (USD Million)
Table 29 Canada: By Market Size, By Product, 2016�2023 (Million Units)
Table 30 Canada: By Market Size, By End-Use, 2016�2023 (USD Million)
Table 31 Canada: By Market Size, By End-Use, 2016�2023 (Million Units)
Table 32 Mexico: Blow-Fill-Seal Technology Market Size, By Material, 2016�2023 (USD Million)
Table 33 Mexico: By Market Size, By Material, 2016�2023 (Million Units)
Table 34 Mexico: By Market Size, By Product, 2016�2023 (USD Million)
Table 35 Mexico: By Market Size, By Product, 2016�2023 (Million Units)
Table 36 Mexico: By Market Size, By End-Use, 2016�2023 (USD Million)
Table 37 Mexico: By Market Size, By End-Use, 2016�2023 (Million Units)
Table 38 Europe: Blow-Fill-Seal Technology Market Size, By Country, 2016�2023 (USD Million)
Table 39 Europe: By Market Size, By Country, 2016�2023 (Million Units)
Table 40 Europe: By Market Size, By Material, 2016�2023 (USD Million)
Table 41 Europe: By Market Size, By Material, 2016�2023 (Million Units)
Table 42 Europe: By Market Size, By Product, 2016�2023 (USD Million)
Table 43 Europe: By Market Size, By Product, 2016�2023 (Million Units)
Table 44 Europe: By Market Size, By End-Use, 2016�2023 (USD Million)
Table 45 Europe: By Market Size, By End-Use, 2016�2023 (Million Units)
Table 46 Germany: Blow-Fill-Seal Technology Market Size, By Material, 2016�2023 (USD Million)
Table 47 Germany: By Market Size, By Material, 2016�2023 (Million Units)
Table 48 Germany: By Market Size, By Product, 2016�2023 (USD Million)
Table 49 Germany: By Market Size, By Product, 2016�2023 (Million Units)
Table 50 Germany: By Market Size, By End-Use, 2016�2023 (USD Million)
Table 51 Germany: By Market Size, By End-Use, 2016�2023 (Million Units)
Table 52 UK: Blow-Fill-Seal Technology Market Size, By Material, 2016�2023 (USD Million)
Table 53 UK: By Market Size, By Material, 2016�2023 (Million Units)
Table 54 UK: By Market Size, By Product, 2016�2023 (USD Million)
Table 55 UK: By Market Size, By Product, 2016�2023 (Million Units)
Table 56 UK: By Market, By End-Use, 2016�2023 (USD Million)
Table 57 UK: By Market Size, By End-Use, 2016�2023 (Million Units)
Table 58 France: Blow-Fill-Seal Technology Market Size, By Material, 2016�2023 (USD Million)
Table 59 France: By Market Size, By Material, 2016�2023 (Million Units)
Table 60 France: By Market Size, By Product, 2016�2023 (USD Million)
Table 61 France: By Market Size, By Product, 2016�2023 (Million Units)
Table 62 France: By Market Size, By End-Use, 2016�2023 (USD Million)
Table 63 France: By Market Size, By End-Use, 2016�2023 (Million Units)
Table 64 Italy: Blow-Fill-Seal Technology Market Size, By Material, 2016�2023 (USD Million)
Table 65 Italy: By Market Size, By Material, 2016�2023 (Billion Units)
Table 66 Italy: By Market Size, By Product, 2016�2023 (USD Million)
Table 67 Italy: By Market Size, By Product, 2016�2023 (Million Units)
Table 68 Italy: By Market Size, By End-Use, 2016�2023 (USD Million)
Table 69 Italy: By Market Size, By End-Use, 2016�2023 (Billion Units)
Table 70 Russia: Blow-Fill-Seal Technology Market Size, By Material, 2016�2023 (USD Million)
Table 71 Russia: By Market Size, By Material, 2016�2023 (Million Units)
Table 72 Russia: By Market Size, By Product, 2016�2023 (USD Million)
Table 73 Russia: By Market Size, By Type, 2016�2023 (Billion Units)
Table 74 Russia: By Market Size, By End-Use, 2016�2023 (USD Million)
Table 75 Russia: By Market Size, By End-Use, 2016�2023 (Billion Units)
Table 76 Spain: Blow-Fill-Seal Technology Market Size, By Material, 2016�2023 (USD Million)
Table 77 Spain: By Market Size, By Material, 2016�2023 (Million Units)
Table 78 Spain: By Market Size, By Product, 2016�2023 (USD Million)
Table 79 Spain: By Market Size, By Type, 2016�2023 (Million Units)
Table 80 Spain: By Market Size, By End-Use, 2016�2023 (USD Million)
Table 81 Spain: By Market Size, By End-Use, 2016�2023 (Million Units)
Table 82 Rest of Europe: Blow-Fill-Seal Technology Market Size, By Material, 2016�2023 (USD Million)
Table 83 Rest of Europe: By Market Size, By Material, 2016�2023 (Million Units)
Table 84 Rest of Europe: By Market Size, By Product, 2016�2023 (USD Million)
Table 85 Rest of Europe: By Market Size, By Product, 2016�2023 (Million Units)
Table 86 Rest of Europe: By Market Size, By End-Use, 2016�2023 (USD Million)
Table 87 Rest of Europe: By Market Size, By End-Use, 2016�2023 (Billion Units)
Table 88 Asia Pacific: Blow-Fill-Seal Technology Market Size, By Country, 2016�2023 (USD Million)
Table 89 Asia Pacific: By Market Size, By Country, 2016�2023 (Million Units)
Table 90 Asia Pacific: By Market Size, By Material, 2016�2023 (USD Million)
Table 91 Asia Pacific: By Market Size, By Material, 2016�2023 (Million Units)
Table 92 Asia Pacific: By Market Size, By Product, 2016�2023 (USD Million)
Table 93 Asia Pacific: By Market Size, By Product, 2016�2023 (Million Units)
Table 94 Asia Pacific: By Market Size, By End-Use, 2016�2023 (USD Million)
Table 95 Asia Pacific: By Market Size, By End-Use, 2016�2023 (Million Units)
Table 96 China: Blow-Fill-Seal Technology Market Size, By Material, 2016�2023 (USD Million)
Table 97 China: By Market Size, By Material, 2016�2023 (Million Units)
Table 98 China: By Market Size, By Product, 2016�2023 (USD Million)
Table 99 China: By Market Size, By Product, 2016�2023 (Million Units)
Table 100 China: By Market Size, By End-Use, 2016�2023 (USD Million)
Table 101 China: By Market Size, By End-Use, 2016�2023 (Million Units)
Table 102 Japan: Blow-Fill-Seal Technology Market Size, By Material, 2016�2023 (USD Million)
Table 103 Japan: By Market Size, By Material, 2016�2023 (Million Units)
Table 104 Japan: By Market Size, By Product, 2016�2023 (USD Million)
Table 105 Japan: By Market Size, By Product, 2016�2023 (Million Units)
Table 106 Japan: By Market Size, By End-Use, 2016�2023 (USD Million)
Table 107 Japan: By Market Size, By End-Use, 2016�2023 (Billion Units)
Table 108 Australia: Blow-Fill-Seal Technology Market Size, By Material, 2016�2023 (USD Million)
Table 109 Australia: By Market Size, By Material, 2016�2023 (Million Units)
Table 110 Australia: By Market Size, By Product, 2016�2023 (USD Million)
Table 111 Australia: By Market Size, By Product, 2016�2023 (Million Units)
Table 112 Australia: By Market Size, By End-Use, 2016�2023 (USD Million)
Table 113 Australia: By Market Size, By End-Use, 2016�2023 (Million Units)
Table 114 India: Blow-Fill-Seal Technology Market Size, By Material, 2016�2023 (USD Million)
Table 115 India: By Market Size, By Material, 2016�2023 (Million Units)
Table 116 India: By Market Size, By Product, 2016�2023 (USD Million)
Table 117 India: By Market Size, By Product, 2016�2023 (Million Units)
Table 118 India: By Market Size, By End-Use, 2016�2023 (USD Million)
Table 119 India: By Market Size, By End-Use, 2016�2023 (Million Units)
Table 120 Rest of Asia Pacific: Blow-Fill-Seal Technology Market Size, By Material, 2016�2023 (USD Million)
Table 121 Rest of Asia Pacific: By Market Size, By Type, 2016�2023 (Million Units)
Table 122 Rest of Asia Pacific: By Market Size, By Product, 2016�2023 (USD Million)
Table 123 Rest of Asia Pacific: By Market Size, By Product, 2016�2023 (Million Units)
Table 124 Rest of Asia-Pacific: By Market Size, By End-Use, 2016�2023 (USD Million)
Table 125 Rest of Asia-Pacific: By Market Size, By End-Use, 2016�2023 (Million Units)
Table 126 Middle East & Africa: Blow-Fill-Seal Technology Market Size, By Country, 2016�2023 (USD Million)
Table 127 Middle East & Africa: By Market Size, By Country, 2016�2023 (Million Units)
Table 128 Middle East & Africa: By Market Size, By Material, 2016�2023 (USD Million)
Table 129 Middle East & Africa: By Market Size, By Material, 2016�2023 (Million Units)
Table 130 Middle East & Africa: By Market Size, By Product, 2016�2023 (USD Million)
Table 131 Middle East & Africa: By Market Size, By Product, 2016�2023 (Million Units)
Table 132 Middle East & Africa: By Market Size, By End-Use, 2016�2023 (USD Million)
Table 133 Middle East & Africa: By Market Size, By End-Use, 2016�2023 (Million Units)
Table 134 Turkey: Blow-Fill-Seal Technology Market Size, By Material, 2016�2023 (USD Million)
Table 135 Turkey: By Market Size, By Material, 2016�2023 (Million Units)
Table 136 Turkey: By Market Size, By Product, 2016�2023 (USD Million)
Table 137 Turkey: By Market Size, By Product, 2016�2023 (Million Units)
Table 138 Turkey: By Market Size, By End-Use, 2016�2023 (USD Million)
Table 139 Turkey: By Market Size, By End-Use, 2016�2023 (Million Units)
Table 140 UAE: Blow-Fill-Seal Technology Market Size, By Material, 2016�2023 (USD Million)
Table 141 UAE: By Market Size, By Material, 2016�2023 (Million Units)
Table 142 UAE: By Market Size, By Product, 2016�2023 (USD Million)
Table 143 UAE: By Market Size, By Product, 2016�2023 (Million Units)
Table 144 UAE: By Market Size, By End-Use, 2016�2023 (USD Million)
Table 145 UAE: By Market Size, By End-Use, 2016�2023 (Million Units)
Table 146 South Africa: Blow-Fill-Seal Technology Market Size, By Material, 2016�2023 (USD Million)
Table 147 South Africa: By Technology Market Size, By Material, 2016�2023 (Million Units)
Table 148 South Africa: By Market Size, By Product, 2016�2023 (USD Million)
Table 149 South Africa: By Market Size, By Product, 2016�2023 (Million Units)
Table 150 South Africa: By Market Size, By End-Use, 2016�2023 (USD Million)
Table 151 South Africa: By Market Size, By End-Use, 2016�2023 (Million Units)
Table 152 Rest of Middle East & Africa: By Market Size, By Material, 2016�2023 (USD Million)
Table 153 Rest of Middle East & Africa: By Market Size, By Type, 2016�2023 (Million Units)
Table 154 Rest of Middle East & Africa: By Market Size, By Product, 2016�2023 (USD Million)
Table 155 Rest of Middle East & Africa: By Market Size, By Product, 2016�2023 (Million Units)
Table 156 Rest of Middle East & Africa: By Market Size, By End-Use, 2016�2023 (USD Million)
Table 157 Rest of Middle East & Africa: By Market Size, By End-Use, 2016�2023 (Million Units)
Table 158 Aggrements
Table 159 Expansions
Table 160 Acquisitions
List of Figures (23 Figures)
Figure 1 Market Segmentation
Figure 2 Blow-Fill-Seal Technology Market, By Region
Figure 3 Blow-Fill-Seal (BFS) Technology Market: Research Design
Figure 4 Breakdown of Primaries
Figure 5 Market Size Estimation Methodology: Bottom-Up Approach
Figure 6 Market Size Estimation Methodology: Top-Down Approach
Figure 7 Data Triangulation Methodology
Figure 8 Pharamceutical Industry is Projected to Be the Leader in the Market During the Forecast Period
Figure 9 Market for Vials to Grow at the Highest CAGR During the Forecast Period
Figure 10 Market for Vials to Grow at the Highest CAGR During the Forecast Period
Figure 11 China is Projected to Be the Fastest-Growing Market for Blow-Fill-Seal Technology in Terms of Value (CAGR %)
Figure 12 Rise in Pharmaceutical in Developing Economies Offer Attractive Opportunities in the Blow-Fill-Seal Technology Market
Figure 13 The PP Segment to Dominate the Blow-Fill-Seal Technology Market in 2018
Figure 14 Vials Segment to Grow at the Highest Rate During the Forecast Period
Figure 15 Overview of the Factors Prevailing in the Blow-Fill-Seal Market
Figure 16 Blow-Fill-Seal Equipment Market, By Product, 2018 vs 2023 (USD Million)
Figure 17 Blow-Fill-Seal Technology Market Size, By Material, 2018 and 2023
Figure 18 Blow-Fill-Seal Technology, By End-Use 2023 (USD Million)
Figure 19 Geographical Snapshot (2018�2023): China is Projected to Register the Highest Growth Rate
Figure 20 Companies Adopted Various Growth Strategies From 2015 to 2018
Figure 21 Market Ranking
Figure 22 Catalent: Company Snapshot
Figure 23 Recipharm : Company Snapshot


Growth opportunities and latent adjacency in Blow-fill-seal Technology Market