Automotive Microcontrollers Market by Application (Body Electronics, Chassis & Powertrain, Infotainment & Telematics, Safety & Security), Technology (ACC, Blind Spot Detection, Park Assist, TPMS), Vehicle, EV, Bit Size, Connectivity, and Region - Global Forecast to 2023


The global automotive microcontrollers market was valued at USD 8.89 billion in 2018 and is expected to reach USD 13.23 billion by 2023 at a CAGR of 8.29% during the forecast period 2018-2023. Automated electronic control technologies for automotive systems such as advanced driver assistance systems (ADAS), electronic stability control (ESC), and electronic control unit (ECU) have been evolving year after year. The new trend in the automotive industry is to manufacture vehicles that feature advanced technologies with the optimized weight-cost ratio.
Safety and security system is estimated to hold the largest market share of the automotive microcontrollers market, by application, due to increased adoption of advanced single and multi-core microcontrollers in an automobile. Factors contributing to the growth of this segment include the mandates related to safety and security features. These include the mandatory installation of ABS in passenger cars from 2018 in India and the regulation regarding the installation of TPMS in commercial vehicles in many countries of the world.
By bit-size segmentation, the market for 32-bit microcontrollers is estimated to experience the highest growth during the forecast period. With the advent of the era of electric vehicles, the use of advanced power electronics components has increased. The 32-bit microcontrollers are widely used in all the major advanced applications of electric as well as conventional vehicles.
By electric vehicle type, HEV is estimated to hold the largest share of the automotive microcontrollers market during the forecast period. The market growth can be attributed to the high level of production of HEVs during the forecast period. Also, the installation of 32-bit multi core/fusion box microcontrollers is higher in this segment, as compared to IC engine vehicles, because of the complexed power distribution of the vehicle.
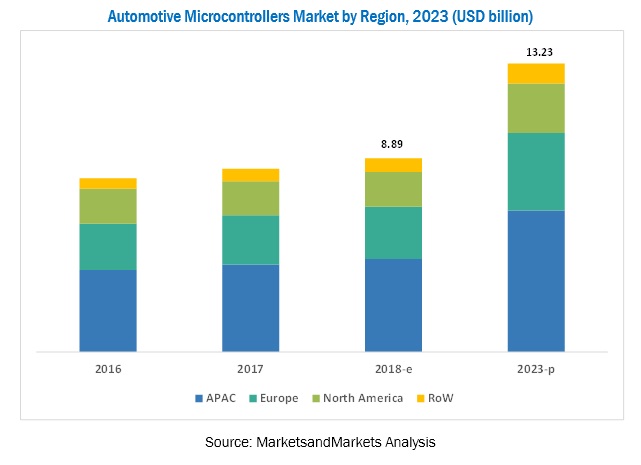
Asia-Pacific is estimated to lead the automotive microcontrollers market during the forecast period, followed by North America and Europe. The European market is growing at a steady pace as most of the vehicles are equipped with high-end electronics and safety features. The North American market is experiencing a balanced growth, in terms of value and volume, as the microcontrollers market has gained popularity in the region. The existing vehicles in North America are already equipped with advanced safety features and body electronics, which serve the majority of the market.
Restraints of the Automotive Microcontrollers Market:
Despite the high demand for advanced automotive electrical systems, the market still experiences certain obstacles. The restraints for the market include providing integrated and lightweight components along with optimizing cost and quality trade-off.
The global automotive microcontrollers market is dominated by a few players such as NXP Semiconductors N.V. (Netherlands), Infineon Technologies AG (Germany), Toshiba Corp. (Japan), and Texas Instruments Inc. (U.S.) along with other tier I and II suppliers.
To speak to our analyst for a discussion on the above findings, click Speak to Analyst
The automotive microcontrollers market, in terms of value, is projected to grow at a CAGR of 8.29% from 2018 to 2023. The market was estimated to be USD 8.41 billion in 2017. In this study, 2017 has been considered the base year, and 2018 to 2023 the forecast period, for estimating the market size of the market. The market report analyzes and forecasts the market size, in terms of volume (million units) and value (USD million), for passenger cars and commercial vehicles. It also forecasts the market size, in terms of volume (thousand units) and value (USD thousand), for electric vehicles. The report segments the market and forecasts its size, by volume and value, based on application type, vehicle type, electric vehicle type, bit size, connectivity, technology, and region. The report provides a detailed analysis of various forces acting in the market including drivers, restraints, opportunities, and challenges. It strategically profiles key players and comprehensively analyzes their market shares and core competencies. It also tracks and analyzes competitive developments such as joint ventures, mergers & acquisitions, new product launches, expansions, and other activities carried out by key industry participants.
The research methodology used in the report involves various secondary sources such as Japan Automobile Manufacturers Association (JAMA), European Automobile Manufacturers Association (EAMA), Canadian Automobile Association (CAA), and Korea Automobile Manufacturers Association (KAMA). Experts from related industries and suppliers have been interviewed to understand the future trends of the automotive microcontrollers market. Both, bottom-up and top-down approaches have been used to estimate and validate the size of the global market. The market size, by volume, is derived by identifying the region-wise production volumes and analyzing the demand trends. The market size, by value, is derived by multiplying the average selling price of automotive microcontrollers by the number of microcontrollers installed in the automobiles of that region.
The figure given below illustrates the break-up of the profile of industry experts who participated in primary discussions.
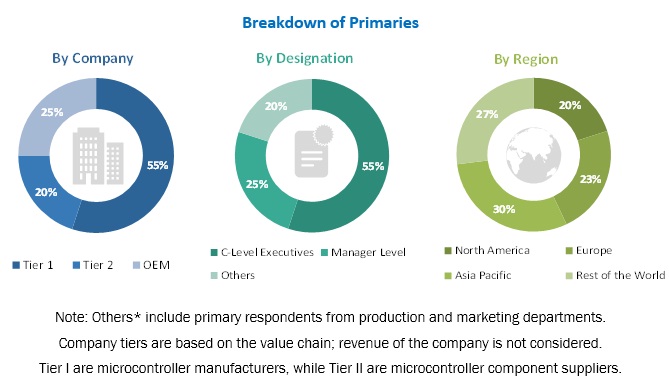
To know about the assumptions considered for the study, download the pdf brochure
The ecosystem of the automotive microcontrollers market consists of manufacturers such as Toshiba Corp (Japan), Infineon Technologies AG (Germany), NXP Semiconductors (Netherlands), ON Semiconductor (U.S.), and Analog Devices Inc. (U.S) and research institutes such as the Japan Automobile Manufacturers Association (JAMA), European Automobile Manufacturers Association (EAMA), Canadian Automobile Association (CAA), and Korea Automobile Manufacturers Association (KAMA).
Target Audience of Automotive Microcontrollers Market
- Automotive microcontroller manufacturers
- Automobile manufacturers
- Microcontroller design companies
- Automobile organizations/associations
- Microcontroller suppliers
- Raw material suppliers for microcontrollers
- Traders and distributors of microcontrollers
- Manufacturers of automotive microcontrollers for passenger cars, light commercial vehicles, and heavy commercial vehicles
- Automotive wires and cables manufacturers
- Raw material suppliers
- Automotive component manufacturers
- Tier 1, Tier 2, and Tier 3 suppliers
- Distributors and suppliers of automotive components/parts
Scope of the Automotive Microcontrollers Market Report
Automotive Microcontrollers Market, By Application Type
- Powertrain and Chassis
- Body Electronics
- Safety and Security Systems
- Infotainment and Telematics
Automotive Microcontrollers Market, By Electric vehicle type
- BEV
- HEV
- PHEV
- FCEV
Automotive Microcontrollers Market, By Vehicle Type
- Passenger Cars (PC)
- Commercial Vehicles (CV)
Automotive Microcontrollers Market, By Bit Size
- 8-bit Microcontrollers
- 16-Bit Microcontrollers
- 32-Bit Microcontrollers
Automotive Microcontrollers Market, By Technology
- Adaptive Cruise Control
- Park Assist System
- Blind Spot Detection
- Tire Pressure Monitoring System
Automotive Microcontrollers Market, By Connectivity
- Vehicle to Vehicle (V2V) Connectivity
- Vehicle to Infrastructure (V2I) Connectivity
- Vehicle to Cloud (V2C) Connectivity
Automotive Microcontrollers Market, By Region
- Asia-Pacific
- Europe
- North America
- Rest of the World
Available Customizations of Automotive Microcontrollers Market
MarketsandMarkets offers the following customizations for this market report:
- Detailed analysis and profiling of additional regions (up to 3)
- Detailed analysis and profiling of additional market players (up to 3)
- Detailed analysis of additional automotive microcontroller variants (only 1)
- Detailed analysis of automotive semi-autonomous and autonomous market (up to 2 regions)
 Exclusive indicates content/data unique to MarketsandMarkets and not available with any competitors.
Table of Contents
1 Introduction (Page No. - 17)
1.1 Objectives of the Study
1.2 Automotive Microcontrollers Market Definition
1.3 Market Scope
1.3.1 Years Considered in the Report
1.4 Currency & Pricing
1.5 Package Size
1.6 Limitations
1.7 Stakeholders
2 Research Methodology (Page No. - 21)
2.1 Research Data
2.2 Secondary Data
2.2.1 Key Secondary Sources
2.2.2 Key Data From Secondary Sources
2.3 Primary Data
2.3.1 Sampling Techniques & Data Collection Methods
2.3.2 Primary Participants
2.4 Factor Analysis
2.4.1 Demand-Side Analysis
2.4.1.1 32-Bit Microcontrollers Form the Basis of Autonomous Driving Systems
2.4.1.2 Wide Application Spectrum of Microcontrollers in Luxury and Mid-Range Vehicles
2.4.2 Supply-Side Analysis
2.4.2.1 Imposition of Legal Safety Mandates in the Automotive Industry is Driving the Microcontrollers Market
2.5 Market Size Estimation
2.5.1 Bottom-Up Approach
2.5.2 Top Down Approach
2.6 Market Breakdown and Data Triangulation
2.7 Assumptions
3 Executive Summary (Page No. - 34)
4 Premium Insights (Page No. - 39)
4.1 Attractive Opportunities in the Global Automotive Microcontrollers Market
4.2 Market, By Application
4.3 Market, By Technology
4.4 Market, By Bit Size
4.5 Market, By Vehicle
4.6 Market, By EV
5 Automotive Microcontrollers Market Overview (Page No. - 45)
5.1 Introduction
5.2 Market Dynamics
5.2.1 Drivers
5.2.1.1 Increasing Modernization of the Vehicle Accelerates the Installation Rate of Microcontrollers
5.2.1.2 Affinity for Infotainment in Automobiles
5.2.1.3 Shift Towards EVs
5.2.1.4 Trimming Down Fuel Consumption and Emission
5.2.2 Restraints
5.2.2.1 Demand for Low-Cost Vehicles in the APAC
5.2.2.2 Operational Failure in Extreme Conditions
5.2.2.3 Increasing Number of Cyber Threats
5.2.3 Opportunities
5.2.3.1 Growing Demand for Advanced Safety, Convenience, and Comfort Systems
5.2.3.2 Increasing Rate of Installations of Advanced Applications in Luxury and Mid-Range Vehicles
5.2.4 Challenges
5.2.4.1 Cost and Quality Trade-Off for Manufacturing Microcontrollers
5.2.4.2 Complexity of Design
5.3 Porter’s Five Forces Analysis
5.3.1 Porter’s Five Forces
5.3.2 Threat of New Entrants
5.3.2.1 Moderate Market Growth and Presence of Good Number of Players in the Market
5.3.3 Threat of Substitutes
5.3.3.1 Fewer Substitute Options for Automotive Microcontrollers
5.3.4 Bargaining Power of Suppliers
5.3.4.1 Long-Term Contracts With Automotive Oems Impact the Bargaining Power of Suppliers
5.3.5 Bargaining Power of Buyers
5.3.5.1 Integration of Electronic Systems in Automotive Impacts the Bargaining Power of Buyers
5.3.6 Intensity of Competitive Rivalry
5.3.6.1 Breakthrough Innovations Intensify the Competition of Rivalry
6 Technological Overview (Page No. - 58)
6.1 Introduction
6.2 Value Chain Analysis
6.3 MCU Application in Active Sensors
6.3.1 Radar Microcontrollers
6.3.2 Lidar Microcontrollers
6.3.3 Cameras & Sensors Microcontrollers
6.4 Upcoming Trends
6.4.1 64-Bit and 32-Bit Fusion Box Microcontrollers
6.4.2 Microcontrollers — Autonomous and Semi-Autonomous Vehicles
7 Global Automotive Microcontrollers Market, By Application (Page No. - 65)
7.1 Introduction
7.1.1 Powertrain & Chassis
7.1.2 Safety & Security
7.1.3 Body Electronics
7.1.4 Telematics & Infotainment
8 Global Automotive Microcontrollers Market, By Bit Size (Page No. - 77)
8.1 Introduction
8.1.1 8-Bit Microcontrollers
8.1.2 16-Bit Microcontrollers
8.1.3 32-Bit Microcontrollers
8.1.4 32-Bit Microcontrollers Fusion Box
9 Global Automotive Microcontrollers Market, By Connectivity (Page No. - 86)
9.1 Introduction
9.1.1 V2V Connectivity
9.1.2 V2I Connectivity
9.1.3 V2C Connectivity
10 Global Automotive Microcontrollers Market, By Technology (Page No. - 95)
10.1 Introduction
10.1.1 Park Assist System
10.1.2 Blind Spot Detection System
10.1.3 ACC
10.1.4 TPMS
11 Global Automotive Microcontrollers Market, By EV (Page No. - 106)
11.1 Introduction
11.1.1 BEV
11.1.2 HEV
11.1.3 PHEV
11.1.4 FCEV
12 Global Automotive Microcontrollers Market, By Vehicle (Page No. - 116)
12.1 Introduction
12.1.1 Passenger Car
12.1.2 Commercial Vehicle
13 Global Automotive Microcontrollers Market, By Region (Page No. - 124)
13.1 Introduction
13.2 APAC
13.2.1 China
13.2.2 India
13.2.3 Japan
13.2.4 South Korea
13.3 Europe
13.3.1 France
13.3.2 Germany
13.3.3 Italy
13.3.4 Spain
13.3.5 U.K.
13.4 North America
13.4.1 Canada
13.4.2 U.S.
13.5 Latin America
13.5.1 Brazil
13.5.2 Mexico
13.6 RoW
13.6.1 Russia
13.6.2 South Africa
14 Company Profiles (Page No. - 153)
(Business Overview, Services Offered, Strength of Service Portfolio, Business Strategy Excellence, Recent Developments)*
14.1 Analog Devices, Inc.
14.2 Cypress Semiconductor Corporation
14.3 Infineon Technologies AG
14.4 Microchip Technology Inc.
14.5 NXP Semiconductors
14.6 On Semiconductor
14.7 Renesas Electronics Corporation
14.8 Rohm Semiconductor
14.9 Stmicroelectronics
14.10 Texas Instruments Incorporated
14.11 Toshiba Corporation
14.12 Maxim Integrated
*Details on Business Overview, Services Offered, Strength of Service Portfolio, Business Strategy Excellence, Recent Developments Might Not Be Captured in Case of Unlisted Companies.
15 Appendix (Page No. - 193)
15.1 Key Insights of Industry Experts
15.2 Discussion Guide
15.3 Knowledge Store: Marketsandmarkets’ Subscription Portal
15.4 Introducing Rt: Real-Time Market Intelligence
15.5 Available Customizations
15.5.1 Detailed Analysis and Profiling of Market Players (Up to 3)
15.5.2 Detailed Analysis of Additional Countries (Up to 2)
15.5.3 Detailed Analysis of Additional Variants of 64-Bit Microcontrollers
15.5.4 Detailed Analysis of Additional Technologies in Adas for Automotive Microcontrollers Market (Up to 2)
15.6 Related Reports
15.7 Author Details
List of Tables (97 Tables)
Table 1 Currency Exchange Rates (W.R.T USD)
Table 2 Regulations for Adas
Table 3 Porter’s Five Forces Analysis
Table 4 Market Size, By Application, 2015–2022 (Million Units)
Table 5 Market Size, By Application, 2015–2022 (USD Million)
Table 6 Market for Powertrain & Chassis, By Region, 2015–2022 (Million Units)
Table 7 Market for Powertrain & Chassis, By Region, 2015–2022 (USD Million)
Table 8 Market for Safety & Security, By Region, 2015–2022 (Million Units)
Table 9 Market for Safety & Security, By Region, 2015–2022 (USD Million)
Table 10 Market for Body Electronics, By Region, 2015–2022 (Million Units)
Table 11 Market for Body Electronics, By Region, 2015–2022 (USD Million)
Table 12 Market for Telematics & Infotainment, By Region, 2015–2022 (Million Units)
Table 13 Market for Telematics & Infotainment, By Region, 2015–2022 (USD Million)
Table 14 Market Size, By Bit Size, 2015–2022 (Million Units)
Table 15 Market Size, By Bit Size, 2015–2022 (USD Million)
Table 16 Market for 8 Bit-Size, By Region, 2015–2022 (Million Units)
Table 17 Market for 8 Bit-Size, By Region, 2015–2022 (USD Million)
Table 18 Market for 16 Bit-Size, By Region, 2015–2022 (Million Units)
Table 19 Market for 16 Bit-Size, By Region, 2015–2022 (USD Million)
Table 20 Market for 32 Bit-Size, By Region, 2015–2022 (Million Units)
Table 21 Market for 32 Bit-Size, By Region, 2015–2022 (USD Million)
Table 22 Market Size, By Connectivity, 2015–2022 (Million Units)
Table 23 Market Size, By Connectivity, 2015–2022 (USD Million)
Table 24 Market for V2V Connectivity, By Region, 2015–2022 (Million Units)
Table 25 Market for V2V Connectivity, By Region, 2015–2022 (USD Million)
Table 26 Market for V2I Connectivity, By Region, 2015–2022 (Million Units)
Table 27 Market for V2I Connectivity, By Region, 2015–2022 (USD Million)
Table 28 Market for V2C Connectivity, By Region, 2015–2022 (Million Units)
Table 29 Market for V2C Connectivity, By Region, 2015–2022 (USD Million)
Table 30 Market Size, By Technology, 2015–2022 (Thousand Units)
Table 31 Market Size, By Technology, 2015–2022 (USD Million)
Table 32 Park Assist System: Global Automotive Microcontrollers Market Size, By Region, 2015–2022 (Thousand Units)
Table 33 Park Assist System: Market Size, By Region, 2015–2022 (USD Million)
Table 34 Blind Spot Detection System: Market Size, By Region, 2015–2022 (Thousand Units)
Table 35 Blind Spot Detection System: Market Size, By Region, 2015–2022 (USD Million)
Table 36 ACC: Market Size, By Region, 2015–2022 (Thousand Units)
Table 37 ACC: Market Size, By Region, 2015–2022 (USD Million)
Table 38 TPMS: Market Size, By Region, 2015–2022 (Thousand Units)
Table 39 TPMS: Market Size, By Region, 2015–2022 (USD Million)
Table 40 Global Market Size for EV, By Propulsion Type, 2015–2022 (Thousand Units)
Table 41 Global Market Size for EV, By Propulsion Type, 2015–2022 (USD Thousand)
Table 42 BEV: Global Market, By Region, 2015–2022 (Thousand Units)
Table 43 BEV: Global Market, By Region, 2015–2022 (USD Thousand)
Table 44 HEV: Global Market, By Region, 2015–2022 (Thousand Units)
Table 45 HEV: Global Market, By Region, 2015–2022 (USD Thousand)
Table 46 PHEV: Global Market, By Region, 2015–2022 (Thousand Units)
Table 47 PHEV: Global Market, By Region, 2015–2022 (USD Thousand)
Table 48 FCEV: Global Market, By Region, 2015–2022 (Thousand Units)
Table 49 FCEV: Global Market, By Region, 2015–2022 (USD Thousand)
Table 50 Global Market Size, By Vehicle, 2015–2022 (Million Units)
Table 51 Global Market Size, By Vehicle Type, 2015–2022 (USD Million)
Table 52 Passenger Car: Market Size, By Region, 2015–2022 (Million Units)
Table 53 Passenger Car: Market Size, By Region, 2015–2022 (USD Million)
Table 54 Commercial Vehicle: Market Size, By Region, 2015–2022 (Million Units)
Table 55 Commercial Vehicle: Market Size, By Region, 2015–2022 (USD Million)
Table 56 Market Size, By Region, 2015–2022 (Million Units)
Table 57 Market Size, By Region, 2015–2022 (USD Million)
Table 58 APAC: Market Size, By Country, 2015–2022 (Million Units)
Table 59 APAC: Market Size, By Country, 2015–2022 (USD Million)
Table 60 China: Market Size, By Application, 2015–2022 (Million Units)
Table 61 China: Market Size, By Application, 2015–2022 (USD Million)
Table 62 India: Market Size, By Application, 2015–2022 (Million Units)
Table 63 India: Market Size, By Application, 2015–2022 (USD Million)
Table 64 Japan: Market Size, By Application, 2015–2022 (Million Units)
Table 65 Japan: Market Size, By Application, 2015–2022 (USD Million)
Table 66 South Korea: Market Size, By Application, 2015–2022 (Million Units)
Table 67 South Korea: Market Size, By Application, 2015–2022 (USD Million)
Table 68 Europe: Market Size, By Country, 2015–2022 (Million Units)
Table 69 Europe: Market Size, By Country, 2015–2022 (USD Million)
Table 70 France: Market Size, By Application, 2015–2022 (Million Units)
Table 71 France: Market Size, By Application, 2015–2022 (USD Million)
Table 72 Germany: Market Size, By Application, 2015–2022 (Million Units)
Table 73 Germany:Market Size, By Application, 2015–2022 (USD Million)
Table 74 Italy: Market Size, By Application, 2015–2022 (Million Units)
Table 75 Italy: Market Size, By Application, 2015–2022 (USD Million)
Table 76 Spain: Market Size, By Application, 2015–2022 (Million Units)
Table 77 Spain: Market Size, By Application, 2015–2022 (USD Million)
Table 78 U.K.: Market Size, By Application, 2015–2022 (Million Units)
Table 79 U.K.: Market Size, By Application, 2015–2022 (USD Million)
Table 80 North America: Market Size, By Country, 2015–2022 (Million Units)
Table 81 North America: Market Size, By Country, 2015–2022 (USD Million)
Table 82 Canada: Market Size, By Application, 2015–2022 (Million Units)
Table 83 Canada: Market Size, By Application, 2015–2022 (USD Million)
Table 84 U.S.: Market Size, By Application, 2015–2022 (Million Units)
Table 85 U.S.: Market Size, By Application, 2015–2022 (USD Million)
Table 86 Latin America: Market Size, By Country, 2015–2022 (Million Units)
Table 87 Latin America: Market Size, By Country, 2015–2022 (USD Million)
Table 88 Brazil: Market Size, By Application, 2015–2022 (Million Units)
Table 89 Brazil: Market Size, By Application, 2015–2022 (USD Million)
Table 90 Mexico: Market Size, By Application, 2015–2022 (Million Units)
Table 91 Mexico: Market Size, By Application, 2015–2022 (USD Million)
Table 92 RoW: Market Size, By Country, 2015–2022 (Million Units)
Table 93 RoW: Market Size, By Country, 2015–2022 (USD Million)
Table 94 Russia: Market Size, By Application, 2015–2022 (Million Units)
Table 95 Russia: Market Size, By Application, 2015–2022 (USD Million)
Table 96 South Africa: Market Size, By Application, 2015–2022 (Million Units)
Table 97 South Africa: Market Size, By Application, 2015–2022 (USD Million)
List of Figures (77 Figures)
Figure 1 Market Segments of Automotive Microcontrollers, 2017–2022
Figure 2 Global Automotive Microcontrollers Market: Research Design
Figure 3 Research Design Model
Figure 4 Breakdown of Primary Interviews
Figure 5 Installation of Microcontrollers in Autonomous Vehicles
Figure 6 Breakdown of Microcontrollers’ Application, By Vehicle Engine Type
Figure 7 Market: Bottom-Up Approach
Figure 8 Market, By Bit Size: Top Down Approach
Figure 9 Data Triangulation
Figure 10 Market Attractiveness: Global Automotive Microcontrollers
Figure 11 Market Size, By Application, 2017-2022 (USD Million)
Figure 12 Market Size, By Region, 2017-2022 (USD Million)
Figure 13 Market Size, By Bit Size, 2017-2022 (USD Million)
Figure 14 Market to Record A CAGR of 13.78% During the Forecast Period
Figure 15 Safety & Security Segment to Record Highest CAGR, 2017-2022
Figure 16 Park Assist System to Witness Significant Demand, 2017-202 (USD Million)
Figure 17 32-Bit Microcontrollers Segment to Lead Automotive Microcontrollers Market, 2017-2022 (USD Million)
Figure 18 Passenger Cars Segment to Record Highest CAGR, 2017-2022 (USD Million)
Figure 19 HEVs Segment to Lead Market, 2017-2022 (USD Thousand)
Figure 20 Global Automotive Microcontrollers: Market Dynamics
Figure 21 Number of Microcontrollers Installed Per Vehicle, 2010 vs 2017
Figure 22 Global Automotive Infotainment System Sales, 2014–2020
Figure 23 BEV Sales in Major Regions, 2017 vs 2022 (Thousand Units)
Figure 24 Porter’s Five Forces Analysis – Advanced Technologies and Presence of Established Players Affect the Degree of Competition
Figure 25 Moderate Impact of Threat of New Entrants in Aftermarket Segment
Figure 26 Lack of Alternatives Results in Low Threat of Substitutes
Figure 27 Competitive Pricing and Technological Upgradation Have Reduced Bargaining Power of Suppliers
Figure 28 Demand for Specific Technological Features as Well as Order Volume Strengthen the Bargaining Power of Buyers
Figure 29 Rapid Introduction and Upgradation of Technologies is Intensifying the Competitive Rivalry
Figure 30 Block Diagram of A Conventional Automotive Microcontroller
Figure 31 Block Diagram of A Radar Sensor
Figure 32 Block Diagram of A Lidar Sensor
Figure 33 Block Diagram of Adas Front Camera
Figure 34 Market, By Application, 2017 vs 2022 (USD Million)
Figure 35 Powertrain & Chassis: Market, By Region, 2017 vs 2022 (USD Million)
Figure 36 Safety & Security: Market, By Region, 2017 vs 2022 (USD Million)
Figure 37 Body Electronics: Market, By Region, 2017 vs 2022 (USD Million)
Figure 38 Telematics & Infotainment: Market, By Region, 2017 vs 2022 (USD Million)
Figure 39 Market, By Bit Size, 2017 vs 2022 (USD Million)
Figure 40 8-Bit Size: Market, By Region, 2017 vs 2022 (USD Million)
Figure 41 16-Bit Size: Market, By Region, 2017 vs 2022 (USD Million)
Figure 42 32-Bit Size: Market, By Region, 2017 vs 2022 (USD Million)
Figure 43 Market, By Connectivity, 2017 vs 2022 (USD Million)
Figure 44 Vehicle to Vehicle (V2V) Connectivity: Market, By Region, 2017 vs 2022 (USD Million)
Figure 45 V2I Connectivity: Market, By Region, 2017 vs 2022 (USD Million)
Figure 46 V2C Connectivity: Market, By Region, 2017 vs 2022 (USD Million)
Figure 47 Market, By Technology, 2017 vs 2022 (USD Million)
Figure 48 Park Assist System: Market, By Region, 2017 vs 2022 (USD Million)
Figure 49 Blind Spot Detection: Market, By Region, 2017 vs 2021 (USD Million)
Figure 50 ACC: Market, By Region, 2017 vs 2022 (USD Million)
Figure 51 TPMS: Market, By Region, 2017 vs 2022 (USD Million)
Figure 52 Global Market, By EV, 2017 vs 2022 (USD Thousand)
Figure 53 BEV: Market, By Region, 2017 vs 2022 (USD Thousand)
Figure 54 HEV: Market, By Region, 2017 vs 2022 (USD Thousand)
Figure 55 PHEV: Market, By Region, 2017 vs 2022 (USD Thousand)
Figure 56 FCEV: Market, By Region, 2017 vs 2022 (USD Thousand)
Figure 57 Market, By Vehicle, 2017 vs 2022 (USD Million)
Figure 58 Passenger Car: Market, By Region, 2017 vs 2022 (USD Million)
Figure 59 Commercial Vehicle: Market, By Region, 2017 vs 2022 (USD Million)
Figure 60 Market Size: China to Record the Highest CAGR, By Value, 2017-2022
Figure 61 APAC: Market: Regional Snapshot
Figure 62 European: Market Size: Germany to Hold Largest Share, 2017-2022 (USD Million)
Figure 63 North American: Market: Regional Snapshot
Figure 64 Latin America: Market Size, 2017 vs 2022 (USD Million)
Figure 65 RoW: Market Size, 2017 vs 2022 (USD Million)
Figure 66 Analog Devices: Company Snapshot
Figure 67 Cypress Semiconductor Corporation: Company Snapshot
Figure 68 Infineon Technologies: Company Snapshot
Figure 69 Microchip Technology: Company Snapshot
Figure 70 NXP Semiconductors: Company Snapshot
Figure 71 On Semiconductor: Company Snapshot
Figure 72 Renesas Electronics: Company Snapshot
Figure 73 Rohm Semiconductor: Company Snapshot
Figure 74 Stmicroelectronics: Company Snapshot
Figure 75 Texas Instruments Incorporated: Company Snapshot
Figure 76 Toshiba Corporation: Company Snapshot
Figure 77 Maxim Integrated: Company Snapshot


Growth opportunities and latent adjacency in Automotive Microcontrollers Market