Automotive Differential Market

Automotive Differential Market by Type (Open, Locking, Limited Slip, Electronic Limited Slip, Torque-Vectoring), Drive Type (FWD, RWD, 4WD/AWD), OE Component, On- & Off-Highway Vehicle, Electric Vehicle, Aftermarket & Region - Global Forecast to 2027

Report Code: AT 6535 Nov, 2022, by marketsandmarkets.com

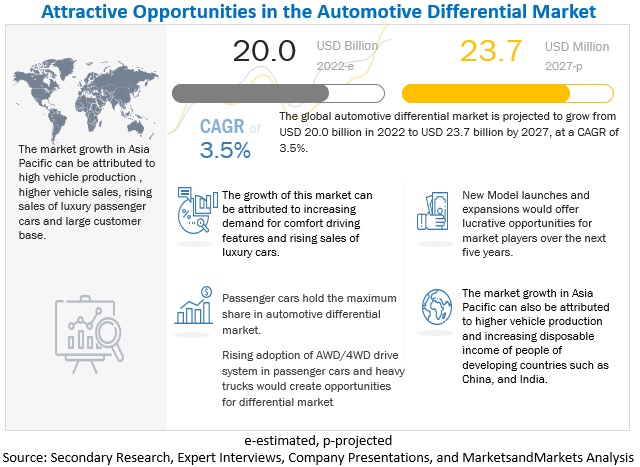
The global automotive differential market was valued at $20.0 billion in 2022 and is expected to reach $23.7 billion by 2027 at a CAGR of 3.5 % during the forecast period 2022-2027. The growth of the automotive differential market includes the advanced comfort and automatic safety features premium SUVs offer and the benefits like better maneuverability, larger space, and better comfort compared with sedans, which are drawing the consumer inclination towards SUVs in developing and developed countries. On the other hand, as heavy-duty engine demand is growing in construction and infrastructure projects, there is a tremendous growth opportunity for the differential in the heavy trucks segment. Rising farm mechanization level leads to agricultural tractors, rapid urbanization, and growing e-commerce and logistics activities boosted the forklift market. Subsequently, growth in these off-highway vehicles would bring immense growth potential to the differential manufacturers for this segment
Automotive Differential Market

To know about the assumptions considered for the study, Request for Free Sample Report

Automotive Differential Market Dynamics

DRIVER: The rising in demand for commercial and Heavy-Duty Vehicles

The demand for heavy commercial and light commercial vehicles has increased globally in recent years due to increased logistics and transportation activities, industrialization, rising e-commerce demand, and the growing economic growth of developed and developing countries. Asia Pacific dominates the heavy trucks market contributing around ~79% of total global demand. The growth is mainly driven by rising industrialization, infrastructure development, and manufacturing growth in these countries, and demand is expected to remain strong in the future. The demand for light commercial vehicles and heavy trucks is expected to increase, ultimately creating the demand for the automotive differential in the coming years.

Most heavy trucks are rear-wheel drives, and in some models, it comes with all-wheel drive/4WD drive options such as 4x4, 6x4, 8x4, 8x6, etc. The differentials in commercial vehicles are always fitted on live/drive axles. Hence, the number of drive axles is directly proportional to the number of differentials used in vehicles. FWD and RWD require one differential, whereas, in all-wheel drive/ 4-wheel drive, there is a requirement of 2-3 differential owing to the high number of live axles. Commercial vehicle manufacturers such as Volvo Trucks, EZ Trac, and Tata Motors are producing 4WD and AWD heavy commercial vehicles. Some heavy commercial trucks with AWD/4WD systems are Tata Novus, Volvo FMX, and Freightliner M2.

Thus, demand for automotive differentials would simultaneously increase with the growing market of heavy trucks with AWD/4WD systems across all regions. This will create an opportunity for the automotive differential in the heavy-duty commercial vehicle segment.

RESTRAINT: Rise in demand for electric passenger cars and commercial vehicles

Electric vehicles use differentials that are different from the traditional mechanical differential used in traditional ICE vehicles as these are heavy-weight and unsuitable for EVs. Usually, automatic limited-slip, automatic locking, and electronically selectable locking differentials are used in electric vehicles. These differentials work with command signals from the steering wheel, throttle position, and motor speed. This helps supply each wheel with desired torque to provide adequate power. Thus, rising EV adoption may negatively impact the market growth of traditional differential suppliers for ICE vehicles.

OPPORTUNITY: Advancement in differential technology

The rise in electric and hybrid vehicle sales has created a demand for various electrical components such as electrical differentials, traction motors, electric motors, electric compressors, batteries, power electronics, and e-beam axles. In conventional vehicles, multi-speed transmission is required, whereas, in electric vehicles, single-speed transmission is used. The gearbox transfers the power from the electric motors to the wheels of the electric vehicle. In contrast, the differential used in electric vehicles provides variable torque to rotating wheels at different speeds during turning. Furthermore, the mechanical differential is getting replaced by an electronically controlled differential. Using electronic control unit, an electric limited slip differential can provide sufficient torque to different wheels of vehicles. This system is most suitable in a slippery road where the extra torque is required for the wheels with the most traction. The system offers better handling during high-speed curves and lane changes. For instance, Mitsubishi's Active Center Differential allows drivers to choose specific presets for driving on the road, gravel, and snow. American Axle & Manufacturing offers a portfolio of TracRite differentials that help enhance comfort and improve battery electric vehicles' performance, including pickup trucks and SUVs. Other global tier-1 suppliers such as Eaton, Dana Inc. and American Axle have started focusing and developing differentials for electric vehicles. Thus, with increasing electrification of the vehicle, the demand of differentials for electric vehicles would grow rapidly which subsequently lucrative business opportunities for differential suppliers by developing ELSD, automatic locking differentials, and torque-vectoring differentials etc. for the OEMs.

CHALLENGE: Presence of local and Regional Suppliers.

Established and prominent players such as Eaton Plc, Dana Inc., American Axle & Manufacturing Company, Linamar Corporation, and GKN driveline offer a wide range of differential products and other driveline components for the OE market. These companies are actively looking after sales service support for this product. With rise in passenger cars and heavy commercial vehicles the opportunity of automotive differential would also increase.

In addition to these established players some local and regional players such as Amtech International, Auburn Gear, and PowerTrax are also operating in automotive differential components for passenger cars, commercial vehicles, and buses. These local and regional players mainly focus on aftermarket demand of automotive differential, creating competition for established companies. Local or regional players offer differential and its component at a lower cost than well-established players, creating a challenge for developed/well-established companies. Similarly, increasing adoption of electric vehicles will replace the mechanical or traditional differential by electrical differential, which will impact the revenue of companies who manufacture mechanical differential for ICE vehicles.

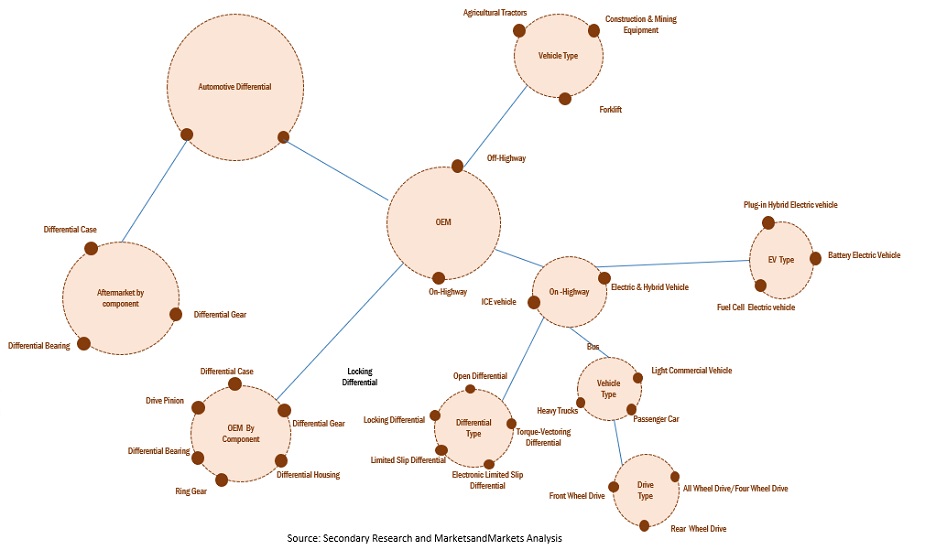
Automotive Differential Market Ecosystem
Automotive Differential Market Size, and Share

To know about the assumptions considered for the study, download the pdf brochure

The heavy trucks segment is estimated to be the fastest-growing segment during the forecast period

Heavy Trucks are projected to register the fastest growth rate for automotive differential under the review period. These trucks carry heavy loads and require the best pulling capacity, and the drivers must achieve better control over the vehicle than passenger cars. Differential installed in trucks varies based on trucks' axle configuration, and the number of differentials depends upon the number of live axles in trucks. Due to this, every heavy truck is rear-wheel drive, and most trucks and semi-trailers up to 25-30 tons is a rear-wheel drive configuration. Additionally, few OEMs, such as Freightliner, Acela Truck, Mercedes Benz, Volvo, and MAN Trucks, among others, are offering 4WD/AWD trucks in Europe and North American countries. Hence, rising industrialization and growing e-commerce and logistics activities will boost the heavy trucks and differentials market simultaneously for this segment

The plug-in hybrid vehicle is projected to be the largest segment for the electric & hybrid vehicle differential market

Plug-in hybrid vehicles are estimated to hold the largest share of the electric & hybrid vehicle differential market. The plug-in hybrid fulfills the gap between ICE and electric cars with optimum fuel performance and improved performance with substantial comfort and safety features. Major PHEV manufacturers such as Toyota Motor Corporation (Japan), Volkswagen AG (Germany), Mercedes-Benz (Germany), BMW Group (Germany), Mitsubishi Motors (Japan), BYD Company Ltd. (China), Li Auto (China), have launched several plug-in hybrid SUVs that have a high demand in the market. Toyota RAV4 was the best-selling PHEV outside China, followed by Mitsubishi Outlander in 2021. These plug-in hybrid SUVs and premium cars are RWD or AWD/4WD and are usually installed with open differentials and have an installation rate of ELSD and torque vectoring differentials. The RAV4 Hybrid and 2019 Prius AWD are some models equipped with an advanced AWD-i system to secure handling in slippery conditions. Thus, with the expected upcoming PHEVs promised by leading European and American OEMs, the market for differentials from PHEVs is expected to boost.

Differentials for the Two-wheel drive segment is expected to be the largest in the Tractor differential market

Two-wheel drive tractors lead the differential market for this segment owing to the high demand of small tractors in major countries, China, India, and the USA. These countries have small farming land and lower mechanization rates, especially in China and India, due to which two-wheel drive tractors are highly preferred. Two-wheel drive tractors are installed with a single unit of differential. With lack of skilled farm labor, increasing labor costs, and a rising need for operational efficiency and profitability are expected to drive the differentials in the two-wheel drive tractors segment.

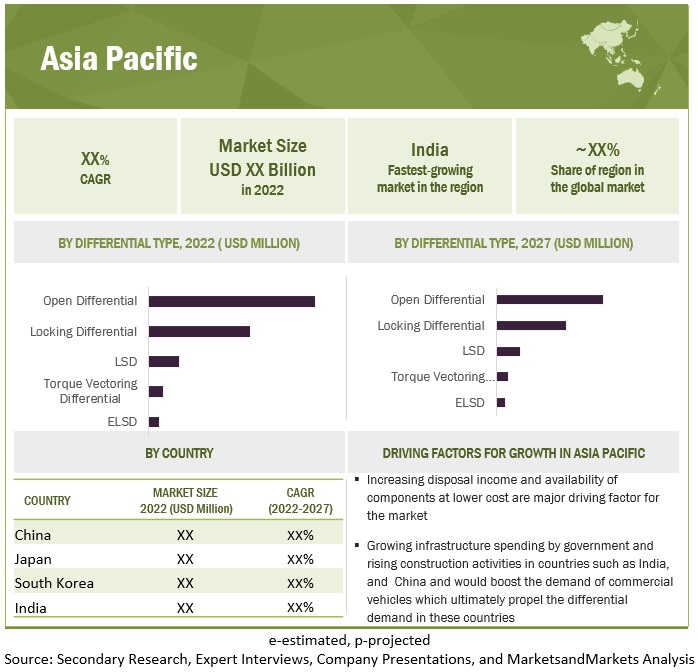
Asia Pacific holds the dominant position in the regional market for automotive differential

The market growth in Asia Pacific countries such as China, Japan, and India can be attributed to the increasing demand for vehicles owing to changing consumer preferences, increasing per capita income of the middle-class population, and cost advantages to global OEMs. Due to the increased vehicle production and sales, China is estimated to be the largest market for automotive differentials. As demand for passenger cars is growing, the consumer preference for comfort and advanced safety features has increased. Further, OEMs in this region offer SUVs and medium to premium range sedan cars at competitive pricing, which resulted in shifting consumer preference towards feature-rich vehicles at a higher price tag. Further, the demand for heavy commercial vehicles has also increased due to increasing government infrastructure spending, growing road, construction, and real estate investments, and increasing e-commerce activities. Thus, rising vehicle production and consumer inclination for advanced safety and comfort features will bring more lucrative growth opportunities for automotive differential market in the coming years.
Automotive Differential Market Size, and Share

Key Market Players

GKN Driveline (UK), Eaton Plc (Ireland), American Axle & Manufacturing Company (US), Dana Incorporation (US), Linamar Corporation (Canada) and BorgWarner Inc. (US). These companies adopted new product launches and expansion to gain traction in the automotive differential market

Want to explore hidden markets that can drive new revenue in Automotive Differential Market?

Scope of the Report

Report Metric

Details

Market Revenue in 2022

USD 20.0 billion

Estimated Value by 2027

USD 23.7 billion

Growth Rate

Poised to grow at a CAGR of 3.5%

Market Segmentation

By Differential Type (ICE), By Drive Type (ICE), By Vehicle Type (ICE), By Component (OE & Aftermarket), Electric & Hybrid Vehicle (By Differential Type & EV Type), Off-Highway, By Equipment Type and Region

Market Driver

The rising in demand for commercial and Heavy-Duty Vehicles

Market Opportunity

Advancement in differential technology

Geographies covered

Asia Pacific, Europe, North America, and ROW

This report categorizes the automotive differential market based on Differential Type, Drive Type, Vehicle Type, Component, Electric & Hybrid Vehicle differential By Differential Type, Component (Aftermarket), Off-highway differential market By Equipment Type, and Region.

By Differential Type (ICE)
  • Open
  • Locking
  • Limited Slip
  • Electronic Limited Slip
  • and Torque-Vectoring
By Drive Type
  • Front Wheel Drive
  • Rear Wheel Drive
  • and All Wheel Drive/ 4 Wheel Drive
By Vehicle Type (ICE)
  • Passenger Car
  • LCV, Truck
  •  
  • and Buses
By Component (OE)
  • Pinion Gear
  • Side Gear
  • Ring Gear
  • Differential Housing
  • and Differential Bearing
Electric & Hybrid Vehicle differential, By Differential Type
  • Open
  • Locking
  •  
  • Limited Slip
  •  
  • Electronic Limited Slip
  • and Torque-Vectoring
By Electric & Hybrid Vehicle differential, By EV Type
  • PHEV
  •  
  • and FCEV
By Component (Aftermarket)
  • Differential Bearings
  • Differential Gears
  • Differential Gaskets
  • and Differential Seals
  •  
Off-highway differential market, By Equipment Type
  • Agricultural Tractors
  • and Forklift
By Region
  • Asia Pacific
  • Europe
  • North America
  • and ROW

Recent Developments

  • In June 2022, the company planned to supply electric drive unit to Mercedes-AMG GT 63 S E Performance. The AAM’s electric drive unit provides superior vehicle performance in a compact, power dense design. Innovative design of electric drive unit includes an electromechanical actuated two-speed gearbox and electromechanical controlled limited slip differential (eLSD) providing shifting time and traction.
  • In January 2022, Dana Inc. launched new planetary drives with improved torque density, design flexibility for wide range of wheeled, tracked, and winch application. These new planetary drives could be configured with Dana TM4 electric motors for wide range of conventional and electrified machines such as crawler cranes, pilling rings, drill rings, and track tool carriers.
  • In August 2021, Eaton launched extensive line up of specialized differentials for electrified vehicles with comparable performance to traditional internal combustion engine (ICE) vehicles. Eaton launched full range of differentials for electrified including automatic limited-slip, automatic locking, and electronic selectable locking differentials.
  • In July 2021, GKN Automotive increased the effort to develop e-Drive technologies in response to the rapidly increasing global demand for electrified vehicles. Future eDrive technologies, using 800V technology, promise many benefits for EV owners including faster charging times and superior performance.
  • In July 2021, Eaton Vehicle group launched aftermarket Elocker differential for Jeep Wrangler and Gladiator JT equipped with both manual and automatic transmissions. The electric locking differentials are a dependable option for the off-road enthusiast, needing just one wire to actuate and requiring no additional components such as airlines and compressors.
  • In August 2020, Eaton introduced an electronically controlled, scalable limited-slip differential that functions across multiple vehicle platforms to enhance performance and ensure driver safety.
  • In February 2020, GKN has developed the two-speed transmission and torque vectoring system for model Jeep Renegade, the ‘GTD19’ demonstrator has undergone extensive testing program in Arieplog, Sweden, and showcased how automakers can use drivetrain innovations to achieve industry-leading standards of efficiency, safety, and driving dynamics in BEV models.

Frequently Asked Questions (FAQ):

To speak to our analyst for a discussion on the above findings, click Speak to Analyst


Exclusive indicates content/data unique to MarketsandMarkets and not available with any competitors.

TABLE OF CONTENTS
 
1 INTRODUCTION (Page No. - 42)
    1.1 STUDY OBJECTIVES 
    1.2 MARKET DEFINITION 
    1.3 INCLUSIONS & EXCLUSIONS 
           TABLE 1 AUTOMOTIVE DIFFERENTIAL MARKET: INCLUSIONS & EXCLUSIONS
    1.4 MARKET SCOPE 
           1.4.1 MARKETS COVERED
                    FIGURE 1 MARKET SEGMENTATION
           1.4.2 YEARS CONSIDERED
    1.5 CURRENCY CONSIDERED 
    1.6 SUMMARY OF CHANGES 
    1.7 LIMITATIONS 
    1.8 STAKEHOLDERS 
 
2 RESEARCH METHODOLOGY (Page No. - 49)
    2.1 RESEARCH DATA 
           FIGURE 2 RESEARCH DESIGN – AUTOMOTIVE DIFFERENTIAL MARKET
           FIGURE 3 RESEARCH METHODOLOGY MODEL
           2.1.1 SECONDARY DATA
                    2.1.1.1 Key secondary sources for vehicle production and electric vehicle sales
                    2.1.1.2 Key secondary sources for market sizing
                    2.1.1.3 Key data from secondary sources
           2.1.2 PRIMARY DATA
                    FIGURE 4 BREAKDOWN OF PRIMARY INTERVIEWS
                    2.1.2.1 Sampling techniques & data collection methods
                    2.1.2.2 Primary participants
    2.2 MARKET SIZE ESTIMATION 
           FIGURE 5 RESEARCH METHODOLOGY: HYPOTHESIS BUILDING
           2.2.1 BOTTOM-UP APPROACH
                    FIGURE 6 AUTOMOTIVE DIFFERENTIAL MARKET: BOTTOM-UP APPROACH
           2.2.2 FACTOR ANALYSIS FOR MARKET SIZING: DEMAND AND SUPPLY SIDES
    2.3 MARKET BREAKDOWN & DATA TRIANGULATION 
    2.4 FACTOR ANALYSIS 
    2.5 ASSUMPTIONS AND ASSOCIATED RISKS 
           2.5.1 RESEARCH ASSUMPTIONS
           2.5.2 MARKET ASSUMPTIONS
                    TABLE 2 ASSUMPTIONS, ASSOCIATED RISKS, AND IMPACT
    2.6 LIMITATIONS 
 
3 EXECUTIVE SUMMARY (Page No. - 64)
    FIGURE 7 AUTOMOTIVE DIFFERENTIAL MARKET: MARKET OUTLOOK 
    FIGURE 8 MARKET, BY REGION, 2022 VS. 2027 (USD MILLION) 
 
4 PREMIUM INSIGHTS (Page No. - 67)
    4.1 ATTRACTIVE OPPORTUNITIES FOR PLAYERS IN AUTOMOTIVE DIFFERENTIAL MARKET 
           FIGURE 9 INCREASE IN DEMAND FOR SUV AND LUXURY VEHICLES TO DRIVE MARKET
    4.2 MARKET, BY REGION (ICE) 
           FIGURE 10 ASIA PACIFIC TO DOMINATE MARKET
    4.3 MARKET, BY DIFFERENTIAL TYPE (ICE) 
           FIGURE 11 OPEN DIFFERENTIALS SEGMENT TO ACCOUNT FOR LARGEST MARKET SHARE
    4.4 MARKET, BY DRIVE TYPE (ICE) 
           FIGURE 12 AWD/4WD DRIVE SEGMENT TO HOLD LARGEST MARKET SHARE DURING FORECAST PERIOD
    4.5 MARKET, BY VEHICLE TYPE (ICE) 
           FIGURE 13 PASSENGER CARS SEGMENT TO DOMINATE DURING FORECAST PERIOD
    4.6 ELECTRIC & HYBRID VEHICLE DIFFERENTIAL MARKET, BY VEHICLE TYPE 
           FIGURE 14 PHEV SEGMENT TO BE LARGEST MARKET
    4.7 ELECTRIC & HYBRID DIFFERENTIAL MARKET, BY DIFFERENTIAL TYPE 
           FIGURE 15 ELSD SEGMENT TO RECORD HIGHEST CAGR DURING FORECAST PERIOD
    4.8 AUTOMOTIVE DIFFERENTIAL OE MARKET, BY COMPONENT (ICE) 
           FIGURE 16 PINION GEARS SEGMENT TO HOLD LARGEST MARKET SHARE DURING FORECAST PERIOD
    4.9 AUTOMOTIVE DIFFERENTIAL AFTERMARKET, BY COMPONENT (ICE) 
           FIGURE 17 DIFFERENTIAL BEARINGS TO DOMINATE MARKET DURING FORECAST PERIOD
    4.10 AGRICULTURAL TRACTORS DIFFERENTIAL MARKET, BY DRIVE TYPE (ICE) 
           FIGURE 18 2WD DRIVE TRACTORS TO HOLD LARGEST MARKET SHARE DURING FORECAST PERIOD
    4.11 OFF-HIGHWAY DIFFERENTIAL MARKET, BY EQUIPMENT TYPE (ICE) 
                    FIGURE 19 AGRICULTURAL TRACTORS TO ACCOUNT FOR LARGER MARKET SHARE DURING FORECAST PERIOD
    4.12 MARKET, BY REGION (ICE) 
                    FIGURE 20 ASIA PACIFIC TO LEAD MARKET DURING FORECAST PERIOD
 
5 MARKET OVERVIEW (Page No. - 74)
    5.1 INTRODUCTION 
    5.2 MARKET DYNAMICS 
           FIGURE 21 AUTOMOTIVE DIFFERENTIAL MARKET: MARKET DYNAMICS
           5.2.1 DRIVERS
                    5.2.1.1 Rising demand for commercial and heavy-duty vehicles
                               FIGURE 22 HEAVY TRUCKS PRODUCTION, 2018–2021 (UNITS)
                    5.2.1.2 Increased investment in infrastructure to boost demand for construction & mining equipment
                               FIGURE 23 CONSTRUCTION EQUIPMENT SALES, 2018–2025 (UNITS)
                               FIGURE 24 MINING EQUIPMENT SALES, 2018–2025 (UNITS)
                    5.2.1.3 Growing penetration of all-wheel drive (AWD) and four-wheel drive (4WD) vehicles
                               FIGURE 25 LCV: DRIVETRAIN INSTALLATION RATE (BY DRIVE TYPE), 2014–2021
                               FIGURE 26 HCV: DRIVETRAIN INSTALLATION RATE (BY DRIVE TYPE), 2014–2021
                    5.2.1.4 Rising preference for luxury vehicles and SUVs
                               TABLE 3 KEY OEMS OFFERING SUVS WITH AWD & 4WD SYSTEMS
           5.2.2 RESTRAINTS
                    5.2.2.1 Growing demand for electric passenger and commercial vehicles
           5.2.3 OPPORTUNITIES
                    5.2.3.1 Advancements in differential technology
           5.2.4 CHALLENGES
                    5.2.4.1 Presence of local and regional suppliers
    5.3 TRENDS/DISRUPTIONS IMPACTING BUYERS 
           FIGURE 27 TRENDS/DISRUPTIONS IMPACTING BUYERS
    5.4 MARKET SCENARIO 
           FIGURE 28 MARKET SCENARIO, 2018–2027 (USD MILLION)
           5.4.1 REALISTIC SCENARIO
                    TABLE 4 MARKET (REALISTIC SCENARIO), BY REGION, 2018–2027 (USD MILLION)
           5.4.2 LOW IMPACT SCENARIO
                    TABLE 5 MARKET (LOW IMPACT SCENARIO), BY REGION, 2018–2027 (USD MILLION)
           5.4.3 HIGH IMPACT SCENARIO
                    TABLE 6 MARKET (HIGH IMPACT SCENARIO), BY REGION, 2018–2027 (USD MILLION)
    5.5 PORTER'S FIVE FORCES ANALYSIS 
           FIGURE 29 PORTER'S FIVE FORCES ANALYSIS: ESTABLISHED GLOBAL PLAYERS INCREASE COMPETITION
           5.5.1 PORTER'S FIVE FORCES ANALYSIS
           5.5.2 THREAT OF SUBSTITUTES
           5.5.3 THREAT OF NEW ENTRANTS
           5.5.4 BARGAINING POWER OF BUYERS
           5.5.5 BARGAINING POWER OF SUPPLIERS
           5.5.6 INTENSITY OF COMPETITIVE RIVALRY
    5.6 AUTOMOTIVE DIFFERENTIAL ECOSYSTEM 
           FIGURE 30 MARKET ECOSYSTEM
           TABLE 7 MARKET: ROLE OF COMPANIES IN ECOSYSTEM
    5.7 SUPPLY CHAIN ANALYSIS 
           FIGURE 31 SUPPLY CHAIN ANALYSIS: MARKET
    5.8 PRICING ANALYSIS 
           5.8.1 BY TYPE AND REGION (USD/UNIT), 2021
    5.9 CASE STUDY ANALYSIS 
           5.9.1 GKN AUTOMOTIVE AND PORSCHE ENGINEERING DEVELOP NEW METAL AM FOR E-DRIVE APPLICATION
           5.9.2 GKN AUTOMOTIVE AND ROMAX CONSULTING DESIGN HIGH-EFFICIENCY E-DRIVE SYSTEM
    5.10 IMPORT & EXPORT DATA 
           5.10.1 IMPORT DATA
                    5.10.1.1 US
                               TABLE 8 US: DIFFERENTIAL IMPORTS SHARE, BY COUNTRY (VALUE %)
                    5.10.1.2 Mexico
                               TABLE 9 MEXICO: DIFFERENTIAL IMPORTS SHARE, BY COUNTRY (VALUE %)
                    5.10.1.3 China
                               TABLE 10 CHINA: DIFFERENTIAL IMPORTS SHARE, BY COUNTRY (VALUE %)
                    5.10.1.4 Japan
                               TABLE 11 JAPAN: DIFFERENTIAL IMPORTS SHARE, BY COUNTRY (VALUE %)
                    5.10.1.5 India
                               TABLE 12 INDIA: DIFFERENTIAL IMPORTS SHARE, BY COUNTRY (VALUE %)
                    5.10.1.6 Germany
                               TABLE 13 GERMANY: DIFFERENTIAL IMPORTS SHARE, BY COUNTRY (VALUE %)
                    5.10.1.7 France
                               TABLE 14 FRANCE: DIFFERENTIAL IMPORTS SHARE, BY COUNTRY (VALUE %)
                    5.10.1.8 Spain
                               TABLE 15 SPAIN: DIFFERENTIAL IMPORTS SHARE, BY COUNTRY (VALUE %)
           5.10.2 EXPORT DATA
                    5.10.2.1 US
                               TABLE 16 US: DIFFERENTIAL EXPORTS SHARE, BY COUNTRY (VALUE %)
                    5.10.2.2 Mexico
                               TABLE 17 MEXICO: DIFFERENTIAL EXPORTS SHARE, BY COUNTRY (VALUE %)
                    5.10.2.3 China
                               TABLE 18 CHINA: DIFFERENTIAL EXPORTS SHARE, BY COUNTRY (VALUE %)
                    5.10.2.4 Japan
                               TABLE 19 JAPAN: DIFFERENTIAL EXPORTS SHARE, BY COUNTRY (VALUE %)
                    5.10.2.5 India
                               TABLE 20 INDIA: DIFFERENTIAL EXPORTS SHARE, BY COUNTRY (VALUE %)
                    5.10.2.6 Germany
                               TABLE 21 GERMANY: DIFFERENTIAL EXPORTS SHARE, BY COUNTRY (VALUE %)
                    5.10.2.7 France
                               TABLE 22 FRANCE: DIFFERENTIAL EXPORTS SHARE, BY COUNTRY (VALUE %)
                    5.10.2.8 Spain
                               TABLE 23 SPAIN: DIFFERENTIAL EXPORTS SHARE, BY COUNTRY (VALUE %)
    5.11 KEY CONFERENCES AND EVENTS, 2022–2023 
           5.11.1 AUTOMOTIVE DIFFERENTIAL MARKET: UPCOMING CONFERENCES AND EVENTS
    5.12 PATENT ANALYSIS 
           5.12.1 APPLICATIONS AND PATENTS GRANTED, 2019–2022
    5.13 BUYING CRITERIA 
                    FIGURE 32 KEY BUYING CRITERIA FOR ICE AND ELECTRIC & HYBRID VEHICLES
                    TABLE 24 KEY BUYING CRITERIA FOR ICE AND ELECTRIC & HYBRID VEHICLES
    5.14 REGULATORY ANALYSIS 
                    TABLE 25 DIFFERENTIAL/4WD/AWD REGULATIONS, BY REGION
           5.14.1 EMISSION REGULATIONS
                    5.14.1.1 On-road vehicles
                               TABLE 26 EURO-5 VS. EURO-6 VEHICLE EMISSION STANDARDS FOR NEW EUROPEAN DRIVING CYCLE
                               TABLE 27 ON-ROAD VEHICLE EMISSION REGULATION OUTLOOK FOR PASSENGER CARS, 2016–2021
    5.15 TECHNOLOGY ANALYSIS 
           5.15.1 DEVELOPMENT OF ELECTRONIC DIFFERENTIALS FOR ELECTRIC VEHICLES
           5.15.2 DEVELOPMENT OF ELECTRONICALLY ACTIVATED CLUTCHES TO COMPRESS PLATES AND LOCK DIFFERENTIAL
 
6 AUTOMOTIVE DIFFERENTIAL MARKET (ICE), BY DIFFERENTIAL TYPE (Page No. - 106)
    6.1 INTRODUCTION 
           6.1.1 RESEARCH METHODOLOGY
           6.1.2 ASSUMPTIONS
           6.1.3 INDUSTRY INSIGHTS: ICE VEHICLES, BY DIFFERENTIAL TYPE
                    FIGURE 33 AUTOMOTIVE DIFFERENTIAL MARKET (ICE), BY DIFFERENTIAL TYPE, 2022 VS. 2027 (USD MILLION)
                    TABLE 28 MARKET (ICE), BY DIFFERENTIAL TYPE, 2018–2021 (‘000 UNITS)
                    TABLE 29 MARKET (ICE), BY DIFFERENTIAL TYPE, 2022–2027 (‘000 UNITS)
                    TABLE 30 MARKET (ICE), BY DIFFERENTIAL TYPE, 2018–2021 (USD MILLION)
                    TABLE 31 MARKET (ICE), BY DIFFERENTIAL TYPE, 2022–2027 (USD MILLION)
    6.2 ELECTRONIC LIMITED SLIP DIFFERENTIALS 
           TABLE 32 ELSD MARKET, BY REGION, 2018–2021 (‘000 UNITS)
           TABLE 33 ELSD MARKET, BY REGION, 2022–2027 (‘000 UNITS)
           TABLE 34 ELSD MARKET, BY REGION, 2018–2021 (MILLION USD)
           TABLE 35 ELSD MARKET, BY REGION, 2022–2027 (MILLION USD)
    6.3 LOCKING DIFFERENTIALS 
           TABLE 36 LOCKING DIFFERENTIALS MARKET, BY REGION, 2018–2021 (‘000 UNITS)
           TABLE 37 LOCKING DIFFERENTIALS MARKET, BY REGION, 2022–2027 (‘000 UNITS)
           TABLE 38 LOCKING DIFFERENTIALS MARKET, BY REGION, 2018–2021 (USD MILLION)
           TABLE 39 LOCKING DIFFERENTIALS MARKET, BY REGION, 2022–2027 (USD MILLION)
    6.4 LIMITED SLIP DIFFERENTIALS 
           TABLE 40 LIMITED SLIP DIFFERENTIALS MARKET, BY REGION, 2018–2021 (‘000 UNITS)
           TABLE 41 LIMITED SLIP DIFFERENTIALS MARKET, BY REGION, 2022–2027 (‘000 UNITS)
           TABLE 42 LIMITED SLIP DIFFERENTIALS MARKET, BY REGION, 2018–2021 (USD MILLION)
           TABLE 43 LIMITED SLIP DIFFERENTIALS MARKET, BY REGION, 2022–2027 (USD MILLION)
    6.5 OPEN DIFFERENTIALS 
           TABLE 44 OPEN DIFFERENTIALS MARKET, BY REGION, 2018–2021 (‘000 UNITS)
           TABLE 45 OPEN DIFFERENTIALS MARKET, BY REGION, 2022–2027 (‘000 UNITS)
           TABLE 46 OPEN DIFFERENTIALS MARKET, BY REGION, 2018–2021 (USD MILLION)
           TABLE 47 OPEN DIFFERENTIALS MARKET, BY REGION, 2022–2027 (USD MILLION)
    6.6 TORQUE VECTORING DIFFERENTIALS 
           TABLE 48 TORQUE VECTORING DIFFERENTIALS MARKET, BY REGION, 2018–2021 (‘000 UNITS)
           TABLE 49 TORQUE VECTORING DIFFERENTIALS MARKET, BY REGION, 2022–2027 (‘000 UNITS)
           TABLE 50 TORQUE VECTORING DIFFERENTIALS MARKET, BY REGION, 2018–2021 (USD MILLION)
           TABLE 51 TORQUE VECTORING DIFFERENTIALS MARKET, BY REGION, 2022–2027 (USD MILLION)
 
7 AUTOMOTIVE DIFFERENTIAL MARKET (ICE), BY DRIVE TYPE (Page No. - 119)
    7.1 INTRODUCTION 
           7.1.1 RESEARCH METHODOLOGY
           7.1.2 ASSUMPTIONS
           7.1.3 INDUSTRY INSIGHTS: ICE VEHICLES, BY DRIVE TYPE
                    FIGURE 34 AUTOMOTIVE DIFFERENTIAL MARKET (ICE), BY DRIVE TYPE, 2022 VS. 2027 (USD MILLION)
                    TABLE 52 MARKET (ICE), BY DRIVE TYPE, 2018–2021 (‘000 UNITS)
                    TABLE 53 MARKET (ICE), BY DRIVE TYPE, 2022–2027 (‘000 UNITS)
                    TABLE 54 MARKET (ICE), BY DRIVE TYPE, 2018–2021 (USD MILLION)
                    TABLE 55 MARKET (ICE), BY DRIVE TYPE, 2022–2027 (USD MILLION)
    7.2 FRONT-WHEEL DRIVE 
           TABLE 56 FWD: MARKET (ICE), BY REGION, 2018–2021 (‘000 UNITS)
           TABLE 57 FWD: MARKET (ICE), BY REGION, 2022–2027 (‘000 UNITS)
           TABLE 58 FWD: MARKET (ICE), BY REGION, 2018–2021 (USD MILLION)
           TABLE 59 FWD: MARKET (ICE), BY REGION, 2022–2027 (USD MILLION)
    7.3 REAR-WHEEL DRIVE 
           TABLE 60 RWD: MARKET (ICE), BY REGION, 2018–2021 (‘000 UNITS)
           TABLE 61 RWD: MARKET (ICE), BY REGION, 2022–2027 (‘000 UNITS)
           TABLE 62 RWD: MARKET (ICE), BY REGION, 2018–2021 (USD MILLION)
           TABLE 63 RWD: MARKET (ICE), BY REGION, 2022–2027 (USD MILLION)
    7.4 ALL-WHEEL DRIVE/FOUR-WHEEL DRIVE (AWD/4WD) 
           TABLE 64 AWD/4WD: MARKET (ICE), BY REGION, 2018–2021 (‘000 UNITS)
           TABLE 65 AWD/4WD: MARKET (ICE), BY REGION, 2022–2027 (‘000 UNITS)
           TABLE 66 AWD/4WD: MARKET (ICE), BY REGION, 2018–2021 (USD MILLION)
           TABLE 67 AWD/4WD: MARKET (ICE), BY REGION, 2022–2027 (USD MILLION)
 
8 AUTOMOTIVE DIFFERENTIAL MARKET (ICE), BY VEHICLE TYPE (Page No. - 127)
    8.1 INTRODUCTION 
           8.1.1 RESEARCH METHODOLOGY
           8.1.2 ASSUMPTIONS
           8.1.3 INDUSTRY INSIGHTS: BY VEHICLE TYPE (ICE)
                    FIGURE 35 MARKET (ICE), BY VEHICLE TYPE, 2022 VS. 2027 (USD MILLION)
                    TABLE 68 MARKET (ICE), BY VEHICLE TYPE, 2018–2021 (‘000 UNITS)
                    TABLE 69 MARKET (ICE), BY VEHICLE TYPE, 2022–2027 (‘000 UNITS)
                    TABLE 70 MARKET (ICE), BY VEHICLE TYPE, 2018–2021 (USD MILLION)
                    TABLE 71 MARKET (ICE), BY VEHICLE TYPE, 2022–2027 (USD MILLION)
    8.2 PASSENGER CARS 
           TABLE 72 PASSENGER CARS MARKET (ICE), BY REGION, 2018–2021 (‘000 UNITS)
           TABLE 73 PASSENGER CARS MARKET (ICE), BY REGION, 2022–2027 (‘000 UNITS)
           TABLE 74 PASSENGER CARS MARKET (ICE), 2018–2021 (USD MILLION)
           TABLE 75 PASSENGER CARS MARKET (ICE), BY REGION, 2022–2027 (USD MILLION)
    8.3 LIGHT COMMERCIAL VEHICLES (LCV) 
           TABLE 76 LIGHT COMMERCIAL VEHICLES MARKET (ICE), BY REGION, 2018–2021 (‘000 UNITS)
           TABLE 77 LIGHT COMMERCIAL VEHICLES MARKET (ICE), BY REGION, 2022–2027 (‘000 UNITS)
           TABLE 78 LIGHT COMMERCIAL VEHICLES MARKET (ICE), BY REGION, 2018–2021 (USD MILLION)
           TABLE 79 LIGHT COMMERCIAL VEHICLES MARKET (ICE), BY REGION, 2022–2027 (USD MILLION)
    8.4 TRUCKS 
           TABLE 80 TRUCKS DIFFERENTIAL MARKET (ICE), BY REGION, 2018–2021 (‘000 UNITS)
           TABLE 81 TRUCKS DIFFERENTIAL MARKET (ICE), BY REGION, 2022–2027 (‘000 UNITS)
           TABLE 82 TRUCKS DIFFERENTIAL MARKET (ICE), BY REGION, 2018–2021 (USD MILLION)
           TABLE 83 TRUCKS MARKET (ICE), BY REGION, 2022–2027 (USD MILLION)
    8.5 BUSES 
           TABLE 84 BUSES DIFFERENTIAL MARKET (ICE), BY REGION, 2018–2021 (‘000 UNITS)
           TABLE 85 BUSES DIFFERENTIAL MARKET (ICE), BY REGION, 2022–2027 (‘000 UNITS)
           TABLE 86 BUSES DIFFERENTIAL MARKET (ICE), BY REGION, 2018–2021 (USD MILLION)
           TABLE 87 BUSES DIFFERENTIAL MARKET (ICE), BY REGION, 2022–2027 (USD MILLION)
 
9 ELECTRIC & HYBRID VEHICLE DIFFERENTIAL MARKET, BY VEHICLE TYPE (Page No. - 138)
    9.1 INTRODUCTION 
           9.1.1 RESEARCH METHODOLOGY
           9.1.2 ASSUMPTIONS
           9.1.3 INDUSTRY INSIGHTS: ELECTRIC & HYBRID VEHICLES, BY VEHICLE TYPE
                    FIGURE 36 ELECTRIC & HYBRID VEHICLE DIFFERENTIAL MARKET, BY VEHICLE TYPE, 2022 VS. 2027 (USD MILLION)
                    TABLE 88 ELECTRIC & HYBRID VEHICLE DIFFERENTIAL MARKET, BY VEHICLE TYPE, 2018–2021 (‘000 UNITS)
                    TABLE 89 ELECTRIC & HYBRID VEHICLE DIFFERENTIAL MARKET, BY VEHICLE TYPE, 2022–2027 (‘000 UNITS)
                    TABLE 90 ELECTRIC & HYBRID VEHICLE DIFFERENTIAL MARKET, BY VEHICLE TYPE, 2018–2021 (USD MILLION)
                    TABLE 91 ELECTRIC & HYBRID VEHICLE DIFFERENTIAL MARKET, BY VEHICLE TYPE, 2022–2027 (USD MILLION)
    9.2 PLUG-IN HYBRID ELECTRIC VEHICLES (PHEV) 
           9.2.1 GOVERNMENT SUBSIDIES AND INVESTMENTS IN CHARGING INFRASTRUCTURE TO DRIVE SEGMENT
                    TABLE 92 PHEV DIFFERENTIAL MARKET, BY REGION, 2018–2021 (‘000 UNITS)
                    TABLE 93 PHEV DIFFERENTIAL MARKET, BY REGION, 2022–2027 (‘000 UNITS)
                    TABLE 94 PHEV DIFFERENTIAL MARKET, BY REGION, 2018–2021 (USD MILLION)
                    TABLE 95 PHEV DIFFERENTIAL MARKET, BY REGION, 2022–2027 (USD MILLION)
    9.3 FUEL CELL ELECTRIC VEHICLES (FCEV) 
           9.3.1 ENVIRONMENT-FRIENDLY PROPERTIES TO DRIVE DEMAND
                    TABLE 96 FCEV DIFFERENTIAL MARKET, BY REGION, 2018–2021 (‘000 UNITS)
                    TABLE 97 FCEV DIFFERENTIAL MARKET, BY REGION, 2022–2027 (‘000 UNITS)
                    TABLE 98 FCEV DIFFERENTIAL MARKET, BY REGION, 2018–2021 (USD MILLION)
                    TABLE 99 FCEV DIFFERENTIAL MARKET, BY REGION, 2022–2027 (USD MILLION)
 
10 ELECTRIC & HYBRID VEHICLE DIFFERENTIAL MARKET, BY DIFFERENTIAL TYPE (Page No. - 145)
     10.1 INTRODUCTION 
             10.1.1 RESEARCH METHODOLOGY
             10.1.2 ASSUMPTIONS
             10.1.3 INDUSTRY INSIGHTS: ELECTRIC & HYBRID VEHICLES, BY DIFFERENTIAL TYPE
                       FIGURE 37 ELECTRIC & HYBRID VEHICLE DIFFERENTIAL MARKET, BY DIFFERENTIAL TYPE, 2022 VS. 2027 (USD MILLION)
                       TABLE 100 ELECTRIC & HYBRID VEHICLE DIFFERENTIAL MARKET, BY DIFFERENTIAL TYPE, 2018–2021 (‘000 UNITS)
                       TABLE 101 ELECTRIC & HYBRID VEHICLE DIFFERENTIAL MARKET, BY DIFFERENTIAL TYPE, 2022–2027 (‘000 UNITS)
                       TABLE 102 ELECTRIC & HYBRID VEHICLE DIFFERENTIAL MARKET, BY DIFFERENTIAL TYPE, 2018–2021 (USD MILLION)
                       TABLE 103 ELECTRIC & HYBRID VEHICLE DIFFERENTIAL MARKET, BY DIFFERENTIAL TYPE, 2022–2027 (USD MILLION)
     10.2 ELECTRONIC LIMITED SLIP DIFFERENTIAL 
               TABLE 104 ELSD: ELECTRIC & HYBRID VEHICLE DIFFERENTIAL MARKET, BY REGION, 2018–2021 (‘000 UNITS)
               TABLE 105 ELSD: ELECTRIC & HYBRID VEHICLE DIFFERENTIAL MARKET, BY REGION, 2022–2027 (‘000 UNITS)
               TABLE 106 ELSD: ELECTRIC & HYBRID VEHICLE DIFFERENTIAL MARKET, BY REGION, 2018–2021 (USD MILLION)
               TABLE 107 ELSD: ELECTRIC & HYBRID VEHICLE DIFFERENTIAL MARKET, BY REGION, 2022–2027 (USD MILLION)
     10.3 LOCKING DIFFERENTIALS 
               TABLE 108 LOCKING DIFFERENTIALS: ELECTRIC & HYBRID VEHICLE DIFFERENTIAL MARKET, BY REGION, 2018–2021 (‘000 UNITS)
               TABLE 109 LOCKING DIFFERENTIALS: ELECTRIC & HYBRID VEHICLE DIFFERENTIAL MARKET, BY REGION, 2022–2027 (‘000 UNITS)
               TABLE 110 LOCKING DIFFERENTIALS: ELECTRIC & HYBRID VEHICLE DIFFERENTIAL MARKET, BY REGION, 2018–2021 (USD MILLION)
               TABLE 111 LOCKING DIFFERENTIALS: ELECTRIC & HYBRID VEHICLE DIFFERENTIAL MARKET, BY REGION, 2022–2027 (USD MILLION)
     10.4 LIMITED SLIP DIFFERENTIALS 
               TABLE 112 LIMITED SLIP DIFFERENTIALS: ELECTRIC & HYBRID VEHICLE DIFFERENTIAL MARKET, BY REGION, 2018–2021 (‘000 UNITS)
               TABLE 113 LIMITED SLIP DIFFERENTIALS: ELECTRIC & HYBRID VEHICLE DIFFERENTIAL MARKET, BY REGION, 2022–2027 (‘000 UNITS)
               TABLE 114 LIMITED SLIP DIFFERENTIALS: ELECTRIC & HYBRID VEHICLE DIFFERENTIAL MARKET, BY REGION, 2018–2021 (USD MILLION)
               TABLE 115 LIMITED SLIP DIFFERENTIALS: ELECTRIC & HYBRID VEHICLE DIFFERENTIAL MARKET, BY REGION, 2022–2027 (USD MILLION)
     10.5 OPEN DIFFERENTIALS 
               TABLE 116 OPEN DIFFERENTIALS: ELECTRIC & HYBRID VEHICLE DIFFERENTIAL MARKET, BY REGION, 2018–2021 (‘000 UNITS)
               TABLE 117 OPEN DIFFERENTIALS: ELECTRIC & HYBRID VEHICLE DIFFERENTIAL MARKET, BY REGION, 2022–2027 (‘000 UNITS)
               TABLE 118 OPEN DIFFERENTIALS: ELECTRIC & HYBRID VEHICLE DIFFERENTIAL MARKET, BY REGION, 2018–2021 (USD MILLION)
               TABLE 119 OPEN DIFFERENTIALS: ELECTRIC & HYBRID VEHICLE DIFFERENTIAL MARKET, BY REGION, 2022–2027 (USD MILLION)
     10.6 TORQUE VECTORING DIFFERENTIALS 
               TABLE 120 TORQUE VECTORING DIFFERENTIALS: ELECTRIC & HYBRID VEHICLE DIFFERENTIAL MARKET, BY REGION, 2018–2021 (‘000 UNITS)
               TABLE 121 TORQUE VECTORING DIFFERENTIALS: ELECTRIC & HYBRID VEHICLE DIFFERENTIAL MARKET, BY REGION, 2022–2027 (‘000 UNITS)
               TABLE 122 TORQUE VECTORING DIFFERENTIALS: ELECTRIC & HYBRID VEHICLE DIFFERENTIAL MARKET, BY REGION, 2018–2021 (USD MILLION)
               TABLE 123 TORQUE VECTORING DIFFERENTIALS: ELECTRIC & HYBRID VEHICLE DIFFERENTIAL MARKET, BY REGION, 2022–2027 (USD MILLION)
 
11 AUTOMOTIVE DIFFERENTIAL MARKET (ICE), BY COMPONENT (Page No. - 156)
     11.1 INTRODUCTION 
             11.1.1 RESEARCH METHODOLOGY
             11.1.2 ASSUMPTIONS
             11.1.3 INDUSTRY INSIGHTS: OE BY COMPONENT TYPE
                       FIGURE 38 AUTOMOTIVE DIFFERENTIAL MARKET (ICE), BY COMPONENT TYPE, 2022 VS. 2027 (USD MILLION)
                       TABLE 124 MARKET (ICE), BY COMPONENT TYPE, 2018–2021 (‘000 UNITS)
                       TABLE 125 MARKET (ICE), BY COMPONENT TYPE, 2022–2027 (‘000 UNITS)
                       TABLE 126 MARKET (ICE), BY COMPONENT TYPE, 2018–2021 (USD MILLION)
                       TABLE 127 MARKET (ICE), BY COMPONENT TYPE, 2022–2027 (USD MILLION)
     11.2 PINION GEARS 
               TABLE 128 PINION GEARS: MARKET (ICE), BY REGION, 2018–2021 (‘000 UNITS)
               TABLE 129 PINION GEARS: MARKET (ICE), BY REGION, 2022–2027 (‘000 UNITS)
               TABLE 130 PINION GEARS: MARKET (ICE), BY REGION, 2018–2021 (USD MILLION)
               TABLE 131 PINION GEARS: MARKET (ICE), BY REGION, 2022–2027 (USD MILLION)
     11.3 DIFFERENTIAL HOUSINGS 
               TABLE 132 DIFFERENTIAL HOUSINGS: MARKET (ICE), BY REGION, 2018–2021 (‘000 UNITS)
               TABLE 133 DIFFERENTIAL HOUSINGS: MARKET (ICE), BY REGION, 2022–2027 (‘000 UNITS)
               TABLE 134 DIFFERENTIAL HOUSINGS: MARKET (ICE), BY REGION, 2018–2021 (USD MILLION)
               TABLE 135 DIFFERENTIAL HOUSINGS: MARKET (ICE), BY REGION, 2022–2027 (USD MILLION)
     11.4 SIDE GEARS 
               TABLE 136 SIDE GEARS: MARKET (ICE), BY REGION, 2018–2021 (‘000 UNITS)
               TABLE 137 SIDE GEARS: MARKET (ICE), BY REGION, 2022–2027 (‘000 UNITS)
               TABLE 138 SIDE GEARS: MARKET (ICE), BY REGION, 2018–2021 (USD MILLION)
               TABLE 139 SIDE GEARS: MARKET (ICE), BY REGION, 2022–2027 (USD MILLION)
     11.5 RING GEARS 
               TABLE 140 RING GEARS: MARKET (ICE), BY REGION, 2018–2021 (‘000 UNITS)
               TABLE 141 RING GEARS: MARKET (ICE), BY REGION, 2022–2027 (‘000 UNITS)
               TABLE 142 RING GEARS: MARKET (ICE), BY REGION, 2018–2021 (USD MILLION)
               TABLE 143 RING GEARS: MARKET (ICE), BY REGION, 2022–2027 (USD MILLION)
     11.6 DIFFERENTIAL BEARINGS 
               TABLE 144 DIFFERENTIAL BEARINGS: MARKET (ICE), BY REGION, 2018–2021 (‘000 UNITS)
               TABLE 145 DIFFERENTIAL BEARINGS: MARKET (ICE), BY REGION, 2022–2027 (‘000 UNITS)
               TABLE 146 DIFFERENTIAL BEARINGS: MARKET (ICE), BY REGION, 2018–2021 (USD MILLION)
               TABLE 147 DIFFERENTIAL BEARINGS: MARKET (ICE), BY REGION, 2022–2027 (USD MILLION)
 
12 AUTOMOTIVE DIFFERENTIAL AFTERMARKET (ICE), BY COMPONENT (Page No. - 168)
     12.1 INTRODUCTION 
             12.1.1 RESEARCH METHODOLOGY
             12.1.2 ASSUMPTIONS
             12.1.3 INDUSTRY INSIGHTS: AFTERMARKET BY COMPONENT TYPE
                       FIGURE 39 AUTOMOTIVE DIFFERENTIAL AFTERMARKET (ICE), BY COMPONENT TYPE, 2022 VS. 2027 (USD MILLION)
                       TABLE 148 AUTOMOTIVE DIFFERENTIAL AFTERMARKET (ICE), BY COMPONENT TYPE, 2018–2021 (‘000 UNITS)
                       TABLE 149 AUTOMOTIVE DIFFERENTIAL AFTERMARKET (ICE), BY COMPONENT TYPE, 2022–2027 (‘000 UNITS)
                       TABLE 150 AUTOMOTIVE DIFFERENTIAL AFTERMARKET (ICE), BY COMPONENT TYPE, 2018–2021 (USD MILLION)
                       TABLE 151 AUTOMOTIVE DIFFERENTIAL AFTERMARKET (ICE), BY COMPONENT TYPE, 2022–2027 (USD MILLION)
     12.2 DIFFERENTIAL BEARINGS 
               TABLE 152 DIFFERENTIAL BEARINGS AFTERMARKET (ICE), BY REGION, 2018–2021 (‘000 UNITS)
               TABLE 153 DIFFERENTIAL BEARINGS AFTERMARKET (ICE)), BY REGION, 2022–2027 (‘000 UNITS)
               TABLE 154 DIFFERENTIAL BEARINGS AFTERMARKET (ICE), BY REGION, 2018–2021 (USD MILLION)
               TABLE 155 DIFFERENTIAL BEARINGS AFTERMARKET (ICE), BY REGION, 2022–2027 (USD MILLION)
     12.3 DIFFERENTIAL GEARS 
               TABLE 156 DIFFERENTIAL GEARS AFTERMARKET (ICE), BY REGION, 2018–2021 (‘000 UNITS)
               TABLE 157 DIFFERENTIAL GEARS AFTERMARKET (ICE), BY REGION, 2022–2027 (‘000 UNITS)
               TABLE 158 DIFFERENTIAL GEARS AFTERMARKET (ICE), BY REGION, 2018–2021 (USD MILLION)
               TABLE 159 DIFFERENTIAL GEARS AFTERMARKET (ICE), BY REGION, 2022–2027 (USD MILLION)
     12.4 DIFFERENTIAL GASKETS 
               TABLE 160 DIFFERENTIAL GASKETS AFTERMARKET (ICE), BY REGION, 2018–2021 (‘000 UNITS)
               TABLE 161 DIFFERENTIAL GASKETS AFTERMARKET (ICE), BY REGION, 2022–2027 (‘000 UNITS)
               TABLE 162 DIFFERENTIAL GASKETS AFTERMARKET (ICE)), BY REGION, 2018–2021 (USD MILLION)
               TABLE 163 DIFFERENTIAL GASKETS AFTERMARKET (ICE), BY REGION, 2022–2027 (USD MILLION)
     12.5 DIFFERENTIAL SEALS 
               TABLE 164 DIFFERENTIAL SEALS AFTERMARKET (ICE), BY REGION, 2018–2021 (‘000 UNITS)
               TABLE 165 DIFFERENTIAL SEALS AFTERMARKET (ICE), BY REGION, 2022–2027 (‘000 UNITS)
               TABLE 166 DIFFERENTIAL SEALS AFTERMARKET (ICE), BY REGION, 2018–2021 (USD MILLION)
               TABLE 167 DIFFERENTIAL SEALS AFTERMARKET (ICE), BY REGION, 2022–2027 (USD MILLION)
 
13 OFF-HIGHWAY VEHICLE DIFFERENTIAL MARKET, BY EQUIPMENT TYPE (Page No. - 178)
     13.1 INTRODUCTION 
             13.1.1 RESEARCH METHODOLOGY
             13.1.2 ASSUMPTIONS
             13.1.3 INDUSTRY INSIGHTS: OFF-HIGHWAY VEHICLE DIFFERENTIAL MARKET (ICE), BY EQUIPMENT TYPE
                       FIGURE 40 OFF-HIGHWAY VEHICLE DIFFERENTIAL MARKET (ICE), BY EQUIPMENT TYPE, 2022 VS. 2027 (USD MILLION)
                       TABLE 168 OFF-HIGHWAY VEHICLE DIFFERENTIAL MARKET (ICE), BY EQUIPMENT TYPE, 2018–2021 (‘000 UNITS)
                       TABLE 169 OFF-HIGHWAY VEHICLE DIFFERENTIAL MARKET (ICE), BY EQUIPMENT TYPE, 2022–2027 (‘000 UNITS)
                       TABLE 170 OFF-HIGHWAY VEHICLE DIFFERENTIAL MARKET (ICE), BY EQUIPMENT TYPE, 2018–2021 (USD MILLION)
                       TABLE 171 OFF-HIGHWAY VEHICLE DIFFERENTIAL MARKET (ICE), BY EQUIPMENT TYPE, 2022–2027 (USD MILLION)
     13.2 AGRICULTURAL TRACTORS 
               TABLE 172 AGRICULTURAL TRACTORS DIFFERENTIAL MARKET, BY DRIVE TYPE, 2018–2021 (‘000 UNITS)
               TABLE 173 AGRICULTURAL TRACTORS DIFFERENTIAL MARKET, BY DRIVE TYPE, 2022–2027 (‘000 UNITS)
               TABLE 174 AGRICULTURAL TRACTORS DIFFERENTIAL MARKET, BY DRIVE TYPE, 2018–2021 (USD MILLION)
               TABLE 175 AGRICULTURAL TRACTORS DIFFERENTIAL MARKET, BY DRIVE TYPE, 2022–2027 (USD MILLION)
             13.2.1 TWO-WHEEL DRIVE
                       TABLE 176 2WD: AGRICULTURAL TRACTORS DIFFERENTIAL MARKET, BY REGION, 2018–2021 (‘000 UNITS)
                       TABLE 177 2WD: AGRICULTURAL TRACTORS DIFFERENTIAL MARKET, BY REGION, 2022–2027 (‘000 UNITS)
                       TABLE 178 2WD: AGRICULTURAL TRACTORS DIFFERENTIAL MARKET, BY REGION, 2018–2021 (USD MILLION)
                       TABLE 179 2WD: AGRICULTURAL TRACTORS DIFFERENTIAL MARKET, BY REGION, 2022–2027 (USD MILLION)
             13.2.2 FOUR-WHEEL DRIVE
                       TABLE 180 4WD: AGRICULTURAL TRACTORS DIFFERENTIAL MARKET, BY REGION, 2018–2021 (‘000 UNITS)
                       TABLE 181 4WD: AGRICULTURAL TRACTORS DIFFERENTIAL MARKET, BY REGION, 2022–2027 (‘000 UNITS)
                       TABLE 182 4WD: AGRICULTURAL TRACTORS DIFFERENTIAL MARKET, BY REGION, 2018–2021 (USD MILLION)
                       TABLE 183 4WD: AGRICULTURAL TRACTORS DIFFERENTIAL MARKET, BY REGION, 2022–2027 (USD MILLION)
     13.3 FORKLIFTS 
               TABLE 184 FORKLIFTS DIFFERENTIAL MARKET (ICE), BY REGION, 2018–2021 (‘000 UNITS)
               TABLE 185 FORKLIFTS DIFFERENTIAL MARKET (ICE), BY REGION, 2022–2027 (‘000 UNITS)
               TABLE 186 FORKLIFTS DIFFERENTIAL MARKET (ICE), BY REGION, 2018–2021 (USD MILLION)
               TABLE 187 FORKLIFTS DIFFERENTIAL MARKET (ICE), BY REGION, 2022–2027 (USD MILLION)
 
14 AUTOMOTIVE DIFFERENTIAL MARKET, BY REGION (Page No. - 188)
     14.1 INTRODUCTION 
             14.1.1 RESEARCH METHODOLOGY
             14.1.2 ASSUMPTIONS
             14.1.3 INDUSTRY INSIGHTS: DIFFERENTIAL MARKET, BY DIFFERENTIAL TYPE
                       FIGURE 41 MARKET, 2022 VS. 2027 (USD MILLION)
                       TABLE 188 MARKET, BY REGION, 2018–2021 (‘000 UNITS)
                       TABLE 189 MARKET, BY REGION, 2022–2027 (‘000 UNITS)
                       TABLE 190 MARKET, BY REGION, 2018–2021 (USD MILLION)
                       TABLE 191 MARKET, BY REGION, 2022–2027 (USD MILLION)
     14.2 ASIA PACIFIC 
               FIGURE 42 ASIA PACIFIC: MARKET SNAPSHOT
               TABLE 192 ASIA PACIFIC: MARKET, BY COUNTRY, 2018–2021 (‘000 UNITS)
               TABLE 193 ASIA PACIFIC: MARKET, BY COUNTRY, 2022–2027 (‘000 UNITS)
               TABLE 194 ASIA PACIFIC: MARKET, BY COUNTRY, 2018–2021 (USD MILLION)
               TABLE 195 ASIA PACIFIC: MARKET, BY COUNTRY, 2022–2027 (USD MILLION)
             14.2.1 CHINA
                       14.2.1.1 Booming passenger vehicle demand to fuel market
                                   TABLE 196 CHINA: MARKET, BY DIFFERENTIAL TYPE, 2018–2021 (‘000 UNITS)
                                   TABLE 197 CHINA: MARKET, BY DIFFERENTIAL TYPE, 2022–2027 (‘000 UNITS)
                                   TABLE 198 CHINA: MARKET, BY DIFFERENTIAL TYPE, 2018–2021 (USD MILLION)
                                   TABLE 199 CHINA: MARKET, BY DIFFERENTIAL TYPE, 2022–2027 (USD MILLION)
             14.2.2 INDIA
                       14.2.2.1 Growth in vehicle sales to create opportunity for market
                                   TABLE 200 INDIA: MARKET, BY DIFFERENTIAL TYPE, 2018–2021 (‘000 UNITS)
                                   TABLE 201 INDIA: MARKET, BY DIFFERENTIAL TYPE, 2022–2027 (‘000 UNITS)
                                   TABLE 202 INDIA: MARKET, BY DIFFERENTIAL TYPE, 2018–2021 (USD MILLION)
                                   TABLE 203 INDIA: MARKET, BY DIFFERENTIAL TYPE, 2022–2027 (USD MILLION)
             14.2.3 JAPAN
                       14.2.3.1 Growing use of technologically-advanced differentials to impact market
                                   TABLE 204 JAPAN: MARKET, BY DIFFERENTIAL TYPE, 2018–2021 (‘000 UNITS)
                                   TABLE 205 JAPAN: MARKET, BY DIFFERENTIAL TYPE, 2022–2027 (‘000 UNITS)
                                   TABLE 206 JAPAN: MARKET, BY DIFFERENTIAL TYPE, 2018–2021 (USD MILLION)
                                   TABLE 207 JAPAN: MARKET, BY DIFFERENTIAL TYPE, 2022–2027 (USD MILLION)
             14.2.4 SOUTH KOREA
                       14.2.4.1 Demand for luxury cars to propel market
                                   TABLE 208 SOUTH KOREA: MARKET, BY DIFFERENTIAL TYPE, 2018–2021 (‘000 UNITS)
                                   TABLE 209 SOUTH KOREA: MARKET, BY DIFFERENTIAL TYPE, 2022–2027 (‘000 UNITS)
                                   TABLE 210 SOUTH KOREA: MARKET, BY DIFFERENTIAL TYPE, 2018–2021 (USD MILLION)
                                   TABLE 211 SOUTH KOREA: MARKET, BY DIFFERENTIAL TYPE, 2022–2027 (USD MILLION)
             14.2.5 THAILAND
                       14.2.5.1 Rising demand for automotive components to boost market
                                   TABLE 212 THAILAND: MARKET, BY DIFFERENTIAL TYPE, 2018–2021 (‘000 UNITS)
                                   TABLE 213 THAILAND: MARKET, BY DIFFERENTIAL TYPE, 2022–2027 (‘000 UNITS)
                                   TABLE 214 THAILAND: MARKET, BY DIFFERENTIAL TYPE, 2018–2021 (USD MILLION)
                                   TABLE 215 THAILAND: MARKET, BY DIFFERENTIAL TYPE, 2022–2027 (USD MILLION)
             14.2.6 REST OF ASIA PACIFIC
                       TABLE 216 REST OF ASIA PACIFIC: MARKET, BY DIFFERENTIAL TYPE, 2018–2021 (‘000 UNITS)
                       TABLE 217 REST OF ASIA PACIFIC: MARKET, BY DIFFERENTIAL TYPE, 2022–2027 (‘000 UNITS)
                       TABLE 218 REST OF ASIA PACIFIC: MARKET, BY DIFFERENTIAL TYPE, 2018–2021 (USD MILLION)
                       TABLE 219 REST OF ASIA PACIFIC: MARKET, BY APPLICATION, 2022–2027 (USD MILLION)
     14.3 EUROPE 
               FIGURE 43 EUROPE: MARKET, 2022–2027 (USD MILLION)
               TABLE 220 EUROPE: MARKET, BY COUNTRY, 2018–2021 (‘000 UNITS)
               TABLE 221 EUROPE: MARKET, BY COUNTRY, 2022–2027 (‘000 UNITS)
               TABLE 222 EUROPE: MARKET, BY COUNTRY, 2018–2021 (USD MILLION)
               TABLE 223 EUROPE: MARKET, BY COUNTRY, 2022–2027 (USD MILLION)
             14.3.1 GERMANY
                       14.3.1.1 High demand for premium cars to drive market
                                   TABLE 224 GERMANY: MARKET, BY DIFFERENTIAL TYPE, 2018–2021 (‘000 UNITS)
                                   TABLE 225 GERMANY: MARKET, BY DIFFERENTIAL TYPE, 2022–2027 (‘000 UNITS)
                                   TABLE 226 GERMANY: MARKET, BY DIFFERENTIAL TYPE, 2018–2021 (USD MILLION)
                                   TABLE 227 GERMANY: MARKET, BY DIFFERENTIAL TYPE, 2022–2027 (USD MILLION)
             14.3.2 FRANCE
                       14.3.2.1 Increase in production of hybrid vehicles to propel market
                                   TABLE 228 FRANCE: MARKET, BY DIFFERENTIAL TYPE, 2018–2021 (‘000 UNITS)
                                   TABLE 229 FRANCE: MARKET, BY DIFFERENTIAL TYPE, 2022–2027 (‘000 UNITS)
                                   TABLE 230 FRANCE: MARKET, BY DIFFERENTIAL TYPE, 2018–2021 (USD MILLION)
                                   TABLE 231 FRANCE: MARKET, BY DIFFERENTIAL TYPE, 2022–2027 (USD MILLION)
             14.3.3 UK
                       14.3.3.1 Rising sales of AWD/4WD vehicles to drive market
                                   TABLE 232 UK: MARKET, BY DIFFERENTIAL TYPE, 2018–2021 (‘000 UNITS)
                                   TABLE 233 UK: MARKET, BY DIFFERENTIAL TYPE, 2022–2027 (‘000 UNITS)
                                   TABLE 234 UK: MARKET, BY DIFFERENTIAL TYPE, 2018–2021 (USD MILLION)
                                   TABLE 235 UK: MARKET, BY DIFFERENTIAL TYPE, 2022–2027 (USD MILLION)
             14.3.4 SPAIN
                       14.3.4.1 Increased production of passenger cars to create higher requirement for differentials
                                   TABLE 236 SPAIN: MARKET, BY DIFFERENTIAL TYPE, 2018–2021 (‘000 UNITS)
                                   TABLE 237 SPAIN: MARKET, BY DIFFERENTIAL TYPE, 2022–2027 (‘000 UNITS)
                                   TABLE 238 SPAIN: MARKET, BY DIFFERENTIAL TYPE, 2018–2021 (USD MILLION)
                                   TABLE 239 SPAIN: MARKET, BY DIFFERENTIAL TYPE, 2022–2027 (USD MILLION)
             14.3.5 TURKEY
                       14.3.5.1 Rising focus on exports to drive market
                                   TABLE 240 TURKEY: MARKET, BY DIFFERENTIAL TYPE, 2018–2021 (‘000 UNITS)
                                   TABLE 241 TURKEY: MARKET, BY DIFFERENTIAL TYPE, 2022–2027 (‘000 UNITS)
                                   TABLE 242 TURKEY: MARKET, BY DIFFERENTIAL TYPE, 2018–2021 (USD MILLION)
                                   TABLE 243 TURKEY: MARKET, BY DIFFERENTIAL TYPE, 2022–2027 (USD MILLION)
             14.3.6 RUSSIA
                       14.3.6.1 Increasing sales of passenger cars to bolster market
                                   TABLE 244 RUSSIA: MARKET, BY DIFFERENTIAL TYPE, 2018–2021 (‘000 UNITS)
                                   TABLE 245 RUSSIA: MARKET, BY DIFFERENTIAL TYPE, 2022–2027 (‘000 UNITS)
                                   TABLE 246 RUSSIA: MARKET, BY DIFFERENTIAL TYPE, 2018–2021 (USD MILLION)
                                   TABLE 247 RUSSIA: MARKET, BY DIFFERENTIAL TYPE, 2022–2027 (USD MILLION)
             14.3.7 REST OF EUROPE
                       TABLE 248 REST OF EUROPE: MARKET, BY DIFFERENTIAL TYPE, 2018–2021 (‘000 UNITS)
                       TABLE 249 REST OF EUROPE: MARKET, BY DIFFERENTIAL TYPE, 2022–2027 (‘000 UNITS)
                       TABLE 250 REST OF EUROPE: MARKET, BY DIFFERENTIAL TYPE, 2018–2021 (USD MILLION)
                       TABLE 251 REST OF EUROPE: MARKET, BY DIFFERENTIAL TYPE, 2022–2027 (USD MILLION)
     14.4 NORTH AMERICA 
               FIGURE 44 NORTH AMERICAN: AUTOMOTIVE DIFFERENTIAL MARKET SNAPSHOT
               TABLE 252 NORTH AMERICA: MARKET, BY COUNTRY, 2018–2021 (‘000 UNITS)
               TABLE 253 NORTH AMERICA: MARKET, BY COUNTRY, 2022–2027 (‘000 UNITS)
               TABLE 254 NORTH AMERICA: MARKET, BY COUNTRY, 2018–2021 (USD MILLION)
               TABLE 255 NORTH AMERICA: MARKET, BY COUNTRY, 2022–2027 (USD MILLION)
             14.4.1 US
                       14.4.1.1 Increasing production of SUVs and luxury vehicles to drive market
                                   TABLE 256 US: MARKET, BY DIFFERENTIAL TYPE, 2018–2021 (‘000 UNITS)
                                   TABLE 257 US: MARKET, BY DIFFERENTIAL TYPE, 2022–2027 (‘000 UNITS)
                                   TABLE 258 US: MARKET, BY DIFFERENTIAL TYPE, 2018–2021 (USD MILLION)
                                   TABLE 259 US: MARKET, BY DIFFERENTIAL TYPE, 2022–2027 (USD MILLION)
             14.4.2 CANADA
                       14.4.2.1 Rising automotive vehicle production to drive market
                                   TABLE 260 CANADA: MARKET, BY DIFFERENTIAL TYPE, 2018–2021 (‘000 UNITS)
                                   TABLE 261 CANADA: MARKET, BY DIFFERENTIAL TYPE, 2022–2027 (‘000 UNITS)
                                   TABLE 262 CANADA: MARKET, BY DIFFERENTIAL TYPE, 2018–2021 (USD MILLION)
                                   TABLE 263 CANADA: MARKET, BY DIFFERENTIAL TYPE, 2022–2027 (USD MILLION)
             14.4.3 MEXICO
                       14.4.3.1 Growing demand for advanced differential types to drive market
                                   TABLE 264 MEXICO: MARKET, BY DIFFERENTIAL TYPE, 2018–2021 (‘000 UNITS)
                                   TABLE 265 MEXICO: MARKET, BY DIFFERENTIAL TYPE, 2022–2027 (‘000 UNITS)
                                   TABLE 266 MEXICO: MARKET, BY DIFFERENTIAL TYPE, 2018–2021 (USD MILLION)
                                   TABLE 267 MEXICO: MARKET, BY DIFFERENTIAL TYPE, 2022–2027 (USD MILLION)
     14.5 ROW 
               FIGURE 45 ROW: MARKET, 2021–2026 (USD MILLION)
               TABLE 268 ROW: MARKET, BY COUNTRY, 2018–2021 (‘000 UNITS)
               TABLE 269 ROW: MARKET, BY COUNTRY, 2022–2027 (‘000 UNITS)
               TABLE 270 ROW: MARKET, BY COUNTRY, 2018–2021 (USD MILLION)
               TABLE 271 ROW: MARKET, BY COUNTRY, BY COUNTRY, 2022–2027 (USD MILLION)
             14.5.1 IRAN
                       14.5.1.1 Heavy investments in automotive sector to impact market
                                   TABLE 272 IRAN: MARKET, BY DIFFERENTIAL TYPE, 2018–2021 (‘000 UNITS)
                                   TABLE 273 IRAN: MARKET, BY DIFFERENTIAL TYPE, 2022–2027 (‘000 UNITS)
                                   TABLE 274 IRAN: MARKET, BY DIFFERENTIAL TYPE, 2018–2021 (USD MILLION)
                                   TABLE 275 IRAN: MARKET, BY DIFFERENTIAL TYPE, 2022–2027 (USD MILLION)
             14.5.2 BRAZIL
                       14.5.2.1 Presence of major automotive companies to drive market
                                   TABLE 276 BRAZIL: MARKET, BY DIFFERENTIAL TYPE, 2018–2021 (‘000 UNITS)
                                   TABLE 277 BRAZIL: MARKET, BY DIFFERENTIAL TYPE, 2022–2027 (‘000 UNITS)
                                   TABLE 278 BRAZIL: MARKET, BY DIFFERENTIAL TYPE, 2018–2021 (USD MILLION)
                                   TABLE 279 BRAZIL: MARKET, BY DIFFERENTIAL TYPE, 2022–2027 (USD MILLION)
             14.5.3 REST OF ROW
                       TABLE 280 REST OF WORLD: MARKET, BY DIFFERENTIAL TYPE, 2018–2021 (‘000 UNITS)
                       TABLE 281 REST OF WORLD: MARKET, BY DIFFERENTIAL TYPE, 2022–2027 (‘000 UNITS)
                       TABLE 282 REST OF WORLD: MARKET, BY DIFFERENTIAL TYPE, 2018–2021 (USD MILLION)
                       TABLE 283 REST OF WORLD: MARKET, BY DIFFERENTIAL TYPE, 2022–2027 (USD MILLION)
 
15 RECOMMENDATIONS BY MARKETSANDMARKETS (Page No. - 234)
     15.1 ASIA PACIFIC TO BE KEY MARKET FOR AUTOMOTIVE DIFFERENTIALS 
     15.2 ELECTRONIC LIMITED SLIP DIFFERENTIALS TO GAIN TRACTION 
     15.3 CONCLUSION 
 
16 COMPETITIVE LANDSCAPE (Page No. - 235)
     16.1 OVERVIEW 
     16.2 MARKET SHARE ANALYSIS, 2021 
               TABLE 284 MARKET SHARE ANALYSIS FOR AUTOMOTIVE DIFFERENTIAL MARKET, 2021
               FIGURE 46 MARKET SHARE ANALYSIS, 2021
     16.3 REVENUE ANALYSIS OF TOP LISTED/PUBLIC PLAYERS 
     16.4 COMPETITIVE EVALUATION QUADRANT 
             16.4.1 TERMINOLOGY
             16.4.2 STARS
             16.4.3 EMERGING LEADERS
             16.4.4 PERVASIVE PLAYERS
             16.4.5 PARTICIPANTS
                       TABLE 285 MARKET: COMPANY PRODUCT FOOTPRINT, 2021
                       TABLE 286 MARKET: COMPANY APPLICATION FOOTPRINT, 2021
                       TABLE 287 MARKET: COMPANY REGION FOOTPRINT, 2021
                       FIGURE 47 AUTOMOTIVE DIFFERENTIAL MANUFACTURERS: COMPETITIVE EVALUATION MATRIX, 2021
     16.5 COMPETITIVE SCENARIO 
             16.5.1 PRODUCT LAUNCHES
                       TABLE 288 PRODUCT LAUNCHES, 2018–2022
             16.5.2 DEALS
                       TABLE 289 DEALS, 2018–2022
             16.5.3 EXPANSIONS
                       TABLE 290 EXPANSIONS, 2018–2022
     16.6 STRATEGIES ADOPTED BY KEY PLAYERS/RIGHT TO WIN, 2018–2022 
               TABLE 291 KEY GROWTH STRATEGIES, 2018–2022
     16.7 COMPETITIVE BENCHMARKING 
               TABLE 292 AUTOMOTIVE DIFFERENTIAL MARKET: KEY PLAYERS
 
17 COMPANY PROFILES (Page No. - 255)
(Business overview, Products offered, Recent Developments, MNM view)*
     17.1 AUTOMOTIVE DIFFERENTIAL MARKET - KEY PLAYERS 
             17.1.1 GKN AUTOMOTIVE
                       TABLE 293 GKN AUTOMOTIVE: BUSINESS OVERVIEW
                       FIGURE 48 GKN AUTOMOTIVE: COMPANY SNAPSHOT
                       TABLE 294 GKN AUTOMOTIVE: PRODUCT LAUNCHES
                       TABLE 295 GKN AUTOMOTIVE: DEALS
                       TABLE 296 GKN AUTOMOTIVE: EXPANSIONS
             17.1.2 EATON CORPORATION PLC
                       TABLE 297 EATON CORPORATION PLC: BUSINESS OVERVIEW
                       FIGURE 49 EATON CORPORATION PLC: COMPANY SNAPSHOT
                       TABLE 298 EATON CORPORATION PLC: PRODUCT LAUNCHES
                       TABLE 299 EATON CORPORATION PLC: DEALS
                       TABLE 300 EATON CORPORATION PLC: EXPANSIONS
             17.1.3 AMERICAN AXLE & MANUFACTURING, INC.
                       TABLE 301 AMERICAN AXLE & MANUFACTURING, INC.: BUSINESS OVERVIEW
                       FIGURE 50 AMERICAN AXLE & MANUFACTURING, INC.: COMPANY SNAPSHOT
                       TABLE 302 AMERICAN AXLE & MANUFACTURING, INC.: PRODUCT LAUNCHES
                       TABLE 303 AMERICAN AXLE & MANUFACTURING, INC.: DEALS
                       TABLE 304 AMERICAN AXLE & MANUFACTURING, INC.: EXPANSIONS
             17.1.4 DANA INC.
                       TABLE 305 DANA INC.: BUSINESS OVERVIEW
                       FIGURE 51 DANA INC.: COMPANY SNAPSHOT
                       TABLE 306 DANA INC.: PRODUCT LAUNCHES
                       TABLE 307 DANA INC.: DEALS
                       TABLE 308 DANA INC.: EXPANSIONS
             17.1.5 BORGWARNER INC.
                       TABLE 309 BORGWARNER INC.: BUSINESS OVERVIEW
                       FIGURE 52 BORGWARNER INC.: COMPANY SNAPSHOT
                       TABLE 310 BORGWARNER INC.: DEALS
                       TABLE 311 BORGWARNER INC.: EXPANSIONS
             17.1.6 LINAMAR CORPORATION
                       TABLE 312 LINAMAR CORPORATION: BUSINESS OVERVIEW
                       FIGURE 53 LINAMAR CORPORATION: COMPANY SNAPSHOT
                       TABLE 313 LINAMAR CORPORATION: PRODUCT LAUNCHES
                       TABLE 314 LINAMAR CORPORATION: DEALS
                       TABLE 315 LINAMAR CORPORATION: EXPANSIONS
             17.1.7 SCHAEFFLER AG
                       TABLE 316 SCHAEFFLER AG: BUSINESS OVERVIEW
                       FIGURE 54 SCHAEFFLER AG: COMPANY SNAPSHOT
                       TABLE 317 SCHAEFFLER AG: PRODUCT LAUNCHES
                       TABLE 318 SCHAEFFLER AG: EXPANSIONS
             17.1.8 JTEKT CORPORATION
                       TABLE 319 JTEKT CORPORATION: BUSINESS OVERVIEW
                       FIGURE 55 JTEKT CORPORATION: COMPANY SNAPSHOT
                       TABLE 320 JTEKT CORPORATION: PRODUCT LAUNCHES
                       TABLE 321 JTEKT CORPORATION: DEALS
             17.1.9 HYUNDAI WIA CORPORATION
                       TABLE 322 HYUNDAI WIA CORPORATION: BUSINESS OVERVIEW
                       FIGURE 56 HYUNDAI WIA CORPORATION: COMPANY SNAPSHOT
                       TABLE 323 HYUNDAI WIA CORPORATION: PRODUCT LAUNCHES
             17.1.10 ZF
                       TABLE 324 ZF: BUSINESS OVERVIEW
                       FIGURE 57 ZF: COMPANY SNAPSHOT
                       TABLE 325 ZF: PRODUCT LAUNCHES
     17.2 AUTOMOTIVE DIFFERENTIAL MARKET – ADDITIONAL PLAYERS 
             17.2.1 AUBURN GEAR
                       TABLE 326 AUBURN GEAR: COMPANY OVERVIEW
             17.2.2 NEAPCO HOLDINGS LLC
                       TABLE 327 NEAPCO HOLDINGS LLC: COMPANY OVERVIEW
             17.2.3 MAGNA
                       TABLE 328 MAGNA: COMPANY OVERVIEW
             17.2.4 DREXLER AUTOMOTIVE GMBH
                       TABLE 329 DREXLER AUTOMOTIVE GMBH: COMPANY OVERVIEW
             17.2.5 QUAIFE ENGINEERING LTD
                       TABLE 330 QUAIFE ENGINEERING LTD: COMPANY OVERVIEW
             17.2.6 XTRAC
                       TABLE 331 XTRAC: COMPANY OVERVIEW
             17.2.7 NSK LTD
                       TABLE 332 NSK LTD: COMPANY OVERVIEW
             17.2.8 BHARAT GEARS LTD
                       TABLE 333 BHARAT GEARS LTD: COMPANY OVERVIEW
             17.2.9 CUSCO
                       TABLE 334 CUSCO: COMPANY OVERVIEW
             17.2.10 POWERTRAX
                       TABLE 335 POWERTRAX: COMPANY OVERVIEW
             17.2.11 JIANGSU PACIFIC PRECISION FORGING CO., LTD.
                       TABLE 336 JIANGSU PACIFIC PRECISION FORGING CO., LTD.: COMPANY OVERVIEW
             17.2.12 COMMERCIAL GEAR & SPROCKET COMPANY, INC.
                       TABLE 337 COMMERCIAL GEAR & SPROCKET COMPANY, INC.: COMPANY OVERVIEW
             17.2.13 AMTECH INTERNATIONAL
                       TABLE 338 AMTECH INTERNATIONAL: COMPANY OVERVIEW
             17.2.14 MERITOR INC.
                       TABLE 339 MERITOR INC.: COMPANY OVERVIEW
             17.2.15 SHOWA CORPORATION
                       TABLE 340 SHOWA CORPORATION: COMPANY OVERVIEW
*Details on Business overview, Products offered, Recent Developments, MNM view might not be captured in case of unlisted companies.
 
18 APPENDIX (Page No. - 316)
     18.1 KEY INDUSTRY INSIGHTS 
     18.2 DISCUSSION GUIDE 
     18.3 KNOWLEDGESTORE: MARKETSANDMARKETS’ SUBSCRIPTION PORTAL 
     18.4 CUSTOMIZATION OPTIONS 
             18.4.1 AUTOMOTIVE DIFFERENTIAL MARKET, BY DRIVE TYPE (COUNTRY LEVEL)
                       18.4.1.1 FWD
                       18.4.1.2 RWD
                       18.4.1.3 AWD/4WD
             18.4.2 ELECTRIC & HYBRID VEHICLE DIFFERENTIAL MARKET, BY DIFFERENTIAL TYPE (COUNTRY LEVEL)
                       18.4.2.1 Electronic limited slip differential (ELSD)
                       18.4.2.2 Locking differential
                       18.4.2.3 Limited slip differential (LSD)
                       18.4.2.4 Open differential
                       18.4.2.5 Torque vectoring differential
     18.5 RELATED REPORTS 
     18.6 AUTHOR DETAILS 

The study involves four main activities to estimate the current size of the automotive differential market. Exhaustive secondary research was done to collect information on the market, such as differential type, drive types and differential components. The next step was to validate these findings, assumptions, and market analysis with industry experts across value chains through primary research. Bottom-up approach was employed to estimate the complete market size for different segments considered under this study. Thereafter, market breakdown and data triangulation processes were used to estimate the market size of segments and subsegments.

Secondary Research

Secondary sources referred to in this research study include international automotive differential manufacturer organizations and published articles; corporate filings (such as annual reports, investor presentations, and financial statements); and trade, business, and automotive associations. The secondary data was collected and analyzed to arrive at the overall market size, which is further validated by primary research.

Primary Research

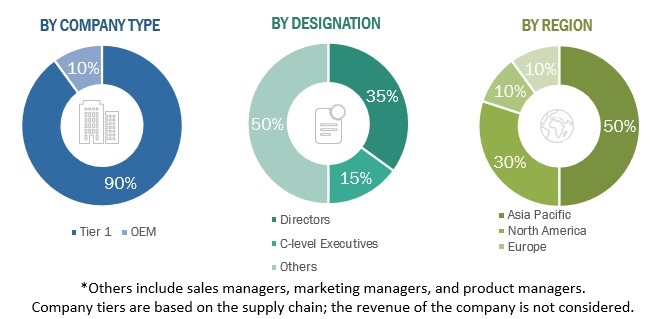
Extensive primary research has been conducted after acquiring an understanding of the automotive differential market scenario through secondary research. Several primary interviews have been conducted with market experts from both the demand- (OEMs) and supply-side (differential manufacturers) across major regions, namely, North America, Europe, Asia Pacific, and Rest of the World. Approximately 10% and 90% of primary interviews have been conducted from the demand and supply sides, respectively. Primary data has been collected through questionnaires, emails, and telephonic interviews. In the canvassing of primaries, we have strived to cover various departments within organizations, such as sales, operations, and marketing, to provide a holistic viewpoint in our report.

After interacting with industry participants, we conducted brief sessions with highly experienced independent consultants to reinforce the findings from our primaries. This, along with the opinions of the in-house subject-matter experts, led us to the findings as described in this report.
Automotive Differential Market Size, and Share

To know about the assumptions considered for the study, download the pdf brochure

Market Size Estimation

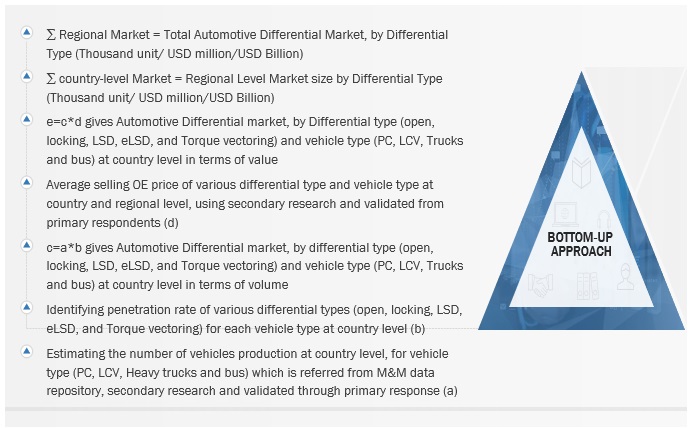
The bottom-up approach has been used to estimate and validate the size of the automotive differential market. The market size, by volume, of the market has been derived by identifying the country-wise usage pattern of front vs. rear vs. of all-wheel drive type as well as share of various type of differentials installed in each vehicle type. This data is mapped for each country under the scope of the study and by vehicle type. The number of units fitted in each country is added to derive the regional market size, in terms of volume. The market size, by value, has been arrived by multiplying the average selling OE price of differential for each vehicle type at country level. Summation of country level market gives regional level and further global market, by differential, vehicle, and drive type in terms of value. Similarly, OE market, by components, hybrid vehicle differential market, by vehicle type and differential type, and aftermarket have been analysed in terms of volume and value

Automotive Differential Market Size: Bottom-Up Approach
Automotive Differential Market Size, and Share

To know about the assumptions considered for the study, Request for Free Sample Report

Report Objectives

  • To define, describe, and forecast the automotive differential market in terms of value (USD billion) and volume (thousand units), based on the following segments:
    • By Differential Type (ICE) (Open, Locking, Limited Slip, Electronic Limited Slip, and Torque-Vectoring)
    • By Drive Type (Front Wheel Drive, Rear Wheel Drive, and All Wheel Drive/ 4 Wheel Drive)
    • By Vehicle Type (ICE) (Passenger Car, LCV, Truck, and Buses)
    • By Component (OE) (Pinion Gear, Side Gear, Ring Gear, Differential Housing, and Differential Bearing)
    • Electric & Hybrid Vehicle differential, By Differential Type (Open, Locking, Limited Slip, Electronic Limited Slip, and Torque-Vectoring)
    • By Electric & Hybrid Vehicle differential, By EV Type (PHEV, and FCEV)
    • By Component (Aftermarket) (Differential Bearings, Differential Gears, Differential Gaskets, and Differential Seals)
    • Off-highway differential market, By Equipment Type (Agricultural Tractors, and Forklift)
    • By Region (Asia Pacific, Europe, North America, and ROW)
  • To understand the market dynamics (drivers, restraints, opportunities, and challenges) of the market
  • To analyze the market ranking and market share of key players operating in the market
  • To understand the dynamics of the market competitors and distinguish them into visionary leaders, innovators, emerging companies, and dynamic differentiators according to their product portfolio strength and business strategies
  • To analyze recent developments, alliances, joint ventures, mergers & acquisitions, new product launches, and other activities carried out by key industry players in the automotive differential market.
  • To conduct case study analysis, Porter’s five forces analysis, technology analysis, patent analysis, average price analysis, and revenue analysis of top 5 players

Available Customizations

Along with the given market data, MarketsandMarkets offers customizations in accordance with the company’s specific needs.

AUTOMOTIVE DIFFERENTIAL MARKET, BY DRIVE TYPE (COUNTRY-LEVEL)

  • FWD
  • RWD
  • AWD/4WD

Note: Asia Pacific: China, India, Japan, South Korea, Thailand, and others; Europe (France, Germany, Russia, Spain, Turkey, the UK, and others); North America (Canada, Mexico, the US) and RoW (Iran, Brazil, and others)

ELECTRIC & HYBRID VEHICLE DIFFERENTIAL MARKET, BY DIFFERENTIAL TYPE (COUNTRY-LEVEL)

  • OPEN DIFFERENTIAL
  • LOCKING DIFFERENTIAL
  • LIMITED SLIP DIFFERENTIAL
  • ELECTRONIC LIMITED SLIP DIFFERENTIAL
  • TORQUE-VECTORING DIFFERENTIAL

Note: Asia Pacific includes China, Japan, India, and South Korea; Europe includes Germany, France, Sweden, Spain, UK, Netherlands, and Norway; North America includes US and Canada)

Custom Market Research Services

We will customize the research for you, in case the report listed above does not meet with your exact requirements. Our custom research will comprehensively cover the business information you require to help you arrive at strategic and profitable business decisions.

Request Customization

Instant Answers with GPT - Ask Now!

Ask real questions. Get complete answers !
Report Code
AT 6535
Published ON
Nov, 2022
Choose License Type
BUY NOW
  • SHARE
X
Request Customization
Speak to Analyst
Speak to Analyst
OR FACE-TO-FACE MEETING
PERSONALIZE THIS RESEARCH
  • Triangulate with your Own Data
  • Get Data as per your Format and Definition
  • Gain a Deeper Dive on a Specific Application, Geography, Customer or Competitor
  • Any level of Personalization
REQUEST A FREE CUSTOMIZATION
LET US HELP YOU!
  • What are the Known and Unknown Adjacencies Impacting the Automotive Differential Market
  • What will your New Revenue Sources be?
  • Who will be your Top Customer; what will make them switch?
  • Defend your Market Share or Win Competitors
  • Get a Scorecard for Target Partners
CUSTOMIZED WORKSHOP REQUEST
knowledgestore logo

Hold On!

Want to explore hidden markets that can drive new revenue in Automotive Differential Market?

Find Hidden Markets
  • Call Us
  • +1-888-600-6441 (Corporate office hours)
  • +1-888-600-6441 (US/Can toll free)
  • +44-800-368-9399 (UK office hours)
CONNECT WITH US
ABOUT TRUST ONLINE
©2024 MarketsandMarkets Research Private Ltd. All rights reserved
DMCA.com Protection Status
Website Feedback