Automotive Connectors Market by Connection Type (Wire to Wire, Wire to Board, Board to Board), Application (Body Control & Interiors, Engine Control & Cooling System), System Type (Sealed, Unsealed), Vehicle Type, and Region - Global Forecast to 2021


The global automotive connectors market size was valued at USD 4.38 billion in 2016 and is expected to reach USD 6.28 billion by 2021 at a CAGR of 7.46% during the forecast period 2016-2021. The report analyzes and forecasts (2016 to 2021) the market size, in terms of volume (million units) and value (USD million), of the market. The report further segments the market and forecasts its size, by volume and value, on the basis of region (Asia-Pacific, Europe, North America, and Rest of the World (RoW). It provides a detailed analysis of various forces acting in the market including the drivers, restraints, opportunities, and challenges. It also segments the market and forecasts its size, by volume and value, on the basis of Connection Type (Wire to Wire Connection, Wire to Board Connection, and Board to Board Connection). Additionally, it segments the market and forecasts its size, by volume and value, on the basis of application (Body Control and Interiors, Safety and Security, Engine Control and Cooling System, Fuel and Emission Control, Infotainment and Others). The report strategically profiles key players and comprehensively analyzes their market shares and core competencies. It also tracks and analyzes competitive developments such as joint ventures, mergers & acquisitions, new product launches, expansions, and other activities carried out by key industry participants.
The research methodology used in the report involves various secondary sources such as Society of Indian Automobile Manufacturers (SIAM), China Association of Automobile Manufacturers (CAAM), Japan Automobile Manufacturers Association (JAMA), and paid databases and directories. Experts from related industries and suppliers have been interviewed to understand the future trends of the market. The bottom-up approach has been used to estimate and validate the size of the global market. The market size, by volume, has been derived by identifying the country-wise production volumes and analyzing the demand trends.
The figure given below illustrates the break-up of the profile of industry experts who participated in primary discussions.
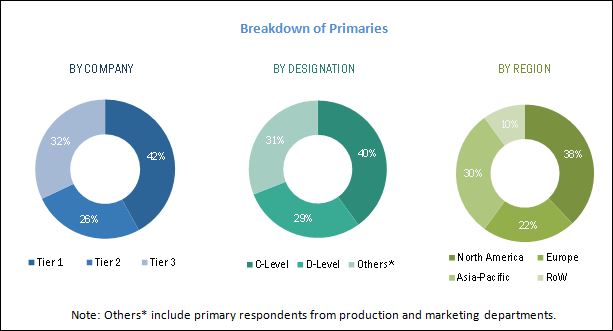
To know about the assumptions considered for the study, download the pdf brochure
The ecosystem of the automotive connectors market consists of manufacturers such as TE Connectivity (Switzerland), Delphi Automotive (U.K.), and Sumitomo Electric (Japan), research institutes such as the Automotive Component Manufacturers Association of India (ACMA), Automotive Research Association of India (ARAI), European Automotive Research Partners Association (EARPA), and the United States Council for Automotive Research (USCAR), and regional automobile associations such as China Association of Automobile Manufacturers (CAAM), Japan Automobile Manufacturers Association (JAMA), and the European Automobile Manufacturers Association (ACEA).
Target Audience
- Connectors Manufacturers
- Automobile Original Equipment Manufacturers (OEMs)
- Automobile Organizations/Associations
- Connectors Suppliers
- Research Institutes
- Raw Material Suppliers for Connectors
- Traders and Distributors of Connectors
- Automotive Wires and Cables Manufacturers
Scope of the Report
Market, By Connection Type
Market, By Application
Market, By System Type
Market, By Vehicle Type
Market, By Region
-
- Wire to Wire Connection
- Wire to Board Connection
- Board to Board Connection
- Body Control and Interiors
- Safety and Security
- Engine Control and Cooling System
- Fuel and Emission Control
- Infotainment
- Others
- Sealed Connector System
- Unsealed Connector System
- Passenger Car
- Commercial Vehicle
- Electric Vehicles
- North America
- Asia-Pacific
- Europe
- RoW
Available Customizations
MarketsandMarkets offers the following customizations for this market report:
- Detailed analysis and profiling of additional regions (up to 3)
- Detailed analysis and profiling of additional market players (up to 3)
The automotive connectors market, in terms of value, is projected to grow at a CAGR of 7.46% from 2016 to 2021. The market was estimated to be USD 4.38 Billion in 2016, and is projected to reach USD 6.28 Billion by 2021. The growth of the automotive connector market is fueled by the increasing number of electronic components and advanced safety features in vehicles, and rise in the number of autonomous vehicles across the globe.
The global market has been segmented on the basis of connection type, system type, application, vehicle type, and region. The market has been segmented on the basis of connection type into wire to wire connection, wire to board connection, and board to board connection. The wire to board connection segment was estimated to account for the largest market share, in terms of value, in 2016. The increase in the number of electronic components used in vehicles and rise in demand for automotive safety systems have been the key drivers for this market.
The global market has been segmented by application into body control and interiors, safety and security, engine control and cooling system, fuel and emission control, infotainment and others. The safety and security segment was expected to hold the largest market share, by value, in 2016. The rising electrification in vehicles has been a key driver for the market. Advanced vehicle safety technologies have also increased the number of connectors used per vehicle.
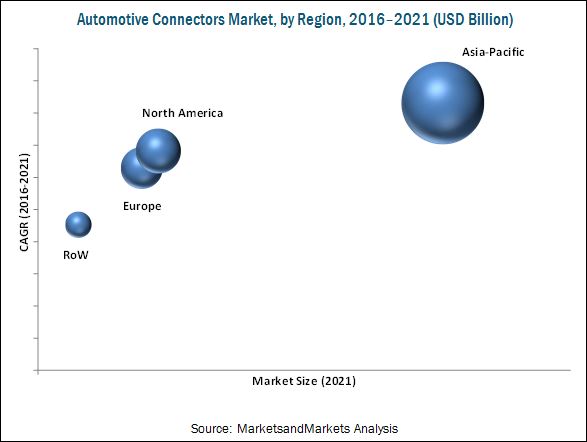
The Asia-Pacific region was estimated to dominate the market, in terms of value, in 2016. The rising consumer income levels, increased vehicle production in developing countries such as China, and rise in electric vehicles in countries such as Japan have all added up to the growth of the market in the Asia-Pacific region.
Restraints of the automotive connectors market:
One of the major concerns for manufacturers in the market is to meet reliability and durability standards. Nowadays, vehicles are equipped with heavy electronic components to control critical systems including airbags, GPS navigation etc. The connector solutions are able to withstand both low and high frequency solutions. Therefore, electronic components used in critical systems must be reliable and durable, as a failure in such systems could have disastrous results.
TE Connectivity is a leading player in the market. The company operates in three business segments: transportation solutions, industrial solutions, and communication solutions. The organization provides connectors solutions, sensors, contactors, vehicle wire and cable products, lighting assemblies, mobility solutions, and mechatronic components for the automotive industry. TE Connectivity has manufacturing operations in over 20 countries in addition to a global sales distribution. It has also collaborated with Molex Incorporated (U.S.) to provide new generation high speed input/output connectors and a partnership with Andretti Technologies (U.S.) to advance technology in auto sports and electric vehicles.
To speak to our analyst for a discussion on the above findings, click Speak to Analyst
 Exclusive indicates content/data unique to MarketsandMarkets and not available with any competitors.
Table of Contents
1 Introduction (Page No. - 14)
1.1 Objectives of the Study
1.2 Automotive Connectors Market Definition
1.3 Market Scope
1.3.1 Markets Covered
1.3.2 Years Considered for the Study
1.4 Currency
1.5 Package Size
1.6 Limitations
1.7 Stakeholders
1.8 Assumptions
2 Research Methodology (Page No. - 18)
2.1 Research Data
2.1.1 Secondary Data
2.1.1.1 Key Secondary Sources
2.1.1.2 Key Data From Secondary Sources
2.1.2 Primary Data
2.1.2.1 Sampling Techniques & Data Collection Methods
2.1.2.2 Primary Participants
2.2 Factor Analysis
2.2.1 Introduction
2.2.2 Demand Side Analysis
2.2.2.1 Increased Autonomy in Driving
2.2.2.2 Growing Demand for Electric Vehicles
2.2.3 Supply-Side Analysis
2.2.3.1 Technological Advancements
2.2.4 Market Size Estimation
2.3 Market Breakdown & Data Triangulation
2.4 Assumptions
3 Executive Summary (Page No. - 27)
3.1 Introduction
4 Premium Insights (Page No. - 31)
4.1 Introduction
4.2 Growing Opportunities in Automotive Connectors Market
4.3 Market, By Region, 2016 vs 2021
4.4 Market, By Connection Type, 2016 vs 2021
4.5 Market, By System Market, 2016 vs 2021
4.6 Market, By Application Type, 2016 vs 2021
4.7 Market, By Vehicle Type, 2016 vs 2021
5 Market Overview (Page No. - 35)
5.1 Introduction
5.2 Market Segmentation
5.3 Market Dynamics
5.3.1 Drivers
5.3.1.1 Increasing Electrification in Vehicles
5.3.1.2 Increasing Demand for Fuel-Efficient Vehicles
5.3.1.3 Increasing Demand for Automotive Safety Systems
5.3.2 Restraints
5.3.2.1 Reliability and Durability Concern Affects the Overall Efficiency
5.3.3 Opportunities
5.3.3.1 Trend of Autonomous Vehicles
5.3.4 Challenges
5.3.4.1 Rising Labor Cost in Low-Cost Manufacturing Countries
5.3.4.2 Global Rise in Price of Raw Materials
5.4 Porter’s Five Forces Analysis
5.4.1 Threat of New Entrants
5.4.1.1 Established Players Have Majority of the Market Share
5.4.2 Threat of Substitute
5.4.2.1 No Direct Substitutes But Improvement in Technology Will Affect the Adoption Rate
5.4.3 Bargaining Power of Buyers
5.4.3.1 Low Switching Cost
5.4.4 Bargaining Power of Suppliers
5.4.4.1 Volume & Product Differentiation
5.4.4.2 Decreasing Supplier Power With Increasing Number of Players and Less Than Anticipated Demand
5.4.5 Intensity of Competitive Rivalry
5.4.5.1 Rising Number of Competitors
6 Market, By Connection Type (Page No. - 47)
6.1 Introduction
6.2 Wire to Wire Connection
6.3 Wire to Board Connection
6.4 Board to Board Connection
7 Market, By System Type (Page No. - 53)
7.1 Introduction
7.2 Sealed Connector System
7.3 Unsealed Connector System
8 Market, By Application Type (Page No. - 58)
8.1 Introduction
8.2 Body Control and Interiors
8.3 Safety and Security System
8.4 Engine Control and Cooling System
8.5 Fuel and Emission Control
8.6 Infotainment
8.7 Others
9 Market, By Vehicle Type (Page No. - 67)
9.1 Introduction
9.2 Passenger Cars
9.3 Commercial Vehicles
9.3.1 Light Commercial Vehicles
9.3.2 Heavy Commercial Vehicles
9.4 Electric Vehicles
10 Market, By Region (Page No. - 75)
10.1 Introduction
10.2 Asia-Pacific
10.2.1 China
10.2.2 Japan
10.2.3 India
10.2.4 South Korea
10.3 North America
10.3.1 U.S.
10.3.2 Canada
10.3.3 Mexico
10.4 Europe
10.4.1 Germany
10.4.2 Italy
10.4.3 U.K.
10.4.4 France
10.5 RoW
10.5.1 Brazil
10.5.2 Russia
11 Competitive Landscape (Page No. - 100)
11.1 New Product Launches/Developments
11.2 Mergers & Acquisitions
11.3 Agreements/Joint Ventures/Supply Contracts /Collaborations /Partnerships & Others
11.4 Expansions
12 Company Profiles (Page No. - 106)
12.1 TE Connectivity
(Business Overview, Products & Services, Key Insights, Recent Developments,SWOT Analysis, Ratio Analysis, MnM View)*
12.2 Delphi Automotive
12.3 Yazaki Corporation
12.4 Sumitomo Electric Industries Ltd.
12.5 Japan Aviation Electronics Industry, Ltd.
12.6 Amphenol Corporation
12.7 Molex Incorporated
12.8 Hirose Electric Co.,Ltd
12.9 Foxconn Technology Group (Hon Hai Precision Industry Co., Ltd.)
12.10 JST Mfg. Co., Ltd.
12.11 AVX Corporation
12.12 Key Innovators
12.12.1 Molex Incorporated
12.12.2 Fischer Connectors
*Details on Business Overview, Products & Services, Key Insights, Recent Developments, SWOT Analysis, MnM View Might Not Be Captured in Case of Unlisted Companies.
13 Appendix (Page No. - 134)
13.1 Key Insights of Industry Experts
13.2 Discussion Guide
13.3 Knowledge Store: Subscription Portal
13.4 Introducing RT: Real Time Market Intelligence
13.5 Available Customizations
13.6 Related Reports
13.7 Author Details
List of Tables (81 Tables)
Table 1 Global Automotive Connectors Market, By Connection Type, 2014–2021(Million Units)
Table 2 Market, By Connection Type, 2014–2021 (USD Million)
Table 3 Market, By Region, 2014 –2021 (Million Units)
Table 4 Market, By Region, 2014 –2021 (USD Million)
Table 5 Market, By Region, 2014 –2021 (Million Units)
Table 6 Market, By Region, 2014 –2021 (USD Million)
Table 7 Market, By Region, 2014 –2021 (Million Units)
Table 8 Market, By Region, 2014 –2021 (USD Million)
Table 9 Market, By System Type, 2014–2021(Million Units)
Table 10 Market, By System Type, 2014–2021 (USD Million)
Table 11 Market, By Region, 2014–2021(Million Units)
Table 12 Market, By Region, 2014–2021(USD Million)
Table 13 Market, By Region, 2014–2021(Million Units)
Table 14 Market, By Region, 2014–2021(USD Million)
Table 15 Market, By Application Type, 2014–2021 (Million Units)
Table 16 Market, By Application Type, 2014–2021 (USD Million)
Table 17 Body Control and Interiors Connector: Automotive Connector Market Size, By Region, 2014–2021 (Million Units)
Table 18 Body Control and Interiors Connector: Market Size, By Region, 2014–2021 (USD Million)
Table 19 Safety and Security System Connectors Market: Market Size, By Region, 2014–2021 (Million Units)
Table 20 Safety and Security System Connectors Market: Market Size, By Region, 2014–2021 (USD Million)
Table 21 Engine Control and Cooling System Connectors: Automotive Connector Market Size, By Region, 2014–2021 (Million Units)
Table 22 Engine Control and Cooling System Connectors: Market Size, By Region, 2014–2021 (USD Million)
Table 23 Fuel and Emission Control Connectors: Market Size, By Region, 2014–2021 (Million Units)
Table 24 Fuel and Emission Control Connectors: Market Size, By Region, 2014–2021 (USD Million)
Table 25 Infotainment Connectors: Market Size, By Region, 2014–2021 (Million Units)
Table 26 Infotainment Connectors: Market Size, By Region , 2014–2021 (USD Million)
Table 27 Other Connectors: Market Size, By Region, 2014–2021 (Million Units)
Table 28 Other Connectors: Market Size, By Region, 2014–2021 (USD Million)
Table 29 Global Market, By Vehicle Type, 2014–2021 (Million Units)
Table 30 Market, By Vehicle Type, 2014–2021 (USD Million)
Table 31 Passenger Car: Market Size, By Connection Type, 2014–2021 (Million Units)
Table 32 Passenger Car: Market Size, By Connection Type, 2014–2021 (USD Million)
Table 33 Commercial Vehicles: Market Size, By Connection Type, 2014–2021 (Million Units)
Table 34 Commercial Vehicles: Market Size, By Connection Type, 2014–2021 (USD Million)
Table 35 Light Commercial Vehicles: Market Size, By Connection Type, 2014–2021 (Million Units)
Table 36 Light Commercial Vehicles: Market Size, By Connection Type, 2014–2021 (USD Million)
Table 37 Heavy Commercial Vehicles: Market Size, By Connection Type, 2014–2021 (Million Units)
Table 38 Heavy Commercial Vehicles: Market Size, By Connection Type, 2014–2021 (USD Million)
Table 39 Electric Vehicles: Market Size, By Connection Type, 2014–2021 (Million Units)
Table 40 Electric Vehicles: Market Size, By Connection Type, 2014–2021 (USD Million)
Table 41 Global Market, By Region, 2014–2021 (Million Units)
Table 42 Global Market: By Region, 2014-2021, (USD Million)
Table 43 Asia-Pacific: Market Size, By Country, 2014–2021 (Million Units)
Table 44 Asia-Pacific: Market Size, By Country, 2014–2021 (USD Million)
Table 45 China: Market, By Connection Type, 2014–2021 Million Units)
Table 46 China: Market, By Connection Type, 2014–2021 (USD Million)
Table 47 Japan: Market, By Connection Type, 2014–2021 (Million Units)
Table 48 Japan: Market, By Connection Type, 2014–2021 (USD Million)
Table 49 India: Market, By Connection Type, 2014–2021 (Million Units)
Table 50 India: Market, By Connection Type, 2014–2021 (USD Million)
Table 51 South Korea: Market, By Connection Type, 2014–2021 (Million Units)
Table 52 South Korea: Market, By Connection Type, 2014–2021 (USD Million)
Table 53 North America: Market Size, By Country, 2014–2021 (Million Units)
Table 54 North America: Market Size, By Country, 2014–2021 (USD Million)
Table 55 U.S.: Market, By Connection Type, 2014–2021 (Million Units)
Table 56 U.S.: Market, By Connection Type, 2014–2021 (USD Million)
Table 57 Canada: Market, By Connection Type, 2014–2021 (Million Units)
Table 58 Canada: Market, By Connection Type, 2014–2021 (USD Million)
Table 59 Mexico: Market, By Connection Type, 2014–2021 (Million Units)
Table 60 Mexico: Market, By Connection Type, 2014–2021 (USD Million)
Table 61 Europe: Market Size, By Country, 2014–2021 (Million Units)
Table 62 Europe: Market Size, By Country, 2014–2021 (USD Million)
Table 63 Germany: Market, By Connection Type, 2014–2021 (Million Units)
Table 64 Germany: Market, By Connection Type, 2014–2021 (USD Million)
Table 65 Italy: Market, By Connection Type, 2014–2021 (Million Units)
Table 66 Italy: Market, By Connection Type, 2014–2021 (USD Million)
Table 67 U.K.: Market, By Connection Type, 2014–2021 (Million Units)
Table 68 U.K.: Market, By Connection Type, 2014–2021 (USD Million)
Table 69 France: Market, By Connection Type, 2014–2021 (Million Units)
Table 70 France: Market, By Connection Type, 2014–2021 (USD Million)
Table 71 RoW: Market Size, By Country, 2014–2021 (Million Units)
Table 72 RoW: Market Size, By Country, 2014–2021 (USD Million)
Table 73 Brazil: Market, By Connection Type, 2014–2021 (Million Units)
Table 74 Brazil: Market, By Connection Type, 2014–2021 (USD Million)
Table 75 Russia: Market, By Connection Type, 2014–2021 (Million Units)
Table 76 Russia: Market, By Connection Type, 2014–2021 (USD Million)
Table 77 New Product Launches/Developments, 2015–2017
Table 78 Mergers & Acquisitions, 2014-2016
Table 79 Collaborations / Supply Contracts/Partnerships, 2015–2016
Table 80 Expansions, 2015-2016
Table 81 Key Innovators, Innovations and Impact on Automotive Connectors Industry
List of Figures (55 Figures)
Figure 1 Market Segmentation
Figure 2 Research Design
Figure 3 Research Methodology Model
Figure 4 Breakdown of Primary Interviews: By Company Type, Designation & Region
Figure 5 Us Electric Car Sales (Jan 2016 vs Jan 2017)
Figure 6 Market Size Estimation Methodology: Bottom-Up Approach
Figure 7 Data Triangulation
Figure 8 Key Countries of Automotive Connector Market (USD Million): China is Estimated to Be the Largest Market During 2016 vs 2021
Figure 9 Market (2016 vs 2021), By Connection Type: Wire to Board Connection to Lead the Market in Terms of Value
Figure 10 Market Outlook (2016 vs 2021), By Region: Asia-Pacific Expected to Acquire the Largest Market Share
Figure 11 Market Outlook (2016 Vs2021), By System Type: Sealed Connector System to Lead the Market in Terms of Value
Figure 12 Market Outlook (2016 vs 2021), By Vehicle Type: Passenger Cars Segment Expected to Lead the Market in Terms of Value
Figure 13 Market, 2016 vs 2021
Figure 14 Asia-Pacific Expected to Hold the Largest Market, By Value
Figure 15 Wire to Board Connection to Hold the Largest Size, By Value
Figure 16 Sealed Connector System is Estimated to Occupy the Largest Size, By Value
Figure 17 Safety and Security to Occupy the Largest Size, By Value
Figure 18 Passenger Cars to Hold the Largest Market Share, By Value
Figure 19 Market: Market Segmentation
Figure 20 Market: By Connection Type
Figure 21 Market: By System Type
Figure 22 Market: By Application Type
Figure 23 Market: By Vehicle Type
Figure 24 Market: By Region Type
Figure 25 Porter’s Five Forces Analysis
Figure 26 Existing Competition in the Automotive Connectors Segment has the Highest Impact on Market Entrants
Figure 27 Threat of Substitutes (Low)
Figure 28 Bargaining Power of Buyers (Moderate-To-High)
Figure 29 Bargaining Power of Suppliers (Low-To-Moderate)
Figure 30 Competitive Rivalry is Moderate to High in the Market
Figure 31 Wire to Board Connection Account for the Largest Market Size in Market, By Value, 2016 vs 2021
Figure 32 Sealed Connector System Account for the Largest Market Size in Market, 2016 vs 2021
Figure 33 Safety and Security Application is Estimated to Be the Largest Market in the Market During the Forecast Period
Figure 34 Passenger Cars Estimated to Be the Largest Market Segment in the Market During the Forecast Period
Figure 35 Regional Snapshot of Automotive Connectors: Market Size By Value – (2016 vs 2021)
Figure 36 China Held the Largest Market in Asia-Pacific Region for Automotive Connector Market By Value (2016)
Figure 37 U.S. Held the Largest Market in North America Region for Automotive Connector Market By Value (2016)
Figure 38 Germany Expected to Hold the Largest Market Share, 2016 vs 2021 (USD Million)
Figure 39 Companies Adopted New Product Development as the Key Growth Strategy, 2014-2016
Figure 40 Market Evaluation Framework From 2014 to 2017
Figure 41 Battle for Market Share: New Product Development has Been the Key Strategy
Figure 42 Company Snapshot: TE Connectivity
Figure 43 TE Connectivity: SWOT Analysis
Figure 44 Company Snapshot: Delphi Automotive
Figure 45 Delphi Automotive: SWOT Analysis
Figure 46 Company Snapshot: Yazaki Corporation
Figure 47 Yazaki Corporation: SWOT Analysis
Figure 48 Company Snapshot: Sumitomo Electric Industries Ltd.
Figure 49 Sumitomo Electric Industries Ltd.: SWOT Analysis
Figure 50 Company Snapshot: Japan Aviation Electronics Industry, Ltd.
Figure 51 Japan Aviation Electronics Industry, Ltd.: SWOT Analysis
Figure 52 Company Snapshot: Amphenol Corporation
Figure 53 Company Snapshot: Hirose Electric Co.,Ltd
Figure 54 Company Snapshot: Foxconn Technology Group
Figure 55 Company Snapshot: AVX Corporation


Growth opportunities and latent adjacency in Automotive Connectors Market
we are looking for the automotive connectors that make SUMITOMO, HIROSE, AMP, MOLEX, among others