Artificial Grass Market by Installation (Flooring, Wall Cladding), Fiber Base Material (Polyethylene, Polypropylene, Nylon), Application (Contact Sports, Non-contact Sports, Leisure, Landscaping), Infill Material, and Region - Global Forecast to 2022


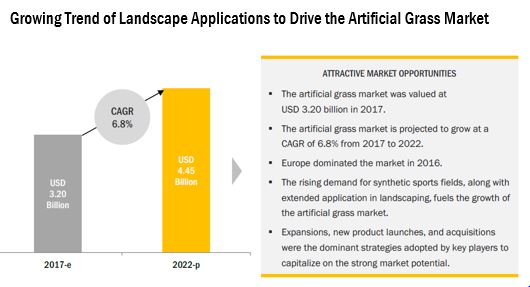
[171 Pages Report] The global artificial grass market was valued at USD 3.00 Billion in 2016 and is projected to grow at a CAGR of 6.8% from 2017, to reach USD 4.45 Billion by 2022.
For More details on this research, Request Free Sample Report
The years considered for the study are as follows:
- Base year: 2016
- Estimated year: 2017
- Projected year: 2022
- Forecast period: 2017–2022
Objectives of the study are as follows:
- To define, segment, and project the global market size with respect to application, installation, fiber base material, infill material, and key regions
- To provide detailed information about the major factors influencing the growth of the market (drivers, restraints, opportunities, and industry-specific challenges)
- To analyze the opportunities in the market for stakeholders and provide the competitive landscape of the market leaders
- To project the size of the market and its submarkets, in terms of value and volume, with respect to the regions (along with the key countries)
- To strategically profile the key players and comprehensively analyze their market position and core competencies
- To analyze the competitive developments such as expansions & investments, mergers & acquisitions, and new product developments in the artificial grass market
Research Methodology
This report includes estimations of the market size in terms of value (USD million/billion) and volume (kilotons/million square meters). Both, top-down and bottom-up approaches have been used to estimate and validate the size of the artificial grass market and of various other dependent submarkets in the overall market. Key players in the market have been identified through secondary research, and their market shares in the respective regions have been determined through primary and secondary research. All percentage shares, splits, and breakdowns have been determined using secondary sources—Synthetic Turf Council, European Synthetic Turf Organization (ESTO), Association of Synthetic Grass Installers (ASGI), Fédération Internationale de Football Association (FIFA), and US Environmental Protection Agency—to identify and collect information useful for this technical, market-oriented, and commercial study of this market.
To know about the assumptions considered for the study, download the pdf brochure
The market for artificial grass is dominated by key players such as DowDuPont (US), Tarkett (France), Controlled Products (US), Shaw Industries Group (US), and Victoria PLC (UK). Other artificial grass companies include Act Global (US), SportGroup (Germany), TigerTurf (New Zealand), SIS Pitches (UK), Matrix Turf (US), Nurteks Hali (Turkey), Soccer Grass (Brazil), Limonta (Italy), Sportlink (Brazil), and El Espartano (Argentina).
Target Audience:
- Artificial grass manufacturers and equipment suppliers
- Artificial grass traders, distributors, importers, exporters, and suppliers
- Yarn manufacturers
- Commercial research & development (R&D) organizations, turf recycling organizations, and financial institutions
- Artificial grass installers, infill solution providers, architects, sports field engineers, and polymer manufacturers
- Artificial grass associations and regulatory bodies such as the Synthetic Turf Council, the World Health Organization (WHO), the US Environmental Protection Agency, the European Synthetic Turf Organisation (ESTO), the Agency for Toxic Substances and Disease Registry (ATSDR), the Association of Synthetic Grass Installers (ASGI), L'Association Nationale Des Élus en charge du Sport (ANDES), the Recycled Rubber Council (RRC), Turf Reclamation Solutions (TRS), and the Institute of Scrap Recycling Industries (ISRI)
- Sports federations such as Fédération Internationale de Football Association (FIFA), the Union of European Football Associations (UEFA), the International Rugby Board (IRB), Fédération Internationale de Hockey (FIH), the American Sports Builders Association (ASBA), and the International Tennis Federation (ITF)
Scope of the report:
Based on Installation, the market has been segmented as follows:
- Flooring
- Wall cladding
Based on Application, the market has been segmented as follows:
-
Contact sports
- Football
- Rugby
- Hockey
- Others (lacrosse, roller derby, basketball, and baseball)
-
Non-contact sports
- Tennis
- Golf
- Others (volleyball, cricket, badminton, racquetball, lawn bowls, squash, running, sprinting, gymnastics, pool, snooker, and rowing)
- Leisure
- Landscaping
Based on Fiber base Material, the market has been segmented as follows:
- Polyethylene
- Polypropylene
- Nylon
Based on Infill Material, the market has been segmented as follows:
-
Petroleum-based infills
- Styrene-butadiene rubber
- Ethylene propylene diene monomers
- Thermoplastic elastomers
- Others (acrylic polymer coated sand and post-industrial product grinds)
- Sand infill
- Plant-based infills
Based on Region, the market has been segmented as follows:
- North America
- Europe
- Asia Pacific
- South America
- RoW
Available Customization
With the given market data, MarketsandMarkets offers customizations according to client-specific needs.
The following customization options are available for the report:
Product Analysis
- Product matrix, which gives a detailed comparison of the product portfolio of each company
Regional Analysis
- Further breakdown of the Rest of European artificial grass market into Italy, Portugal, Ireland, Sweden, Bulgaria, Greece, Poland, and Denmark.
- Further breakdown of the Rest of Asia Pacific artificial grass market into South Korea, Vietnam, the Philippines, Thailand, Indonesia, Sri Lanka, Singapore, and Pakistan.
- Further breakdown of the South American artificial grass market into Chile, Colombia, Venezuela, Bolivia, and Uruguay.
Company Information
- Detailed analysis and profiling of additional market players (up to two)
The artificial grass market is driven by factors such as increased applications in the landscaping segment, recycling of artificial grass pitches, and development of different solutions for producing infill materials and yarn technology.
For More details on this research, Request Free Sample Report
Based on installation, the market has been segmented into flooring and wall cladding. The flooring segment dominated the market in terms of both value and volume in 2016. Rising popularity and acceptance of synthetic sports fields for indoor as well as outdoor sports, along with extended applications in landscaping are the key factors that drive the flooring segment in the artificial grass market. In developed countries, the backing of advanced technologies with regard to product development and sports infrastructure development has fueled the demand for artificial grass.
Based on fiber base material, the market has been segmented into polyethylene, polypropylene, and nylon. The polyethylene segment is estimated to account for the largest share of the market in 2017. It is widely preferred by various artificial grass manufacturers due to due to its durability, softness, and resiliency, which is required for technically demanding contact sports pitches.
Based on application, the artificial grass market has been segmented into contact sports, non-contact sports, landscaping, and leisure. The contact sports segment is estimated to be the largest segment in 2017 and this trend is expected to continue through the forecast period owing to factors such as the increase in number of football pitches across the world, increase in investments in hockey in countries such as India, and growth in popularity of American football in the US.
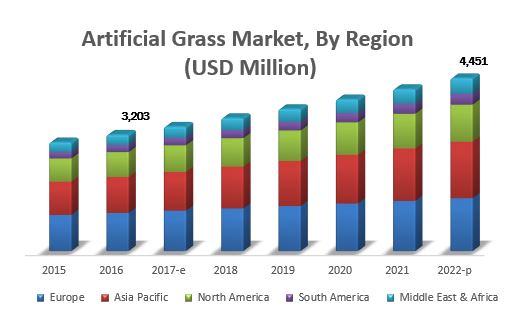
Europe is estimated to occupy the largest share of the global artificial grass market, in terms of value, in 2017, owing to the mature artificial grass industry and the presence of major companies such as Tarkett (France), SportGroup (Germany), Victoria PLC (UK), and SIS Pitches (UK). The increase in research & development activities for artificial grass due to safety concerns of sports players, government support for the maintenance of artificial grass facilities, and infrastructure to promote sports activities, mainly football, is expected to drive the global market in this region during the forecast period. In the Asia Pacific region, India is projected to be the fastest-growing market during the forecast period. The growing trend of landscaping, growing investment by key stakeholders, and government support for infrastructure upgradation, mainly hockey, is expected to drive the market in India. Key players in Europe and the US are expected to focus on the untapped opportunities in the artificial grass market in countries such as India and China, owing to which Asia Pacific is expected to witness high growth in the coming years.
The health and environmental impact of artificial grass is the major factor restraining the growth of the market globally. The major challenge faced by the end users is the high field temperature associated with artificial grass.
The artificial grass market is dominated by key players such as DowDuPont (US), Tarkett (France), Controlled Products (US), Shaw Industries Group (US), and Victoria PLC (UK). Other artificial grass companies include Act Global (US), SportGroup (Germany), TigerTurf (New Zealand), SIS Pitches (UK), Matrix Turf (US), Nurteks Hali (Turkey), Soccer Grass (Brazil), Limonta (Italy), Sportlink (Brazil), and El Espartano (Argentina). These leading players have adopted various strategies such as expansions, acquisitions, new product launches, and investment to explore new and untapped markets, expand in emerging markets, and develop a new customer base for long-term client relationships. This has not only enabled the key players to expand their geographical reach but has also reinforced their market position by gaining a larger share in terms of revenue and product portfolios. Small-scale players have also adopted these strategies to expand their businesses globally by investing in the establishment of manufacturing facilities in various regions. Inorganic growth strategies enable them to improve their technical expertise through intensive R&D infrastructure offered by bigger players.
To speak to our analyst for a discussion on the above findings, click Speak to Analyst
 Exclusive indicates content/data unique to MarketsandMarkets and not available with any competitors.
Table of Contents
1 Introduction (Page No. - 14)
1.1 Objectives of the Study
1.2 Market Definition
1.3 Study Scope
1.4 Years Considered for the Study
1.5 Currency Considered
1.6 Units Considered
1.7 Stakeholders
2 Research Methodology (Page No. - 19)
2.1 Research Data
2.1.1 Secondary Data
2.1.2 Primary Data
2.1.2.1 Key Industry Insights
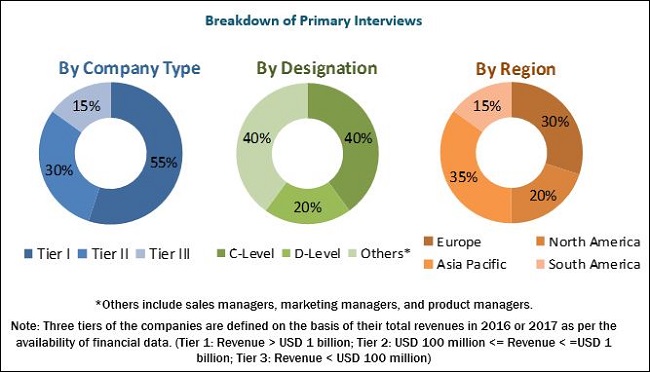
2.1.2.2 Breakdown of Primary Interviews
2.2 Market Size Estimation
2.2.1 Bottom-Up Approach
2.3 Data Triangulation
2.4 Research Assumptions
2.5 Limitations
3 Executive Summary (Page No. - 27)
4 Premium Insights (Page No. - 31)
4.1 Attractive Opportunities in the Market
4.2 Artificial Grass Market, By Region
4.3 Europe: Artificial Grass Market, By Installation & Country
4.4 Artificial Grass Market, By Application & Region
4.5 Market Share: Key Countries
5 Market Overview (Page No. - 36)
5.1 Introduction
5.2 Market Dynamics
5.2.1 Drivers
5.2.1.1 Growing Demand From Sports Venues
5.2.1.2 Increase in the Number of Stadiums Using Artificial Turf
5.2.1.3 Cost Advantages of Artificial Grass
5.2.2 Restraints
5.2.2.1 Health and Environmental Impact of Artificial Grass
5.2.3 Opportunities
5.2.3.1 Opportunities in Developing Countries and Countries With Harsh Climate
5.2.3.2 R&D Activities and Advancements in Technology
5.2.4 Challenges
5.2.4.1 High Field Temperatures Associated With Artificial Grass
5.3 Regulations
5.3.1 Introduction
5.3.2 Fédération Internationale De Football Association (FIFA)
5.3.3 World Rugby
5.3.4 The International Tennis Federation (ITF)
5.3.5 International Hockey Federation (FIH)
6 Artificial Grass Market, By Installation (Page No. - 45)
6.1 Introduction
6.2 Wall Cladding
6.3 Flooring
7 Artificial Grass Market, By Application (Page No. - 50)
7.1 Introduction
7.2 Contact Sports
7.2.1 Football
7.2.2 Rugby
7.2.3 Hockey
7.2.4 Other Contact Sports
7.3 Non-Contact Sports
7.3.1 Tennis
7.3.2 Golf
7.3.3 Other Non-Contact Sports
7.4 Leisure
7.5 Landscaping
8 Artificial Grass Market, By Fiber Base Material (Page No. - 67)
8.1 Introduction
8.2 Polyethylene
8.3 Polypropylene
8.4 Nylon
9 Artificial Grass Market, By Infill Material (Page No. - 71)
9.1 Introduction
9.2 Petroleum-Based Infills
9.2.1 Styrene-Butadiene Rubber (SBR)
9.2.2 Ethylene Propylene Diene Monomer (EPDM)
9.2.3 Thermoplastic Elastomers (TPE)
9.2.4 Others (Acrylic/Polymer Coated Sand, and Post-Industrial Product Grinds)
9.3 Sand Infill
9.4 Plant-Based Infills
10 Artificial Grass Market, By Region (Page No. - 78)
10.1 Introduction
10.2 North America
10.2.1 US
10.2.2 Canada
10.2.3 Mexico
10.3 Europe
10.3.1 UK
10.3.2 Germany
10.3.3 Netherlands
10.3.4 Spain
10.3.5 Belgium
10.3.6 France
10.3.7 Rest of Europe
10.4 Asia Pacific
10.4.1 China
10.4.2 Australia
10.4.3 India
10.4.4 Japan
10.4.5 Rest of Asia Pacific
10.5 South America
10.5.1 Argentina
10.5.2 Brazil
10.5.3 Peru
10.5.4 Paraguay
10.5.5 Rest of South America
10.6 RoW
10.6.1 Africa
10.6.2 Middle East
11 Competitive Landscape (Page No. - 118)
11.1 Overview
11.2 Market Ranking
11.2.1 Key Market Strategies
11.3 Competitive Scenario
11.3.1 Expansions & Investments
11.3.2 Mergers & Acquisitions
11.3.3 New Product Launches
12 Company Profiles (Page No. - 124)
(Business Overview, Products Offered, Recent Developments, SWOT Analysis, MnM View)*
12.1 Introduction
12.2 Dowdupont
12.3 Tarkett
12.4 Shaw Industries
12.5 Victoria PLC
12.6 Controlled Products
12.7 ACT Global
12.8 Sport Group
12.9 Tigerturf
12.10 SIS Pitches
12.11 Matrix Turf
12.12 Nurteks Hali
12.13 Soccer Grass
12.14 Limonta
12.15 Sportlink
12.16 El Espartano
*Details on Business Overview, Products Offered, Recent Developments, SWOT Analysis, MnM View Might Not Be Captured in Case of Unlisted Companies.
13 Appendix (Page No. - 163)
13.1 Discussion Guide
13.2 Knowledge Store: Marketsandmarkets’ Subscription Portal
13.3 Introducing RT: Real-Time Market Intelligence
13.4 Available Customizations
13.5 Related Reports
13.6 Author Details
List of Tables (89 Tables)
Table 1 US Dollar Exchange Rate Considered for Study, 2014–2017
Table 2 Artificial Grass Market Size, By Installation, 2015–2022 (USD Million)
Table 3 Artificial Grass Size, By Installation, 2015–2022 (Million Square Meters)
Table 4 Wall Cladding: Artificial Grass Size, By Region, 2015–2022 (USD Million)
Table 5 Wall Cladding: Artificial Grass Size, By Region, 2015–2022 (Million Square Meters)
Table 6 Flooring: Market Size for Artificial Grass, By Region, 2015–2022 (USD Million)
Table 7 Flooring: Market Size, By Region, 2015–2022 (Million Square Meters)
Table 8 Market Size for Artificial Grass, By Application, 2015–2022 (USD Million)
Table 9 Market Size, By Application, 2015–2022 (Million Square Meters)
Table 10 Artificial Grass Market Size for Contact Sports, By Region, 2015–2022 (USD Million)
Table 11 Market Size for Contact Sports, By Region, 2015–2022 (Million Square Meters)
Table 12 Market Size for Football, By Region, 2015–2022 (USD Million)
Table 13 Market Size for Football, By Region, 2015–2022 (Million Square Meters)
Table 14 Market Size for Rugby, By Region, 2015–2022 (USD Million)
Table 15 Market Size for Rugby, By Region, 2015–2022 (Million Square Meters)
Table 16 Market Size for Hockey, By Region, 2015–2022 (USD Million)
Table 17 Market Size for Hockey, By Region, 2015–2022 (Million Square Meters)
Table 18 Market Size for Other Contact Sports, By Region, 2015–2022 (USD Million)
Table 19 Market Size for Other Contact Sports, By Region, 2015–2022 (Million Square Meters)
Table 20 Market Size for Non-Contact Sports, By Region, 2015–2022 (USD Million)
Table 21 Market Size for Non-Contact Sports, By Region, 2015–2022 (Million Square Meter)
Table 22 Artificial Grass Market Size for Tennis, By Region, 2015–2022 (USD Million)
Table 23 Market Size for Tennis, By Region, 2015–2022 (Million Square Meters)
Table 24 Market Size for Golf, By Region, 2015–2022 (USD Million)
Table 25 Market Size for Golf, By Region, 2015–2022 (Million Square Meters)
Table 26 Market Size for Other Non-Contact Sports, By Region, 2015–2022 (USD Million)
Table 27 Market Size for Other Non-Contact Sports, By Region, 2015–2022 (Million Square Meters)
Table 28 Market Size for Leisure, By Region, 2015–2022 (USD Million)
Table 29 Market Size for Leisure, By Region, 2015–2022 (Million Square Meters)
Table 30 Artificial Grass Market Size for Landscaping, By Region, 2015–2022 (USD Million)
Table 31 Market Size for Landscaping, By Region, 2015–2022 (Million Square Meters)
Table 32 Artificial Grass Market Size, By Fiber Base Material, 2015–2022 (KT)
Table 33 Polyethylene Base Grass Market Size, By Fiber Base Material, 2015–2022 (KT)
Table 34 Polypropylene Base Grass Market Size, By Fiber Base Material, 2015–2022 (KT)
Table 35 Nylon Base Grass Market Size, By Fiber Base Material, 2015–2022 (KT)
Table 36 Artificial Grass Market Size, By Infill Material, 2015–2022 (KT)
Table 37 Petroleum-Based Infills Market Size, By Region, 2015–2022 (KT)
Table 38 Styrene Butadiene Rubber (SBR) Infills Market Size, By Region, 2015–2022 (KT)
Table 39 Ethylene Propylene Diene Monomer (EPDM) Infill Market Size, By Region, 2015–2022 (KT)
Table 40 Thermoplastic Elastomer (TPE) Infill Market Size, By Region, 2015–2022 (KT)
Table 41 Other Petroleum-Based Infills Market Size, By Region, 2015–2022 (KT)
Table 42 Sand Infill Market Size, By Region, 2015–2022 (KT)
Table 43 Plant-Based Infills Market Size, By Region, 2015–2022 (KT)
Table 44 Market Size for Artificial Grass, By Region, 2015–2022 (USD Million)
Table 45Market Size, By Region, 2015–2022 (Million Square Meters)
Table 46 North America: Artificial Grass Market Size, By Country, 2015–2022 (USD Million)
Table 47 North America: Market Size, By Country, 2015–2022 (Million Square Meters)
Table 48 North America: Market Size, By Installation, 2015–2022 (USD Million)
Table 49 North America: Market Size, By Installation, 2015–2022 (Million Square Meters)
Table 50 North America: Market Size, By Application, 2015–2022 (USD Million)
Table 51 North America: Market Size, By Application, 2015–2022 (Million Square Meters)
Table 52 North America: Market Size, By Infill Material, 2015–2022 (KT)
Table 53 North America: Market Size, By Fiber Base Material, 2015–2022 (KT)
Table 54 Europe: Artificial Grass Market Size, By Country, 2015–2022 (USD Million)
Table 55 Europe: Market Size, By Country, 2015–2022 (Million Square Meters)
Table 56 Europe: Market Size, By Installation, 2015–2022 (USD Million)
Table 57 Europe: Market Size, By Installation, 2015–2022 (Million Square Meters)
Table 58 Europe: Market Size, By Application, 2015–2022 (USD Million)
Table 59 Europe: Market Size, By Application, 2015–2022 (Million Square Meters)
Table 60 Europe: Market Size, By Infill Material, 2015–2022 (KT)
Table 61 Europe: Market Size, By Fiber Base Material, 2015–2022 (KT)
Table 62 Asia Pacific: Artificial Grass Market Size, By Country, 2015–2022 (USD Million)
Table 63 Asia Pacific: Market Size, By Country, 2015–2022 (Million Square Meters)
Table 64 Asia Pacific: Market Size, By Installation, 2015–2022 (USD Million)
Table 65 Asia Pacific: Market Size, By Installation, 2015–2022 (Million Square Meters)
Table 66 Asia Pacific: Market Size, By Application, 2015–2022 (USD Million)
Table 67 Asia Pacific: Market Size, By Application, 2015–2022 (Million Square Meters)
Table 68 Asia Pacific: Market Size, By Infill Material, 2015–2022 (KT)
Table 69 Asia Pacific: Market Size, By Fiber Base Material, 2015–2022 (KT)
Table 70 South America: Artificial Grass Market Size, By Country, 2015–2022 (USD Million)
Table 71 South America: Market Size, By Country, 2015–2022 (Million Square Meters)
Table 72 South America: Market Size, By Installation, 2015–2022 (USD Million)
Table 73 South America: Market Size, By Installation, 2015–2022 (Million Square Meters)
Table 74 South America: Market Size, By Application, 2015–2022 (USD Million)
Table 75 South America: Market Size, By Application, 2015–2022 (Million Square Meters)
Table 76 South America: Market Size, By Infill Material, 2015–2022 (KT)
Table 77 South America: Market Size, By Fiber Base Material, 2015–2022 (KT)
Table 78 RoW: Market Size for Artificial Grass, By Region, 2015–2022 (USD Million)
Table 79 RoW: Market Size, By Region, 2015–2022 (Million Square Meters)
Table 80 RoW: Market Size, By Installation, 2015–2022 (USD Million)
Table 81 RoW: Market Size, By Installation, 2015–2022 (Million Square Meters)
Table 82 RoW:Market Size, By Application, 2015–2022 (USD Million)
Table 83 RoW: Market Size, By Application, 2015–2022 (Million Square Meters)
Table 84 RoW: Market Size, By Infill Material, 2015–2022 (KT)
Table 85 RoW: Market Size, By Fiber Base Material, 2015–2022 (KT)
Table 86 Top Five Players Led the Global Artificial Grass Market, 2017
Table 87 Expansions & Investments, 2014–2016
Table 88 Mergers & Acquisitions, 2015–2018
Table 89 New Product Launches, 2017–2018
List of Figures (39 Figures)
Figure 1 Market Segmentation
Figure 2 Regional Segmentation
Figure 3 Artificial Grass: Research Design
Figure 4 Breakdown of Primary Interviews: By Company Type, Designation, and Region
Figure 5 Market Size Estimation Methodology: Bottom-Up Approach
Figure 6 Market Size Estimation Methodology: Top-Down Approach
Figure 7 Data Triangulation Methodology
Figure 8 Artificial Grass Market, By Fiber Base Material, 2017 vs 2022
Figure 9 Market, By Installation, 2017 vs 2022
Figure 10 Market, By Application, 2017 vs 2022
Figure 11 Market, By Region
Figure 12 Growing Trend of Landscape Applications to Drive the Global Market
Figure 13 Europe Dominated the Market in 2016
Figure 14 Flooring Segment Held the Largest Share of this Market in 2016
Figure 15 Contact Sports Segment Held the Largest Share of this Market Across All Regions in 2016
Figure 16 US Accounted for the Largest Share of the Global Artificial Grass Market, 2016
Figure 17 Market Dynamics
Figure 18 Europe: Number of Artificial Football Fields Installed Annually
Figure 19 Number of Synthetic Turf Pitches in the Netherlands Since 2010
Figure 20 Steps for Performance and Criteria Establishment
Figure 21 Artificial Grass Market Share, By Installation, (USD Million), 2016
Figure 22 Market Size, By Application, 2017 vs 2022 (USD Million)
Figure 23 Artificial Grass Market Size for Contact Sports, By Sub-Application, 2017 vs 2022 (USD Million)
Figure 24 Polyethylene Segment to Dominate in the Global Market Through 2022
Figure 25 Geographic Snapshot (2017–2022): India, Paraguay, Argentina, and China are Emerging as New Hot Spots, in Terms of Value
Figure 26 North America: Artificial Grass Market Snapshot
Figure 27 European Artificial Grass Market Snapshot
Figure 28 Asia Pacific: Market Snapshot
Figure 29 Key Developments By Leading Players in the Artificial Grass Market From2013 to 2017
Figure 30 Artificial Grass Market Developments, By Growth Strategy, 2014–2018
Figure 31 Dowdupont: Company Snapshot
Figure 32 Dowdupont: SWOT Analysis
Figure 33 Tarkett: Company Snapshot
Figure 34 Tarkett: SWOT Analysis
Figure 35 Berkshire Hathaway (Parent Company): Company Snapshot
Figure 36 Shaw Industries: SWOT Analysis
Figure 37 Victoria PLC: Company Snapshot
Figure 38 Victoria PLC: SWOT Analysis
Figure 39 Controlled Products: SWOT Analysis


Growth opportunities and latent adjacency in Artificial Grass Market