Aquatic Herbicides Market by Type (Glyphosate, 2,4-D, Imazapyr, Diquat, Triclopyr), Application Method (Foliar, Submerged), Application (Agricultural Waters, Fisheries, Recreational Waters), Mode of Action, and Region - Global Forecast to 2022


[141 Pages Report] The aquatic herbicides market was valued at USD 470.9 Million in 2016 and is projected to reach USD 696.4 Million by 2022, growing at a CAGR of 6.8%. The objectives of this study are to define, segment, and project the size of the market based on type, application method, mode of action, application, and key regions.
For More details on this research, Request Free Sample Report
- To provide detailed information about the key factors influencing the growth of the market (drivers, restraints, opportunities, and industry-specific challenges)
- To analyze the micromarkets with respect to individual growth trends, future prospects, and their contribution to the total market
- To analyze the opportunities in the market for stakeholders and provide a competitive landscape of market trends
- To project the size of the market and its submarkets, in terms of value, with respect to five regions (along with their respective key countries)
- To profile the key players and comprehensively analyze their core competencies
- To analyze the competitive developments such as expansions, mergers & acquisitions, agreements, and partnerships & collaborations in the market
- To provide a detailed competitive landscape of this market, along with an analysis of the business and corporate strategies adopted by key players
The years considered for the study are:
- Base year � 2016
- Beginning of projection period � 2017
- End of projection period � 2022
- Forecast period � 2017 to 2022
This report includes the estimation of the market size for value (USD million) and volume (metric tons). Both, top-down and bottom-up approaches have been used to estimate and validate the size of the market and to estimate the size of various other dependent submarkets in the overall market. Key players in the market have been identified through secondary research (FAO, Bloomberg Businessweek, Factiva, and companies� annual reports), and their market shares have been determined through primary and secondary research. All percentage shares, splits, and breakdowns have been determined using secondary sources and verified through primary sources.
To know about the assumptions considered for the study, download the pdf brochure
Market Ecosystem
The various contributors involved in the value chain of aquatic herbicides include manufacturers, suppliers, distributors, intermediaries, and customers. The key players in the aquatic herbicides market include Dow Chemical (US), BASF (Germany), Monsanto (US), Syngenta (Switzerland), Nufarm (Australia), Lonza (Switzerland), Land O'Lakes (US), UPL (India), Platform Specialty Products (US), SePRO Corporation (US), Albaugh (US), Valent (US), and SANCO INDUSTRIES (US).
Target Audience
- Aquatic herbicide manufacturers and suppliers
- Technology providers to the aquatic herbicide manufacturers
- Regulatory bodies, including government agencies and NGOs
- Aquatic herbicide importers and exporters
- Aquatic herbicide traders, distributors, and suppliers
- Government organizations, research organizations, and consulting firms
- Trade associations and industry bodies
Scope of the Report
The aquatic herbicides market is segmented as follows:
On the basis of Type:
- Glyphosate
- 2,4-D
- Imazapyr
- Diquat
- Triclopyr
- Others (fluridone, flumioxazin, and copper & chelated copper)
On the basis of Application:
- Agricultural waters
- Fisheries
- Recreational waters
- Others (retention ponds, development waters, and flood control canals)
On the basis of Application Method:
- Foliar
- Submerged
On the basis of Mode of Action:
- Selective
- Non-selective
On the basis of Region:
- North America
- Europe
- Asia Pacific
- South America
- RoW (South Africa and Others in RoW)
Available Customizations
With the given market data, MarketsandMarkets offers customizations according to the client-specific needs.
The following customization options are available for the report:
Product Analysis
- Product matrix, which gives a detailed comparison of the product portfolio of each company
Regional Analysis
- Further breakdown of the Rest of Asia Pacific market for aquatic herbicides into key contributing countries
- Further breakdown of the Rest of the World market for aquatic herbicides into South American countries
Company Information
- Detailed analysis and profiling of additional market players (up to five)
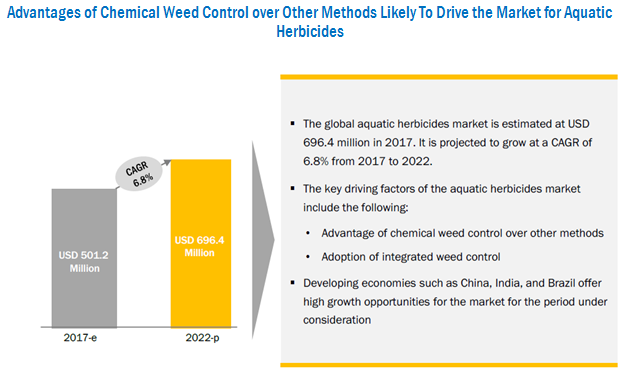
The aquatic herbicides market was valued at USD 501.2 Million by 2017. It is projected to reach USD 696.4 Million by 2022, growing at a CAGR of 6.8% from 2017. The market has largely driven the growing adoption of integrated weed control. It is used when long-lasting weed control is required at inexpensive costs and with less undesired side effects. The advantages of using aquatic herbicides over other treatment methods such as manual and mechanical methods are also driving the market for aquatic herbicides.
The glyphosate segment is projected to dominate the market through the forecast period. Glyphosate is an important segment of the market as the formulation of glyphosate is less expensive than the mechanical or manual removal of aquatic weeds; it also provides long-term control of weeds when compared to other biological and mechanical methods.
The foliar segment is estimated to dominate the market as foliar application takes less time and ensures better weed cover as compared to the submerged application. More herbicides are registered for foliar application, which is projected to drive the foliar segment in the market.
For More details on this research, Request Free Sample Report
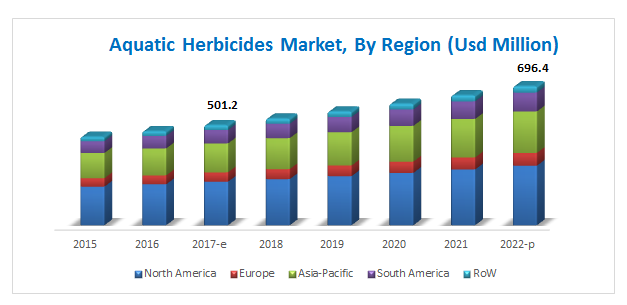
The North American region dominated the market in 2016 and is projected to grow at a moderate CAGR from 2017 to 2022. The presence of leading aquatic herbicides manufacturers who operate on a global level and the rising adoption of integrated weed management drive the demand for aquatic herbicides in the region. Thus, aquatic herbicides are extensively used in agricultural waters, canals, irrigation waters, recreational waters, and fisheries. They remove the undesirable plants that might cause damage, fire hazards, or pose impediments to work crews. They also reduce the costs of labor required for removing these weeds. This increased use of aquatic herbicides in agricultural waters and recreational waters drives the growth of the aquatic herbicides market in North America.
In the Asia Pacific region, Australia and New Zealand dominate the market. The major herbicides used in this region to control underwater weeds are glyphosate, 2,4-D, and diquat. Glyphosate is the most effective weed killer used in New Zealand for controlling emergent weeds. Diquat is the oldest herbicide, which has been used for over 40 years in New Zealand for controlling submerged weeds as it does little harm to non-nuisance native species.
Concerns among applicators about fish kills, damage to desirable plants, and the effect of herbicide application and prolonged process of approval due to the stringent regulatory approval process restrain the market growth.
The aquatic herbicides market is concentrated, with leading companies driving the market growth. This report provides a qualitative analysis of the prominent market players and their preferred development strategies. Key players such as Dow Chemical (US), BASF (Germany), Monsanto (US), Syngenta (Switzerland), and Nufarm (Australia) have been profiled in the report. These leading players have adopted various strategies such as expansions, mergers & acquisitions, and collaborations/partnerships/agreements to explore new and untapped markets, expanding in local areas of emerging markets, and developing a new customer base for long-term client relationships. This has not only enabled the key players to expand their geographical reach but has also reinforced their market position by gaining a larger share in terms of revenue and product portfolios.
Small-scale players have also adopted these strategies to expand their businesses globally by investing in the establishment of manufacturing facilities and technical service centers in various regions. This inorganic growth strategy enables them to improve their technical expertise through intensive R&D infrastructure offered by bigger players.
Frequently Asked Questions (FAQ):
What is the leading application in the aquatic herbicides market?
The agricultural waters segment was the highest revenue contributor to the market, with USD 157.4 million in 2016, and is estimated to reach USD 235.6 million by 2022, with a CAGR of 7.0%. The recreational waters segment is estimated to reach USD 223.8 million by 2022, at a significant CAGR of 6.8% during the forecast period.
What is the estimated industry size of aquatic herbicides?
The global aquatic herbicides market was valued at USD 470.92 million in 2016, and is projected to reach USD 696.4 million by 2022, registering a CAGR of 6.8% from 2017 to 2022.
What is the leading type of aquatic herbicides market?
The glyphosate segment was the highest revenue contributor to the market, with USD 336.0 million in 2016, and is estimated to reach USD 501.4 million by 2022, with a CAGR of 7.0%. .
To speak to our analyst for a discussion on the above findings, click Speak to Analyst
 Exclusive indicates content/data unique to MarketsandMarkets and not available with any competitors.
Table of Contents
1 Introduction (Page No. - 13)
1.1 Objectives of the Study
1.2 Market Definition
1.3 Study Scope
1.4 Periodization Considered
1.5 Currency Considered
1.6 Unit Considered
1.7 Stakeholders
2 Research Methodology (Page No. - 17)
2.1 Research Data
2.1.1 Secondary Data
2.1.1.1 Key Data From Secondary Sources
2.1.2 Primary Data
2.1.2.1 Key Data From Primary Sources
2.1.2.2 Key Industry Insights
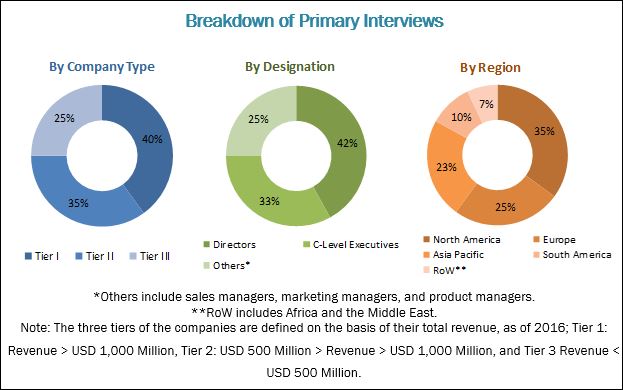
2.1.2.3 Breakdown of Primary Interviews
2.2 Market Size Estimation
2.3 Market Breakdown & Data Triangulation
2.3.1 Market Breakdown & Data Triangulation
2.4 Research Assumptions & Limitations
3 Executive Summary (Page No. - 26)
4 Premium Insights (Page No. - 30)
4.1 Attractive Opportunities in the Market
4.2 Aquatic Herbicides Market, By Type
4.3 Market, By Application Method & Region
4.4 Asia Pacific: Aquatic Herbicides Market, By Application & Country
4.5 Market for Aquatic Herbicides Share, By Application
4.6 Market for Aquatic Herbicides, By Region
5 Market Overview (Page No. - 36)
5.1 Introduction
5.2 Value Chain Analysis
5.3 Supply Chain Analysis
5.3.1 Leading Supplier Companies
5.3.2 End Users
5.3.3 Key Influencers
5.4 Market Dynamics
5.4.1 Drivers
5.4.1.1 Growth in Adoption of Integrated Weed Control
5.4.1.2 Advantages of Aquatic Herbicides Over Other Treatment Methods
5.4.2 Restraints
5.4.2.1 Concerns Among Applicators About Fish Kills, Damage to Desirable Plants, and Effect of Herbicide Application
5.4.2.2 Prolonged Process of Product Approvals
5.4.3 Opportunities
5.4.3.1 R&D for Safer Herbicides for Humans, Fish, and Desirable Plants
5.4.3.2 High Growth Opportunities in Developing Countries
5.4.4 Challenges
5.4.4.1 Stringent Government Regulations
6 Aquatic Herbicides Market, By Type (Page No. - 43)
6.1 Introduction
6.2 Glyphosate
6.3 2,4-D
6.4 Diquat
6.5 Imazapyr
6.6 Triclopyr
6.7 Others
7 Aquatic Herbicides Market, By Mode of Action (Page No. - 53)
7.1 Introduction
7.2 Non-Selective
7.3 Selective
8 Aquatic Herbicides Market, By Application Method (Page No. - 57)
8.1 Introduction
8.2 Foliar
8.3 Submerged
9 Aquatic Herbicides Market, By Application (Page No. - 61)
9.1 Introduction
9.2 Agricultural Waters
9.3 Fisheries
9.4 Recreational Waters
9.5 Others
10 Aquatic Herbicides Market, By Region (Page No. - 67)
10.1 Introduction
10.2 North America
10.2.1 US
10.2.2 Canada
10.2.3 Mexico
10.3 Europe
10.3.1 France
10.3.2 Germany
10.3.3 UK
10.3.4 Spain
10.3.5 Italy
10.3.6 Rest of Europe
10.4 Asia Pacific
10.4.1 Australia
10.4.2 New Zealand
10.4.3 China
10.4.4 India
10.4.5 Rest of Asia Pacific
10.5 South America
10.5.1 Brazil
10.5.2 Argentina
10.5.3 Rest of South America
10.6 Rest of the World (RoW)
10.6.1 South Africa
10.6.2 Others in RoW
11 Competitive Landscape (Page No. - 101)
11.1 Overview
11.2 Competitive Scenario
11.3 Company Ranking Analysis
11.4 Expansions & Investments
11.5 Mergers & Acquisitions
11.6 Collaborations, Partnerships, and Agreements
12 Company Profiles (Page No. - 106)
(Business Overview, Products Offered, Recent Developments, MnM View, SWOT Analysis)*
12.1 DOW Chemical
12.2 BASF
12.3 Monsanto
12.4 Syngenta
12.5 Nufarm
12.6 Lonza
12.7 Land O'lakes
12.8 UPL
12.9 Platform Specialty Products
12.10 Sepro Corporation
12.11 Albaugh
12.12 Valent
12.13 Sanco Industries
*Business Overview, Products Offered, Recent Developments, MnM View, SWOT Analysis Might Not Be Captured in Case of Unlisted Companies.
13 Appendix (Page No. - 134)
13.1 Discussion Guide
13.2 Knowledge Store: Marketsandmarkets� Subscription Portal
13.3 Introducing RT: Real-Time Market Intelligence
13.4 Available Customizations
13.5 Related Reports
13.6 Author Details
List of Tables (78 Tables)
Table 1 Aquatic Herbicides Market Size, By Type, 2015�2022 (USD Million)
Table 2 Market for Aquatic Herbicides Size, By Type, 2015�2022 (MT)
Table 3 Glyphosate Market Size, By Region, 2015�2022 (USD Million)
Table 4 Glyphosate Market Size, By Region, 2015�2022 (MT)
Table 5 2,4-D Market Size, By Region, 2015�2022 (USD Million)
Table 6 2,4-D Market Size, By Region, 2015�2022 (MT)
Table 7 Diquat Market Size, By Region, 2015�2022 (USD Million)
Table 8 Diquat Market Size, By Region, 2015�2022 (MT)
Table 9 Imazapyr Market Size, By Region, 2015�2022 (USD Million)
Table 10 Imazapyr Market Size, By Region, 2015�2022 (MT)
Table 11 Triclopyr Market Size, By Region, 2015�2022 (USD Million)
Table 12 Triclopyr Market Size, By Region, 2015�2022 (MT)
Table 13 Others Market Size, By Region, 2015�2022 (USD Million)
Table 14 Others Market Size, By Region, 2015�2022 (MT)
Table 15 Aquatic Herbicides Market Size, By Mode of Action, 2015�2022 (USD Million)
Table 16 Non-Selective Market Size, By Region, 2015�2022 (USD Million)
Table 17 Selective Market Size, By Region, 2015�2022 (USD Million)
Table 18 Market for Aquatic Herbicides Size, By Application Method, 2015�2022 (USD Million)
Table 19 Foliar Application of Market Size, By Region, 2015�2022 (USD Million)
Table 20 Submerged Application of Market Size, By Region, 2015�2022 (USD Million)
Table 21 Aquatic Herbicides Market Size, By Application, 2015�2022 (USD Million)
Table 22 Market for Aquatic Herbicides Size in Agricultural Waters, By Region, 2015�2022 (USD Million)
Table 23 Market for Aquatic Herbicides Size in Fisheries, By Region, 2015�2022 (USD Million)
Table 24 Aquatic Herbicides Market Size in Recreational Waters, By Region, 2015�2022 (USD Million)
Table 25 Market for Aquatic Herbicides Size in Other Applications, By Region, 2015�2022 (USD Million)
Table 26 Market for Aquatic Herbicides Size, By Region, 2015�2022 (USD Million)
Table 27 North America: Aquatic Herbicides Market Size for Aquatic Herbicides, By Country, 2015�2022 (USD Million)
Table 28 North America: Market Size, By Type, 2015�2022 (USD Million)
Table 29 North America: Market Size, By Type, 2015�2022 (MT)
Table 30 North America: Aquatic Herbicides Market Size, By Application Method, 2015�2022 (USD Million)
Table 31 North America: Market Size, By Application, 2015�2022 (USD Million)
Table 32 North America: Market Size, By Mode of Action, 2015�2022 (USD Million)
Table 33 US: Aquatic Herbicides Market Size, By Type, 2015�2022 (USD Million)
Table 34 Canada: Market Size, By Type, 2015�2022 (USD Million)
Table 35 Mexico: Market Size, By Type, 2015�2022 (USD Million)
Table 36 Europe: Aquatic Herbicides Market Size, By Country, 2015�2022 (USD Million)
Table 37 Europe: Market Size, By Type, 2015�2022 (USD Million)
Table 38 Europe: Market Size, By Type, 2015�2022 (MT)
Table 39 Europe: Aquatic Herbicides Market Size, By Application Method, 2015�2022 (USD Million)
Table 40 Europe: Market Size, By Application, 2015�2022 (USD Million)
Table 41 Europe: Market Size, By Mode of Action, 2015�2022 (USD Million)
Table 42 France: Aquatic Herbicides Market Size, By Type, 2015�2022 (USD Million)
Table 43 Germany: Market Size, By Type, 2015�2022 (USD Million)
Table 44 UK: Aquatic Herbicides Market Size, By Type, 2015�2022 (USD Million)
Table 45 Spain: Market Size, By Type, 2015�2022 (USD Million)
Table 46 Italy: Aquatic Herbicides Market Size, By Type, 2015�2022 (USD Million)
Table 47 Rest of Europe: Aquatic Herbicides Market Size, By Type, 2015�2022 (USD Million)
Table 48 Asia Pacific: Market Size, By Country, 2015�2022 (USD Million)
Table 49 Asia Pacific: Aquatic Herbicides Market Size, By Type, 2015�2022 (USD Million)
Table 50 Asia Pacific: Market Size, By Type, 2015�2022 (MT)
Table 51 Asia Pacific: Aquatic Herbicides Market Size, By Application Method, 2015�2022 (USD Million)
Table 52 Asia Pacific: Market Size, By Application, 2015�2022 (USD Million)
Table 53 Asia Pacific: Aquatic Herbicides Market Size, By Mode of Action, 2015�2022 (USD Million)
Table 54 Australia: Market Size, By Type, 2015�2022 (USD Million)
Table 55 New Zealand: Aquatic Herbicides Market Size, By Type, 2015�2022 (USD Million)
Table 56 China: Market Size, By Type, 2015�2022 (USD Million)
Table 57 India: Aquatic Herbicides Market Size, By Type, 2015�2022 (USD Million)
Table 58 Rest of Asia Pacific: Market Size, By Type, 2015�2022 (USD Million)
Table 59 South America: Market Size, By Country, 2015�2022 (USD Million)
Table 60 South America: Aquatic Herbicides Market Size, By Type, 2015�2022 (USD Million)
Table 61 South America: Market Size, By Type, 2015�2022 (MT)
Table 62 South America: Market Size, By Application Method, 2015�2022 (USD Million)
Table 63 South America: Aquatic Herbicides Market Size, By Application, 2015�2022 (USD Million)
Table 64 South America: Market Size, By Mode of Action, 2015�2022 (USD Million)
Table 65 Brazil: Market Size, By Type, 2015�2022 (USD Million)
Table 66 Argentina: Market Size, By Type, 2015�2022 (USD Million)
Table 67 Rest of South America: Market Size for Aquatic Herbicides, By Type, 2015�2022 (USD Million)
Table 68 RoW: Market Size, By Country, 2015�2022 (USD Million)
Table 69 RoW: Aquatic Herbicides Market Size, By Type, 2015�2022 (USD Million)
Table 70 RoW: Market Size, By Type, 2015�2022 (MT)
Table 71 RoW: Aquatic Herbicides Market Size, By Application Method, 2015�2022 (USD Million)
Table 72 RoW: Market Size, By Application, 2015�2022 (USD Million)
Table 73 RoW:Market Size, By Mode of Action, 2015�2022 (USD Million)
Table 74 South Africa: Market Size, By Type, 2015�2022 (USD Million)
Table 75 Others in RoW: Aquatic Herbicides Market Size, By Type, 2015�2022 (USD Million)
Table 76 Expansions & Investments, 2016�2017
Table 77 Mergers & Acquisitions, 2013�2017
Table 78 Collaborations, Partnerships, and Agreements, 2015�2017
List of Figures (45 Figures)
Figure 1 Aquatic Herbicides Market Segmentation
Figure 2 Regional Scope
Figure 3 Market for Aquatic Herbicides: Research Design
Figure 4 Breakdown of Primary Interviews: By Company Type, Designation, and Region
Figure 5 Market Size Estimation Methodology: Bottom-Up Approach
Figure 6 Market Size Estimation Methodology: Top-Down Approach
Figure 7 Market Breakdown & Data Triangulation
Figure 8 Research Assumptions
Figure 9 Research Limitations
Figure 10 Aquatic Herbicides Market Size, By Type, 2017 vs 2022
Figure 11 Market for Aquatic Herbicides Size, By Application Method, 2017 vs 2022
Figure 12 Market for Aquatic Herbicides Size, By Application, 2017 vs 2022
Figure 13 Market for Aquatic Herbicides Share (Value), By Mode of Action, 2016
Figure 14 Market for Aquatic Herbicides Share (Value), By Region, 2016
Figure 15 Advantages of Chemical Weed Control Over Other Methods Likely to Drive the Market for Aquatic Herbicides
Figure 16 Glyphosate Segment to Lead the Market Between 2017 & 2022
Figure 17 Foliar Segment Dominated the Market in Terms of Value in All Regions in 2016
Figure 18 Non-Selective Aquatic Herbicides and Australia Accounted for the Larger Shares in Their Respective Segments in Asia Pacific in 2016
Figure 19 Agricultural Waters Dominated the Market in 2016
Figure 20 North America is Projected to Dominate the Market for Aquatic Herbicides Through 2022
Figure 21 Value Chain Analysis of Aquatic Herbicides
Figure 22 Regulatory Approvals: Vital Component of the Supply Chain
Figure 23 Market Dynamics
Figure 24 Glyphosate Segment is Projected to Grow at the Highest CAGR From 2015 to 2022
Figure 25 Non-Selective Segment is Projected to Dominate the Market Through 2022
Figure 26 Foliar Segment Projected to Dominate the Market Through 2022
Figure 27 Agricultural Waters Segment Projected to Grow at the Highest CAGR
Figure 28 North America: Market Snapshot
Figure 29 Asia Pacific: Market Snapshot
Figure 30 Key Developments By Leading Players in the Market, 2013�2017
Figure 31 Number of Developments Between 2015 and 2017
Figure 32 Ranking of Key Players in the Aquatic Herbicides Market
Figure 33 DOW Chemical: Company Snapshot
Figure 34 DOW Chemical: SWOT Analysis
Figure 35 BASF: Company Snapshot
Figure 36 BASF: SWOT Analysis
Figure 37 Monsanto: Company Snapshot
Figure 38 Monsanto: SWOT Analysis
Figure 39 Syngenta: Company Snapshot
Figure 40 Syngenta: SWOT Analysis
Figure 41 Nufarm: Company Snapshot
Figure 42 Nufarm: SWOT Analysis
Figure 43 Lonza: Company Snapshot
Figure 44 UPL: Company Snapshot
Figure 45 Platform Specialty Products: Company Snapshot


Growth opportunities and latent adjacency in Aquatic Herbicides Market