Application Virtualization Market by Component (Solutions and Services), Deployment Model, Organization Size, Vertical (BFSI, Healthcare, Government and Defense, Education, Construction, and IT and Telecom), and Region - Global Forecast to 2023


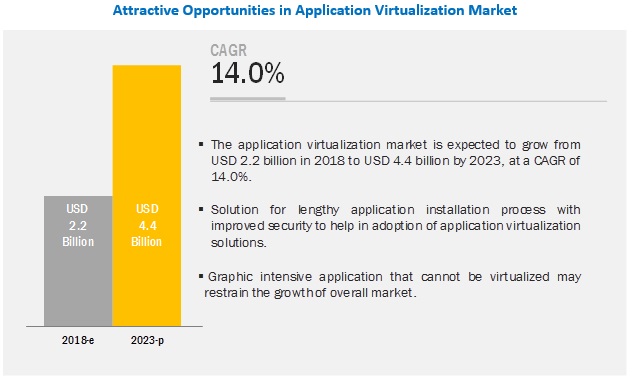
[120 Pages Report] The Application virtualization market size is expected to grow from USD 2.2 billion in 2018 to USD 4.4 billion by 2023, at a Compound Annual Growth Rate (CAGR) of 14.0% during the forecast period.The growing need for providing solutions for lengthy application installation process with improved security and simplifying the management of overall application cycle are the major growth factors for the market.
The report provides detailed insights into the Application virtualization market by component (solutions and services), deployment type, organization size, vertical, and region. Among components, the services segment is inclusive of Support and Maintenance and Training and consulting.
By Component type, the service segment is estimated to be a larger contributor to the Application virtualization market growth during the forecast period
The number of applications that is being used across industries are increasing day by day because of which the use of services such as product upgradation, maintenance, training, and consulting have also increased in the market. Services in the market are segmented into two categories, namely, support & maintenance and training & consulting. The support and maintenance service include infrastructure security and service life cycle management while the professional service include development outsourcing service and IT consulting. Most of the application virtualization vendor has dedicated support team serving the customers globally.
Increasing need of highly secure data with centralized storage infrastructure will drive the market of Application virtualization for private cloud models
In private cloud deployment models, application virtualization solution providers use private internet, which is specifically designed for implementing company-specific applications. Enterprises now-a-days generate a lot of confidential data due to which it needs to deploy a highly secure platform that uses a traditional in-house hosting cloud to deploy their applications. Enterprises opt for the private deployment model, as it provides a highly secure and centralized storage infrastructure that could only be accessed by authorized users.
Cost effective solutions and improved efficiency benefits are expected to encourage the adoption of Application virtualization solutions among SMEs
When compared to the large enterprises segment, the SMEs segment is facing challenges in terms of resources. They require enhanced infrastructures without investing much into it. Cost-effectiveness is an important need for SMEs, as they have a limited budget and therefore, face constraints with respect to marketing and gaining visibility. Moreover, for startups, the adoption of application virtualization solution and its services of an agent based or agent less model are difficult, due to high cost. However, some organizations such as NComputing are helping SMEs in providing cost efficient application virtualization solutions.
North America is estimated to account for the largest market size during the forecast period
North America is estimated to have the largest market size, among all the regions, in the application virtualization market and the trend is expected to continue till 2023. North America is the most mature market in terms of application virtualization product adoption. The market growth in this region is primarily driven by the presence of large IT companies/users and rapid technological advancements, such as digitization in the US and Canada. The presence of key players in application virtualization in the region is expected to be a major factor driving the market growth in North America. In North American region, US is the most mature market in terms of adoption of application virtualization solutions due to various factors, such as regulatory standards, advanced IT infrastructure, the presence of a large number of enterprises, and the availability of technical expertise in the country.
Key Application Virtualization Market Players
The major vendors in the market are Microsoft (US), Symantec Corporation (US), VMware (US), Citrix Systems (US), Red Hat (US), Oracle (US), Google (US), Dell (US), Micro Focus (UK), Parallels International (US), Systancia (France), Accops (India), NComputing (South Korea), Sangfor Technologies (China), NextAxiom Technology (US).
Microsoft is one of the key players in the Application virtualization market. Microsoft is a global vendor in providing a diverse set of software, licensing, and hardware products and solutions across different industrial verticals for over three decades. Microsoft prioritizes strategic partnerships with industry co-leaders to enhance its global reach and offerings. Microsoft announced a restructuring plan in July 2014 to enhance the agility and help the organization move fast and efficiently. Considering the current market scenario, Microsoft�s strategy is to create new market opportunities for its family range of cloud solutions and to increase customer satisfaction along with the improvement in service. Microsoft�s contribution of USD 14.73 billion from its revenue toward R&D would fuel its value-intensive activities which, in turn, would seed innovations and new areas of interest.
Scope of the Report
|
Report Metric |
Details |
|
Market size available for years |
2016�2023 |
|
Base year considered |
2017 |
|
Forecast period |
2018�2023 |
|
Forecast unit |
Value (USD) |
|
Segments covered |
Components, Deployment, Organization Size, Verticals, and Region |
|
Geographies covered |
North America, Asia Pacific (APAC), Europe, Latin America, and Middle East and Africa (MEA) |
|
Companies covered |
Microsoft (US), Symantec Corporation (US), VMware (US), Citrix Systems (US), Red Hat (US), Oracle (US), Google (US), Dell (US), Micro Focus (UK), Parallels International (US), Systancia (France), Accops (India), NComputing (South Korea), Sangfor Technologies (China), NextAxiom Technology (US). |
The research report categorizes the Application virtualization market to forecast the revenues and analyze the trends in each of the following subsegments:
By Component
- Solution
- Services
By Solutions
- Agent Based Solution
- Agent Less Solution
By Services
- Support and Maintenance
- Training and Consulting
By Deployment
- Public Cloud
- Private Cloud
- Hybrid Cloud
By Organization Size
- Small and Medium-sized Enterprises (SMEs)
- Large Enterprises
By Vertical
- Banking, Financial Services, and Insurance (BFSI)
- Healthcare
- IT and Telecom
- Government and Defense
- Construction
- Education
- Others (Retail, Media and Entertainment and Energy and Utilities)
By Region
- North America
- US
- Canada
- Europe
- UK
- France
- Germany
- Other European Countries
- APAC
- China
- Japan
- India
- Other APAC Countries
- MEA
- South Africa
- United Arab Emirates (UAE)
- Other MEA Countries
- Latin America
- Brazil
- Mexico
- Other Latin American Countries
Recent Developments
- In January 2019, Symantec introduced new Symantec SSL Visibility appliance (SSLV) v5.0 � a encrypted traffic management solution as a virtual appliance. SSLV v5.0 is an on-premise virtual appliance for dedicated Secure Sockets Layer (SSL)/Transport Layer Security (TLS) inspection.
Critical Questions the Report Answers:
- Where will all these developments take the industry in the mid- to long-term?
- What are the upcoming industry applications for the Application virtualization market?
- Which segment provides the most opportunity for growth?
- Who are the leading vendors operating in this market?
- What are the opportunities for new market entrants?
To speak to our analyst for a discussion on the above findings, click Speak to Analyst
 Exclusive indicates content/data unique to MarketsandMarkets and not available with any competitors.
Table of Contents
1 Introduction (Page No. - 16)
1.1 Objectives of the Study
1.2 Market Definition
1.3 Market Segmentation
1.3.1 Regions Covered
1.4 Years Considered for the Study
1.5 Currency Considered
1.6 Stakeholders
2 Research Methodology (Page No. - 19)
2.1 Research Data
2.1.1 Secondary Data
2.1.2 Primary Data
2.1.2.1 Breakup of Primaries
2.1.2.2 Key Industry Insights
2.2 Market Breakup and Data Triangulation
2.3 Market Size Estimation
2.3.1 Top-Down Approach
2.3.2 Bottom-Up Approach
2.4 Market Forecast
2.5 Microquadrant Methodology
2.6 Assumptions for the Study
2.7 Limitations of the Study
3 Executive Summary (Page No. - 26)
3.1 Attractive Growth Opportunities in the Application Virtualization Market
3.2 Market By Component, 2018
3.3 Market By Organization Size, 2018
3.4 Market By Vertical, 2018
3.5 Market Investment Scenario, 2018�2023
4 Market Overview and Industry Trends (Page No. - 31)
4.1 Introduction
4.2 Market Dynamics
4.2.1 Drivers
4.2.1.1 Need for Alternatives to the Lengthy Application Installation Process
4.2.1.2 Ability to Simplify the Application Life Cycle Management Process
4.2.2 Restraints
4.2.2.1 Application Security Concerns in Virtualized World
4.2.2.2 Performance Concerns Over Data Transfer and Retrieval From Multiple Locations
4.2.3 Opportunities
4.2.3.1 Increasing Demand for Virtualization
4.2.3.2 Increasing Adoption of Cloud-Based Technologies in SMEs
4.2.4 Challenges
4.2.4.1 Unawareness About Application Virtualization Technologies Among End Users
4.3 Use Cases
4.3.1 Healthcare
4.3.2 Manufacturing
4.3.3 Banking, Financial Services, and Insurance
4.4 Application Virtualization Architecture
5 Application Virtualization Market By Component (Page No. - 36)
5.1 Introduction
5.2 Solutions
5.2.1 Agent-Based Solution
5.2.1.1 Increasing Demand for User-Driven Automated Solutions to Drive the Growth of Agent-Based Application Virtualization Solution
5.2.2 Agentless Solution
5.2.2.1 Ease of Use, Mobility, and Operational Uniformity of Using Agentless Virtualization Solution to Drive the Growth of the Market
5.3 Services
5.3.1 Support and Maintenance Services
5.3.1.1 Increasing Deployment of Application Virtualization Solutions to Drive the Growth of Support and Maintenance Services
5.3.2 Training and Consulting Services
5.3.2.1 Demand for Training and Consulting Services to Stay Updated About Market Changes
6 Application Virtualization Market By Deployment Model (Page No. - 44)
6.1 Introduction
6.2 Public Cloud
6.2.1 Simplicity and Ease of Deployment to Drive the Demand for Public Cloud
6.3 Private Cloud
6.3.1 Need for Highly Secure Data With Centralized Storage Infrastructure to Drive the Market for Private Cloud Models
6.4 Hybrid Cloud
6.4.1 Increasing Demand for Security and Mobility to Drive the Market of Hybrid Cloud Models
7 Application Virtualization Market By Organization Size (Page No. - 46)
7.1 Introduction
7.2 Small and Medium-Sized Enterprises
7.2.1 Increasing Number of Startups Across Verticals to Lead the Demand for Application Virtualization Solutions in Small and Medium-Sized Enterprises
7.3 Large Enterprises
7.3.1 Increasing Number of Employees in Large Enterprises to Drive the Demand for Application Virtualization Solutions
8 Application Virtualization Market By Vertical (Page No. - 50)
8.1 Introduction
8.2 Banking, Financial Services, and Insurance
8.2.1 Presence of Sensitive Data and Stringent Regulations Across the BFSI Vertical to Drive the Market Growth
8.3 Healthcare
8.3.1 Application Virtualization Solutions to Enable Collaboration Between Healthcare Solution Providers and Clinicians, Colleagues, and Patients
8.4 IT and Telecom
8.4.1 Increasing Use of Digital Solutions Across IT and Telecom Vertical to Lead the Growth of Application Virtualization Solutions
8.5 Government and Defense
8.5.1 Requirement of A Simple, Cost-Effective, and Secure Solution Across Government and Defense Vertical to Drive the Market Growth
8.6 Construction
8.6.1 Increasing Demand for Secure Login Access to All Data for Construction Professionals to Lead the Market Growth of Application Virtualization
8.7 Education
8.7.1 Increasing Use of Virtual Classes and Elearning Applications to Drive the Market of Application Virtualization Solutions in the Education Vertical
8.8 Others
9 Application Virtualization Market By Region (Page No. - 59)
9.1 Introduction
9.2 North America
9.2.1 United States
9.2.1.1 Easy Availability of Technical Expertise to Drive the Growth of the US Application Virtualization Industry
9.2.2 Canada
9.2.2.1 Enabling Users to Procure Their Devices at Work to Drive the Adoption of Application Virtualization Solutions in Canada
9.3 Europe
9.3.1 United Kingdom
9.3.1.1 Growing Focus of BFSI and Government Verticals on Providing Data Security to Drive the Adoption of Application Virtualization Solutions in the UK
9.3.2 Germany
9.3.2.1 Focus of Startups to Provide New Cloud-Based Technologies By Minimizing the Overall Cost to Drive the Adoption of Application Virtualization Solutions in Germany
9.3.3 France
9.3.3.1 Growing Need Among Enterprises for Improving Operational Efficiency to Drive the Growth of the Market in France
9.3.4 Rest of Europe
9.4 Asia Pacific
9.4.1 Japan
9.4.1.1 Growing Need to Provide Efficient Application Delivery to Drive the Adoption of Application Virtualization Solutions in Japan
9.4.2 India
9.4.2.1 Implementation of Effective Desktop Virtualization Solutions in the Banking Sector to Drive the Growth of the Market in India
9.4.3 China
9.4.3.1 Adoption of Latest Cloud-Based Technologies By Key Local Players to Drive the Adoption of Application Virtualization Solutions in China
9.4.4 Rest of Asia Pacific
9.5 Latin America
9.5.1 Brazil
9.5.1.1 Focus Among Verticals, Such as BFSI and IT and Telecom, for Providing Good End-User Experience to Drive the Adoption of Application Virtualization Solutions in Brazil
9.5.2 Mexico
9.5.2.1 Adoption of Virtualization Solutions By Government Organizations to Drive the Growth of the Market in Mexico
9.5.3 Rest of Latin America
9.6 Middle East and Africa
9.6.1 United Arab Emirates
9.6.1.1 Growing Need to Provide Robust Web and Mobile Applications to Drive the Growth of the Market in the UAE
9.6.2 South Africa
9.6.2.1 Digital Transformation Initiatives in the Banking Sector to Drive the Adoption of Application Virtualization Solutions in South Africa
9.6.3 Rest of Middle East and Africa
10 Competitive Landscape (Page No. - 81)
10.1 Overview
10.2 Competitive Scenario
10.2.1 New Product Launches/Product Enhancements
10.2.2 Partnerships, Agreements, and Collaborations
10.2.3 Mergers and Acquisitions
10.3 Competitive Leadership Mapping
10.3.1 Visionary Leaders
10.3.2 Innovators
10.3.3 Dynamic
10.3.4 Emerging
11 Company Profiles (Page No. - 87)
11.1 Introduction
11.2 Microsoft
11.2.1 Business Overview
11.2.2 Products and Services Offered
11.2.3 Recent Developments
11.2.4 SWOT Analysis
11.2.5 MnM View
11.3 Symantec
11.3.1 Business Overview
11.3.2 Products and Services Offered
11.3.3 Recent Developments
11.3.4 SWOT Analysis
11.3.5 MnM View
11.4 VMware
11.4.1 Business Overview
11.4.2 Products and Services Offered
11.4.3 Recent Developments
11.4.4 SWOT Analysis
11.4.5 MnM View
11.5 Citrix Systems
11.5.1 Business Overview
11.5.2 Products and Services Offered
11.5.3 Recent Developments
11.5.4 SWOT Analysis
11.5.5 MnM View
11.6 Red Hat
11.6.1 Business Overview
11.6.2 Products and Services Offered
11.6.3 Recent Developments
11.6.4 SWOT Analysis
11.6.5 MnM View
11.7 Oracle
11.7.1 Business Overview
11.7.2 Products and Services Offered
11.7.3 Recent Developments
11.7.4 MnM View
11.8 Dell
11.8.1 Business Overview
11.8.2 Products and Services Offered
11.8.3 Recent Developments
11.8.4 MnM View
11.9 Ncomputing
11.9.1 Business Overview
11.9.2 Products and Services Offered
11.9.3 Recent Developments
11.9.4 MnM View
11.10 Google
11.10.1 Business Overview
11.10.2 Products and Services Offered
11.10.3 Recent Developments
11.10.4 MnM View
11.11 Micro Focus
11.11.1 Business Overview
11.11.2 Products and Services Offered
11.11.3 Recent Developments
11.11.4 MnM View
11.12 Parallels International
11.13 Systancia
11.14 Sangfor Technologies
11.15 Nextaxiom Technologies
11.16 Accops
12 Appendix (Page No. - 113)
12.1 Discussion Guide
12.2 Knowledge Store: Marketsandmarkets� Subscription Portal
12.3 Available Customizations
12.4 Related Reports
12.5 Author Details
List of Tables (55 Tables)
Table 1 Factor Analysis
Table 2 Application Virtualization Market Size, By Component, 2016�2023 (USD Million)
Table 3 Solutions: Market Size By Solution Type, 2016�2023 (USD Million)
Table 4 Solutions: Market Size By Region, 2016�2023 (USD Million)
Table 5 Agent-Based Solution Market Size, By Region, 2016�2023 (USD Million)
Table 6 Agentless Solution Market Size, By Region, 2016�2023 (USD Million)
Table 7 Services: Market Size By Type, 2016�2023 (USD Million)
Table 8 Services: Market Size By Region, 2016�2023 (USD Million)
Table 9 Support and Maintenance Services Market Size, By Region, 2016�2023 (USD Million)
Table 10 Training and Consulting Services Market Size, By Region, 2016�2023 (USD Million)
Table 11 Application Virtualization Market Size, By Organization Size, 2016�2023 (USD Million)
Table 12 Small and Medium-Sized Enterprises: Market Size By Region, 2016�2023 (USD Million)
Table 13 Large Enterprises: Market Size By Region, 2016�2023 (USD Million)
Table 14 Application Virtualization Market Size, By Vertical, 2016�2023 (USD Million)
Table 15 Banking, Financial Services, and Insurance: Market Size By Region, 2016�2023 (USD Million)
Table 16 Healthcare: Market Size By Region, 2016�2023 (USD Million)
Table 17 IT and Telecom: Market Size By Region, 2016�2023 (USD Million)
Table 18 Government and Defense: Market Size By Region, 2016�2023 (USD Million)
Table 19 Construction: Market Size By Region, 2016�2023 (USD Million)
Table 20 Education: Market Size By Region, 2016�2023 (USD Million)
Table 21 Others: Market Size By Region, 2016�2023 (USD Million)
Table 22 Application Virtualization Market Size, By Region, 2016�2023 (USD Million)
Table 23 North America: Market Size By Component, 2016�2023 (USD Million)
Table 24 North America: Market Size By Solution, 2016�2023 (USD Million)
Table 25 North America: Market Size By Service, 2016�2023 (USD Million)
Table 26 North America: Market Size By Organization Size, 2016�2023 (USD Million)
Table 27 North America: Market Size By Vertical, 2016�2023 (USD Million)
Table 28 North America: Market Size By Country, 2016�2023 (USD Million)
Table 29 Europe: Application Virtualization Market Size, By Component, 2016�2023 (USD Million)
Table 30 Europe: Market Size By Solution, 2016�2023 (USD Million)
Table 31 Europe: Market Size By Service, 2016�2023 (USD Million)
Table 32 Europe: Market Size By Organization Size, 2016�2023 (USD Million)
Table 33 Europe: Market Size By Vertical, 2016�2023 (USD Million)
Table 34 Europe: Market Size By Country, 2016�2023 (USD Million)
Table 35 Asia Pacific: Application Virtualization Market Size, By Component, 2016�2023 (USD Million)
Table 36 Asia Pacific: Market Size By Solution, 2016�2023 (USD Million)
Table 37 Asia Pacific: Market Size By Service, 2016�2023 (USD Million)
Table 38 Asia Pacific: Market Size By Organization Size, 2016�2023 (USD Million)
Table 39 Asia Pacific: Market Size By Vertical, 2016�2023 (USD Million)
Table 40 Asia Pacific: Market Size By Country, 2016�2023 (USD Million)
Table 41 Latin America: Application Virtualization Market Size, By Component, 2016�2023 (USD Million)
Table 42 Latin America: Market Size By Solution, 2016�2023 (USD Million)
Table 43 Latin America: Market Size By Service, 2016�2023 (USD Million)
Table 44 Latin America: Market Size By Organization Size, 2016�2023 (USD Million)
Table 45 Latin America: Market Size By Vertical, 2016�2023 (USD Million)
Table 46 Latin America: Market Size By Country, 2016�2023 (USD Million)
Table 47 Middle East and Africa: Application Virtualization Market Size, By Component, 2016�2023 (USD Million)
Table 48 Middle East and Africa: Market Size By Solution, 2016�2023 (USD Million)
Table 49 Middle East and Africa: Market Size By Service, 2016�2023 (USD Million)
Table 50 Middle East and Africa: Market Size By Organization Size, 2016�2023 (USD Million)
Table 51 Middle East and Africa: Market Size By Vertical, 2016�2023 (USD Million)
Table 52 Middle East and Africa: Application Virtualization Size, By Country, 2016�2023 (USD Million)
Table 53 New Product Launches/Product Enhancements, 2017-2019
Table 54 Partnerships, Agreements, and Collaborations, 2016-2019
Table 55 Mergers and Acquisitions, 2018
List of Figures (36 Figures)
Figure 1 Global Application Virtualization Market: Research Design
Figure 2 Market Bottom-Up and Top-Down Approaches
Figure 3 Microquadrant Matrix: Criteria Weightage
Figure 4 North America is Expected to Hold the Largest Market Share in 2018 and Asia-Pacific is Estimated to Grow at the Fastest Rate During the Forecast Period
Figure 5 Need for Simplified Application Life Cycle Management Process to Drive the Application Virtualization Market
Figure 6 Solutions Segment to Have A Higher Market Share in 2018
Figure 7 Large Enterprises Segment to Hold A Larger Market Size in 2018
Figure 8 Banking, Financial Services, and Insurance Vertical to Hold the Largest Market Size in 2018
Figure 9 Asia Pacific to Emerge as the Best Market for Investments in the Next 5 Years
Figure 10 Drivers, Restraints, Opportunities, and Challenges: Application Virtualization Market
Figure 11 Application Virtualization Architecture
Figure 12 Services Segment to Grow at A Higher CAGR During the Forecast Period
Figure 13 Agentless Solution Segment to Grow at A Higher CAGR During the Forecast Period
Figure 14 Support and Maintenance Services to Grow at A Higher CAGR During the Forecast Period
Figure 15 Small and Medium-Sized Enterprises Segment to Register A Higher CAGR During the Forecast Period
Figure 16 Healthcare Vertical to Witness the Highest CAGR During the Forecast Period
Figure 17 North America to Hold the Largest Market Size in 2018
Figure 18 North America: Market Snapshot
Figure 19 Asia Pacific: Market Snapshot
Figure 20 Key Developments in the Market During 2017�2018
Figure 21 Application Virtualization Market (Global), Competitive Leadership Mapping, 2018
Figure 22 Geographic Revenue Mix of Top 5 Players
Figure 23 Microsoft: Company Snapshot
Figure 24 SWOT Analysis: Microsoft
Figure 25 Symantec: Company Snapshot
Figure 26 SWOT Analysis: Symantec
Figure 27 VMware: Company Snapshot
Figure 28 SWOT Analysis: VMware
Figure 29 Citrix Systems: Company Snapshot
Figure 30 SWOT Analysis: Citrix Systems
Figure 31 Red Hat: Company Snapshot
Figure 32 SWOT Analysis: Red Hat
Figure 33 Oracle: Company Snapshot
Figure 34 Dell: Company Snapshot
Figure 35 Google: Company Snapshot
Figure 36 Micro Focus: Company Snapshot
The study involved 4 major activities to estimate the current market size of the Application virtualization solutions. Exhaustive secondary research was done to collect information on the market, the peer market, and the parent market. The next step was to validate these findings, assumptions, and sizing with industry experts across the value chain through primary research. Both top-down and bottom-up approaches were employed to estimate the complete market size. After that, the market breakup and data triangulation procedures were used to estimate the market size of the segments and sub segments.
Secondary Research
In the secondary research process, various secondary sources were referred to for identifying and collecting information for this study. The secondary sources included annual reports, press releases, and investor presentations of companies; whitepapers such as Cisco Cloud Index; certified publications; and articles from recognized associations, such as data center knowledge and government publishing sources. Secondary sources such as Factiva and D&B hoovers were also considered for this study. Secondary research was mainly used to obtain key information about the industry�s value chain, the total pool of key players, market classification and segmentation as per the industry trends to the bottom-most level, regional markets, and key developments from both market and technology-oriented perspectives. In this report, the market for the companies offering application virtualization solutions and services for various verticals was arrived at based on the secondary data available through paid and unpaid sources and by analyzing the product portfolio of major companies in the ecosystem and rating them on the basis of their performance and quality.
Primary Research
In the primary research process, various primary sources from both the supply and demand sides were interviewed to obtain qualitative and quantitative information for this report. Primary sources from the supply-side included industry experts, such as Chief Executive Officers (CEOs), Vice Presidents (VPs), marketing directors, technology and innovation directors, and related key executives from various key companies and organizations providing load balancer software and services. The primary sources from the demand-side included the end-users of Application virtualization solutions, which included Chief Information Officers (CIOs), IT technicians and technologists, and IT managers at public and investor-owned utilities.
The following figure depicts the breakup of the primary profiles:
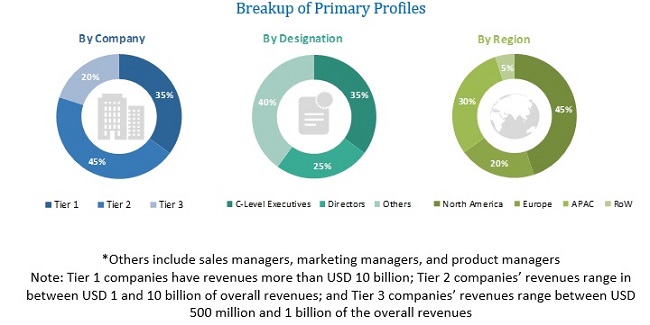
To know about the assumptions considered for the study, download the pdf brochure
Application Virtualization Market Size Estimation
Both top-down and bottom-up approaches were used to estimate and validate the total size of the Application virtualization market. They were also used extensively to estimate the size of various subsegments in the market. This entire procedure included the study of the annual and financial reports of top market players and extensive interviews for key insights from industry leaders, such as CEOs, VPs, directors, and marketing executives. All percentage splits and breakups were determined using secondary sources and verified through primary sources. The research methodology used to estimate the market size includes the following:
- The key players in the industry and markets have been identified through extensive secondary research.
- The industry�s supply chain and market size, in terms of value, have been determined through primary and secondary research processes.
- All percentage shares, splits, and breakdowns have been determined using secondary sources and verified through primary sources.
Data Triangulation
After arriving at the overall market size�using the market size estimation processes as explained above�the market was split into several segments and subsegments. To complete the overall market engineering process and arrive at the exact statistics of each market segment and subsegment, the data triangulation and market breakup procedures were employed, wherever applicable. The data was triangulated by studying several factors and trends from both, the demand and supply sides, in the Application virtualization market.
Report Objectives
- To define, segment, and project the global market size of the Application virtualization market
- To understand the structure of the market by identifying its various subsegments
- To provide detailed information about the key factors (drivers, restraints, opportunities, and industry-specific challenges) influencing the growth of the market
- To analyze the micromarkets with respect to individual growth trends, prospects, and their contribution to the total market
- To project the size of the market and its submarkets, in terms of value, with respect to the 5 major regions (along with their respective key countries)
- To profile key players and comprehensively analyze their core competencies
- To understand the competitive landscape and identify major growth strategies adopted by players across key regions
- To analyze the competitive developments, such as expansions and investments, new product launches, mergers and acquisitions, joint ventures, and agreements, in the Application virtualization market
Available Customizations
With the given market data, MarketsandMarkets offers customizations as per the company�s specific needs and on best effort basis for profiling of additional market players.


Growth opportunities and latent adjacency in Application Virtualization Market