APAC Project Portfolio Management Market by Type (Software and Service), Application (Portfolio Management, Financial Management, Resource Management), Deployment, Organization Size, Vertical and Country - Forecast to 2022


[127 Pages Report] The APAC project portfolio management market to grow from $522 Million in 2016 to reach $1,352.8 Million by 2022, at a Compound Annual Growth Rate (CAGR) of 18.2%. Factors such as huge infrastructure development in the APAC region, need for optimum resource utilization and cost management, proliferation of startups in APAC, and globalization of enterprises in the APAC region are fueling the growth of the APAC PPM Market. The base year considered for this study is 2016, and the forecast period considered is 2017�2022.
Objectives of the Study
- To describe and forecast the APAC project portfolio management market on the basis of types, applications, deployments, organization size, countries, and verticals
- To forecast the revenue of market segments with respect to the 4 main countries, namely, India, Australia and New Zealand (ANZ), China, and Singapore
- To analyze sub segments with respect to individual growth trends, future prospects, and contributions to the total market
- To provide detailed information regarding the major factors influencing the growth of the market (drivers, restraints, opportunities, and challenges)
- To analyze the opportunities in the market for stakeholders and provide details of the competitive landscape for the major players
- To profile key players and comprehensively analyze their core competencies and market positioning
- To track and analyze competitive developments, such as mergers and acquisitions; new product developments; and partnerships, agreements, and collaborations
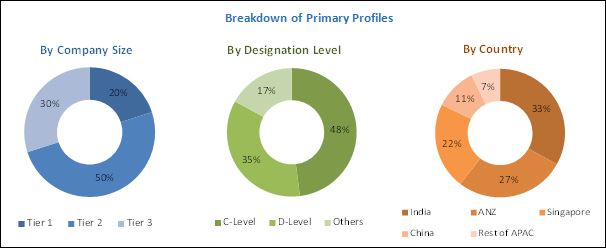
The research methodology used to estimate and forecast the APAC Project Portfolio Management market began with the capturing data on the key vendor revenues through secondary sources, such as D&B Hoovers, Bloomberg, Businessweek, EconoTimes, Factiva, Cloud Computing Association, International Trade Associations, Business Software Alliance (BSA), and National Association of Software and Services Companies (NASSCOM). Vendor offerings were also taken into consideration to determine the market segmentations. The bottom-up procedure was employed to arrive at the overall market size of the APAC PPM market from the revenue of the key market players. After arriving at the overall market size, the total market was split into several segments and subsegments, which were then verified through primary research by conducting extensive interviews with key people, such as Chief Executive Officers (CEOs), Vice Presidents (VPs), directors, and executives. The data triangulation and market breakdown procedures were employed to complete the overall market engineering process and arrive at the exact statistics for all segments. The breakdown of primary profiles is depicted in the below figure:
To know about the assumptions considered for the study, download the pdf brochure
The APAC Project Portfolio Management market ecosystem includes vendors such as Upland Software, Inc. (Texas, US), Planview, Inc. (Texas, US), Planisware S.A.S. (California, US), Oracle Corporation (California, US), Software AG (Darmstadt, Germany), SAP SE (Walldorf, Germany), Microsoft Corporation (Washington, US), Changepoint Corporation (Washington, US), CA Technologies (New York, US), Hewlett Packard Enterprise Company (California, US), Clarizen (California, US), and ServiceNow, Inc. (California, US). Other stakeholders of the APAC PPM market are cloud platform providers, consultancy and advisory firms, system integrators, training and education service providers, and application service providers.
Key Target Audience for APAC Project Portfolio Management Market
- PPM solution vendors
- Application service providers
- System integrators
- Cloud service providers
�The research study answers several questions for the stakeholders, primarily which market segments to focus on in the next 2 to 5 years for prioritizing efforts and investments.�
Scope of the Report
|
Report Metric |
Details |
|
Market size available for years |
2017�2022 |
|
Base year considered |
2016 |
|
Forecast period |
2017�2022 |
|
Forecast units |
Billion (USD) |
|
Segments covered |
Types, Applications, Deployments, Organization Size, Countries, and Verticals |
|
Geographies covered |
India, Australia and New Zealand (ANZ), China, and Singapore |
|
Companies covered |
Upland Software, Inc. (Texas, US), Planview, Inc. (Texas, US), Planisware S.A.S. (California, US), Oracle Corporation (California, US), Software AG (Darmstadt, Germany), SAP SE (Walldorf, Germany), Microsoft Corporation (Washington, US), Changepoint Corporation (Washington, US), CA Technologies (New York, US), Hewlett Packard Enterprise Company (California, US), Clarizen (California, US), and ServiceNow, Inc. (California, US) |
The research report categorizes the APAC Project Portfolio Management market to forecast the revenues and analyze the trends in each of the following submarkets:
By Type
- Software
- Services
APAC Project Portfolio Management Market By Application
- Project management
- Portfolio management
- Demand management
- Financial management
- Resource management
- Others (Risk management and time management)
APAC Project Portfolio Management Market By Deployment
- On-premises
- Cloud
APAC project portfolio management market by Organization Size
- Small and Medium-sized Enterprises (SMEs)
- Large Enterprises
By Country
- China
- ANZ
- India
- Singapore
APAC Project Portfolio Management Market By Vertical
- Banking, Financial Services, and Insurance (BFSI)
- ITES and telecommunication
- Retail and consumer goods
- Manufacturing
- Healthcare and life sciences
- Government and public sector
- Others (Education, Media and entertainment, and transportation and logistics)
Available Customizations
With the given market data, MarketsandMarkets offers customizations based on the company�s specific needs. The following customization options are available for the report:
Company Information
Detailed analysis and profiling of additional market players (up to 5)
The APAC Project Portfolio Management market size expected to grow from $586.9 Million in 2017 to $1,352.8 Million by 2022, at a Compound Annual Growth Rate (CAGR) of 18.2%. Some of the factors driving the growth of the APAC PPM market are huge infrastructure development in APAC, need for optimum resource utilization and cost management, proliferation of startups in APAC, and rapid generation of complex data volumes.
The APAC Project Portfolio Management market report has been broadly classified on the basis of types, applications, deployments, organization size, countries, and verticals. The integration and deployment services segment is expected to grow at the highest CAGR and continue its dominance during the forecast period. Integration and deployment services are gaining traction in the market, as they help organizations in identifying the project scope; designing the plan layout; optimizing data quality and delivery through testing, building, and deploying customizable designs suiting the organizational business needs; and assisting trained professionals in ensuring the smooth installation of PPM software.
The resource management application is expected to witness the highest CAGR during the forecast period. Proactive resource management delivers paramount levels of optimization and efficiency by enabling optimum allocation of resources, based on business requirements. The resource management application ensures that resources are provisioned as per organizational needs and are in alignment with overall business priorities and objectives. The need for resource management is expected to grow in the near future, due to benefits such as better resource utilization, improved profits, and minimized unavailability of resources.
The Small and Medium-sized Enterprises (SMEs) segment is expected to grow at a higher rate during the forecast period. Cost-effectiveness is one of the important needs of small businesses. Vendors satisfy this need by providing simple tools that help manage people, projects, and assets. Small businesses usually adopt Software-as-a-Service (SaaS) based PPM solutions, due to cost constraints. Additionally, the SaaS model minimizes IT requirements. The SMEs segment has huge potential for flourishing during the forecast period, as PPM software provide flexibility, scalability, and reduced costs.
The retail and consumer goods vertical is expected to grow at the highest CAGR in the APAC Project Portfolio Management market during the forecast period. The retail and consumer goods vertical leads the market in terms of cost cutting, revenue margin improvement, and latest technology adoption. Retailers are now adopting new technologies, such as location-based marketing and internal work localization, to attract customers and take full advantage of online business opportunities, which are vulnerable to various business complexities.
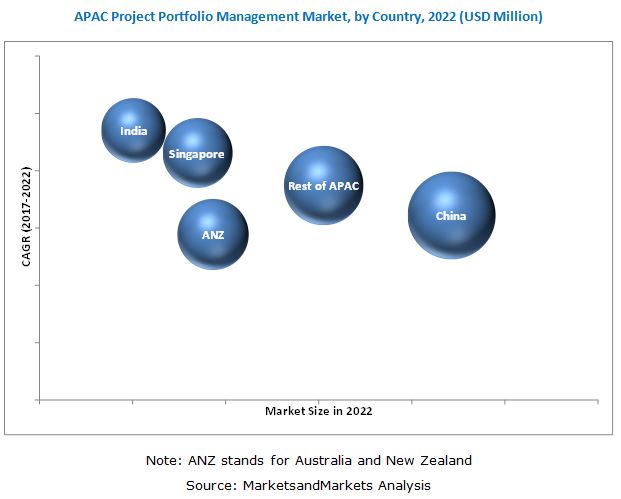
Among the countries taken into consideration for the APAC project portfolio management market study, India is expected to witness the highest CAGR during the forecast period. India is a preferred country for outsourcing IT services. Several companies have outsourced their IT services, such as application development, maintenance, testing, consulting, and system integration to India. This offshoring of IT services has given rise to a large number of IT players, who need PPM software. The rise of an energetic startup product ecosystem in India has also enhanced opportunities for the PPM market in India. The ever-increasing internet penetration, due to improvement in wireless infrastructure, is expected to drive the demand for PPM software in India. With more and more businesses in India going online, the demand for effective PPM software is expected to increase. This increasing demand will be effectively catered to by APAC PPM vendors. A healthy economy, combined with government initiatives such as Digital India, is expected to drive increased investment in PPM software and services.
To speak to our analyst for a discussion on the above findings, click Speak to Analyst
 Exclusive indicates content/data unique to MarketsandMarkets and not available with any competitors.
Table of Contents
1 Introduction (Page No. - 14)
1.1 Objectives of the Study
1.2 Market Definition
1.3 Market Scope
1.3.1 Markets Covered
1.3.2 Years Considered for the Study
1.3.3 Currency
1.4 Stakeholders
2 Research Methodology (Page No. - 17)
2.1 Research Data
2.1.1 Secondary Data
2.1.2 Primary Data
2.1.2.1 Breakdown of Primaries
2.1.2.2 Key Industry Insights
2.2 Market Size Estimation
2.3 Microquadrant Research Methodology
2.3.1 Vendor Inclusion Criteria
2.4 Research Assumptions
2.5 Limitations
3 Executive Summary (Page No. - 26)
4 Premium Insights (Page No. - 28)
4.1 Attractive Market Opportunities in the market
4.2 Market Share By Deployment Type, 2017
4.3 Market Share of the Top Four Applications and Countries, 2017
4.4 Market Investment Scenario
4.5 Market Top Three Verticals, 2017�2022
5 APAC Project Portfolio Management Market Overview and Industry Trends (Page No. - 32)
5.1 Ecosystem
5.2 Market Dynamics
5.2.1 Drivers
5.2.1.1 Huge Infrastructure Development in APAC
5.2.1.2 Optimum Resource Utilization and Cost Management
5.2.1.3 Proliferation of Startups in APAC
5.2.1.4 Globalization of APAC Enterprises, Leading to Distributed Workforce
5.2.2 Restraints
5.2.2.1 Increased Security Concerns Among Enterprises in APAC
5.2.3 Opportunities
5.2.3.1 Focus on Analytics in APAC
5.2.3.2 Digital Initiatives of APAC Governments
5.2.4 Challenges
5.2.4.1 Demand for Customized PPM Software
5.2.4.2 Integration of Traditional and Agile Methodologies
6 APAC Project Portfolio Management Market Analysis, By Type (Page No. - 37)
6.1 Introduction
6.2 Software
6.3 Services
6.3.1 Integration and Deployment
6.3.2 Support and Maintenance
6.3.3 Training, Education, and Consulting
7 APAC Project Portfolio Management Market Analysis, By Application (Page No. - 43)
7.1 Introduction
7.2 Project Management
7.3 Portfolio Management
7.4 Demand Management
7.5 Financial Management
7.6 Resource Management
7.7 Others
8 APAC Project Portfolio Management Market Analysis, By Deployment Type (Page No. - 50)
8.1 Introduction
8.2 On-Premises
8.3 Cloud
9 APAC Project Portfolio Management Market Analysis, By Organization Size (Page No. - 54)
9.1 Introduction
9.2 Small and Medium-Sized Enterprises
9.3 Large Enterprises
10 APAC Project Portfolio Management Market Analysis, By Vertical (Page No. - 58)
10.1 Introduction
10.2 Banking, Financial Services, and Insurance
10.3 Government and Public Sector
10.4 Healthcare and Life Sciences
10.5 ITes and Telecommunication
10.6 Manufacturing
10.7 Retail and Consumer Goods
10.8 Others
11 Geographic Analysis (Page No. - 65)
11.1 Introduction
11.2 China
11.3 Australia and New Zealand
11.4 India
11.5 Singapore
11.6 Rest of APAC
12 Competitive Landscape (Page No. - 84)
12.1 Microquadrant Overview
12.1.1 Visionary Leaders
12.1.2 Innovators
12.1.3 Dynamic Differentiators
12.1.4 Emerging Companies
12.2 Competitive Benchmarking
12.2.1 Strength of Product Portfolio of the Top Players in the APAC PPM Market (For 25 Players)
12.2.2 Business Strategy Excellence of the Top Players in the APAC PPM Market
13 Company Profiles (Page No. - 88)
13.1 Ca Technologies
(Overview, Strength of Product Portfolio, Business Strategy Excellence, and Recent Developments)*
13.2 Changepoint
13.3 Clarizen
13.4 HPE
13.5 Microsoft
13.6 Oracle
13.7 Planview
13.8 Planisware
13.9 SAP
13.10 Servicenow
13.11 Software AG
13.12 Upland
*Details on Overview, Strength of Product Portfolio, Business Strategy Excellence, and Recent Developments might not be captured in case of unlisted companies.
14 Appendix (Page No. - 119)
14.1 Key Industry Insights
14.2 Discussion Guide
14.3 Knowledge Store: Marketsandmarkets� Subscription Portal
14.4 Introducing RT: Real-Time Market Intelligence
14.5 Related Reports
14.6 Author Details
List of Tables (61 Tables)
Table 1 United States Dollar Exchange Rate, 2014�2016
Table 2 APAC Project Portfolio Management Market Size, 2015�2022 (USD Million)
Table 3 APAC Project Portfolio Management Market Size, By Type, 2015�2022 (USD Million)
Table 4 APAC Project Portfolio Management Market Size, By Service, 2015�2022 (USD Million)
Table 5 Integration and Deployment: Market Size, By Country, 2015�2022 (USD Million)
Table 6 Support and Maintenance: Market Size, By Country, 2015�2022 (USD Million)
Table 7 Training, Education, and Consulting: Market Size, By Country, 2015�2022(USD Million)
Table 8 APAC Project Portfolio Management Market Size, By Application, 2015�2022 (USD Million)
Table 9 Project Management: Market Size, By Country, 2015�2022 (USD Million)
Table 10 Portfolio Management: Market Size, By Country, 2015�2022 (USD Million)
Table 11 Demand Management: Market Size, By Country, 2015�2022 (USD Million)
Table 12 Financial Management: Market Size, By Country, 2015�2022 (USD Million)
Table 13 Resource Management: Market Size, By Country, 2015�2022 (USD Million)
Table 14 Others: Market Size, By Country, 2015�2022 (USD Million)
Table 15 APAC Project Portfolio Management Market Size, By Deployment Type, 2015�2022 (USD Million)
Table 16 On-Premises: Market Size, By Country, 2015�2022 (USD Million)
Table 17 Cloud: Market Size, By Country, 2015�2022 (USD Million)
Table 18 Market Size, By Organization Size, 2015�2022 (USD Million)
Table 19 Small and Medium-Sized Enterprises: Market Size, By Country, 2015�2022 (USD Million)
Table 20 Large Enterprises: Market Size, By Country, 2015�2022 (USD Million)
Table 21 APAC Project Portfolio Management Market Size, By Vertical, 2015�2022 (USD Million)
Table 22 Banking, Financial Services, and Insurance: Market Size, By Country, 2015�2022 (USD Million)
Table 23 Government and Public Sector: Market Size, By Country, 2015�2022 (USD Million)
Table 24 Healthcare and Life Sciences: Market Size, By Country, 2015�2022 (USD Million)
Table 25 ITes and Telecommunication: Market Size, By Country, 2015�2022 (USD Million)
Table 26 Manufacturing: Market Size, By Country, 2015�2022 (USD Million)
Table 27 Retail and Consumer Goods: Market Size, By Country, 2015�2022 (USD Million)
Table 28 Others: Market Size, By Country, 2015�2022 (USD Million)
Table 29 APAC Project Portfolio Management Market Size, By Country, 2015�2022 (USD Million)
Table 30 China: Market Size, By Type, 2015�2022 (USD Million)
Table 31 China: Market Size, By Service, 2015�2022 (USD Million)
Table 32 China: Market Size, By Application, 2015�2022 (USD Million)
Table 33 China: Market Size, By Deployment Type, 2015�2022(USD Million)
Table 34 China: Market Size, By Organization Size, 2015�2022 (USD Million)
Table 35 China: Market Size, By Vertical, 2015�2022 (USD Million)
Table 36 Australia and New Zealand: Market Size, 2015�2022 (USD Million)
Table 37 Australia and New Zealand: Market Size, By Type, 2015�2022 (USD Million)
Table 38 Australia and New Zealand: Market Size, By Service, 2015�2022 (USD Million)
Table 39 Australia and New Zealand: Market Size, By Application, 2015�2022 (USD Million)
Table 40 Australia and New Zealand: Market Size, By Deployment Type, 2015�2022 (USD Million)
Table 41 Australia and New Zealand: Market Size, By Organization Size, 2015�2022 (USD Million)
Table 42 Australia and New Zealand: Market Size, By Vertical, 2015�2022 (USD Million)
Table 43 India: Market Size, By Type, 2015�2022 (USD Million)
Table 44 India: Market Size, By Service, 2015�2022 (USD Million)
Table 45 India: Market Size, By Application, 2015�2022 (USD Million)
Table 46 India: Market Size, By Deployment Type, 2015�2022(USD Million)
Table 47 India: Market Size, By Organization Size, 2015�2022 (USD Million)
Table 48 India: Market Size, By Vertical, 2015�2022 (USD Million)
Table 49 Singapore: Market Size, By Type, 2015�2022 (USD Million)
Table 50 Singapore: Market Size, By Service, 2015�2022 (USD Million)
Table 51 Singapore: Market Size, By Application, 2015�2022 (USD Million)
Table 52 Singapore: Market Size, By Deployment Type, 2015�2022(USD Million)
Table 53 Singapore: Market Size, By Organization Size, 2015�2022 (USD Million)
Table 54 Singapore: Market Size, By Vertical, 2015�2022 (USD Million)
Table 55 Rest of APAC: APAC Project Portfolio Management Market Size, By Type, 2015�2022 (USD Million)
Table 56 Rest of APAC: Market Size, By Service, 2015�2022 (USD Million)
Table 57 Rest of APAC: Market Size, By Application, 2015�2022 (USD Million)
Table 58 Rest of APAC: Market Size, By Deployment Type, 2015�2022 (USD Million)
Table 59 Rest of APAC: Market Size, By Organization Size, 2015�2022(USD Million)
Table 60 Rest of APAC: Market Size, By Vertical, 2015�2022 (USD Million)
Table 61 Market: Vendor Ranking, 2017
List of Figures (33 Figures)
Figure 1 APAC Project Portfolio Management Market: Market Segmentation
Figure 2 Market: Research Design
Figure 3 Breakdown of Primary Interviews: By Company, Designation, and Country
Figure 4 Market: Data Triangulation
Figure 5 Market Size Estimation Methodology: Bottom-Up Approach
Figure 6 APAC Project Portfolio Management Market Size Estimation Methodology: Top-Down Approach
Figure 7 Competitive Leadership Mapping: Criteria Weightage
Figure 8 Competitive Leadership Mapping
Figure 9 Huge Infrastructure Development in APAC is Contributing to the Growth of the Market During the Forecast Period
Figure 10 On-Premises Deployment Type is Estimated to Hold the Larger Market Share of the Market in 2017
Figure 11 Project Management Application and China to Have the Largest Market Shares in 2017
Figure 12 Market Investment Scenario: India Would Emerge as the Best Market for Investments in the Next 5 Years
Figure 13 Banking, Financial Services, and Insurance Vertical is Expected to Have the Largest Market Size in 2017
Figure 14 APAC Project Portfolio Management Market: Ecosystem
Figure 15 APAC Project Portfolio Management Market: Drivers, Restraints, Opportunities, and Challenges
Figure 16 Services Segment is Expected to Gain Significant Traction During the Forecast Period
Figure 17 Integration and Deployment Segment is Expected to Dominate the Services Market During the Forecast Period
Figure 18 Resource Management Application is Expected to Grow at the Highest Rate During the Forecast Period
Figure 19 Cloud Segment is Expected to Gain Higher Traction During the Forecast Period
Figure 20 Large Enterprises Segment is Estimated to Hold the Larger Market Size During the Forecast Period
Figure 21 Banking, Financial Services, and Insurance Vertical is Estimated to Have the Largest Market Size During the Forecast Period
Figure 22 China is Expected to Have the Largest Market Size During the Forecast Period
Figure 23 China is Expected to Dominate the Market During the Forecast Period
Figure 24 India Market Snapshot
Figure 25 APAC Project Portfolio Management Market, Competitive Leadership Mapping, 2017
Figure 26 CA Technologies: Company Snapshot
Figure 27 HPE: Company Snapshot
Figure 28 Microsoft: Company Snapshot
Figure 29 Oracle: Company Snapshot
Figure 30 SAP: Company Snapshot
Figure 31 Servicenow: Company Snapshot
Figure 32 Software AG: Company Snapshot
Figure 33 Upland: Company Snapshot


Growth opportunities and latent adjacency in APAC Project Portfolio Management Market