Air Traffic Control (ATC) Market Size, Share & Growth Analysis

Air Traffic Control (ATC) Market by Offering (Hardware, Software & Solutions), Investment Type (Brownfield, and Greenfield), Airspace (ARTCC, TRACON, ATCT and Remote Tower), Service, Application, Airport Size and Region- Global Forecast to 2027

Report Code: AS 3053 Nov, 2022, by marketsandmarkets.com

Update:: 13.11.24

The Air Traffic Control (ATC) Market is expanding rapidly, driven by the growing demand for efficient and safe air travel management. Increasing air traffic, advancements in communication, navigation, and surveillance systems, and rising airport infrastructure investments are key factors boosting the ATC market. Modern ATC technologies enable real-time data sharing, advanced radar systems, and automated decision-making processes, enhancing the accuracy and speed of air traffic management. As global air traffic continues to rise, regulatory initiatives to modernize airspace infrastructure and increase airspace efficiency are expected to further propel market growth. This growth includes the adoption of advanced ATC systems by both commercial and military sectors worldwide.
 

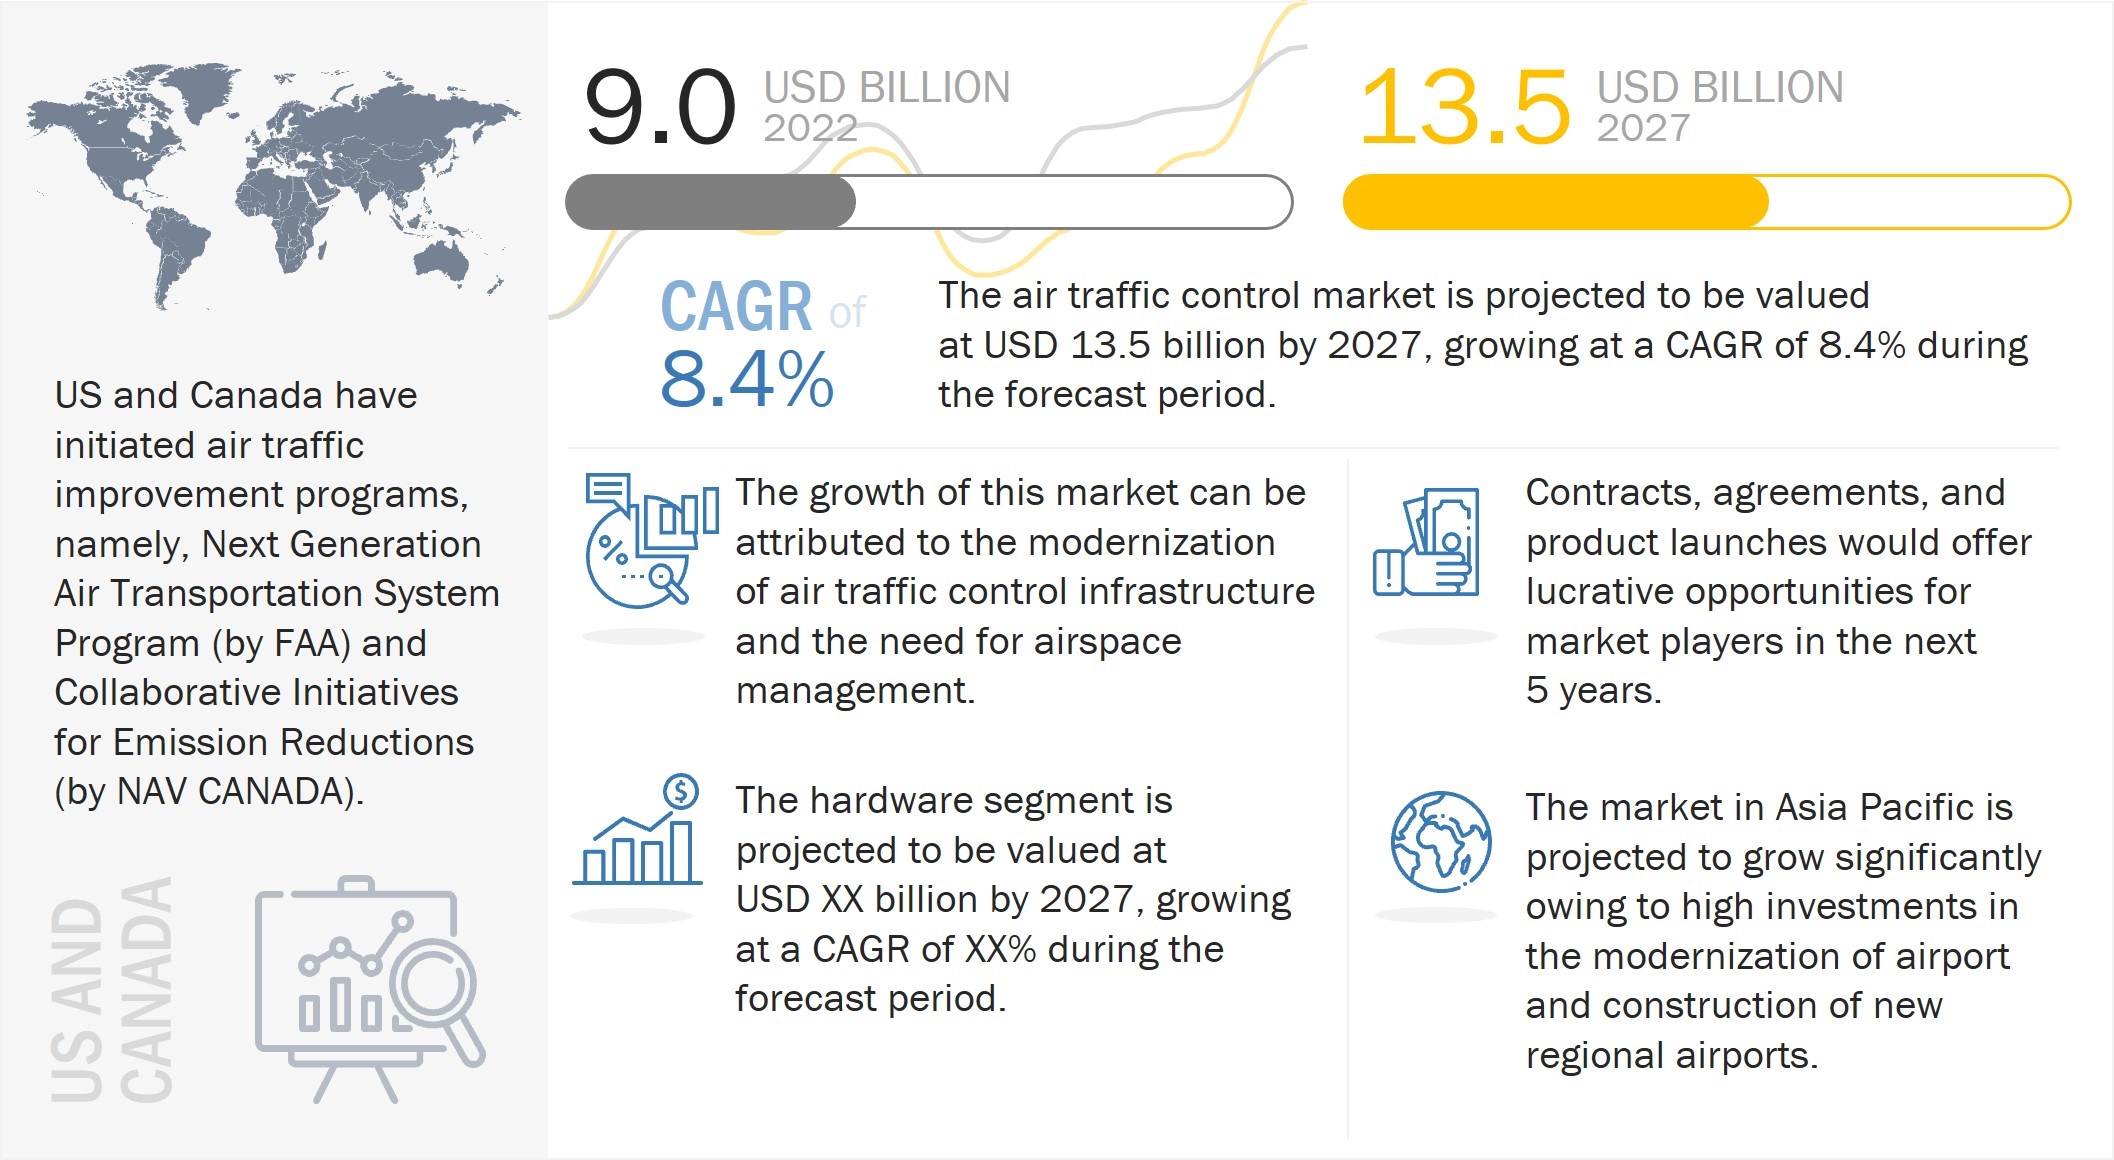
The Air traffic control (ATC) Market is estimated to be USD 9.0 billion in 2022 and is projected to reach USD 13.5 billion by 2027, at a CAGR of 8.4% from 2022 to 2027.

The ATC market is driven by factors such as NextGen air traffic management program leading to modernization of existing systems and high passenger traffic leading to high demand of Air Traffic Control Industry globally.
Air Traffic Control (ATC) Market

Air Traffic Control (ATC) Market to 2027

To know about the assumptions considered for the study, Request for Free Sample Report

COVID-19 has disturbed supply chains of several products and services in several industries. According to the ICAO safety report published in 2021, the COVID-19 pandemic has posed unprecedented challenges to international air transport. ICAO reports that passenger totals plunged by 60%, with only 1.8 billion passengers taking to the air during 2020, the first year of the pandemic, compared to 4.5 billion in 2019. Countries took this opportunity to install new surveillance radars and navigational equipment and upgrade the existing air traffic control solutions to automate them. This can be seen in the global accident rate of 2.14 accidents per million departures in 2020, a decrease of 27% from the 2019 rate of 2.94 accidents per million departures.

Air traffic control (ATC) market Dynamics

Driver: Global focus on improving air safety

The air transport industry plays a major role in global economic activity and development. One of the key elements to maintaining the vitality of civil aviation is to ensure safe, secure, efficient, and environmentally sustainable operations at the global, regional, and national levels. International Civil Aviation Organization (ICAO) promulgates Standards and Recommended Practices (SARPs) to facilitate harmonized regulations in aviation safety, security, efficiency, and environmental protection globally. According to the ICAO safety report published in 2021, the COVID-19 pandemic has posed unprecedented challenges to international air transport. ICAO reports that passenger totals plunged by 60%, with only 1.8 billion passengers taking to the air during 2020, the first year of the pandemic, compared to 4.5 billion in 2019. Countries are installing new surveillance radars and navigational equipment and upgrading the existing air traffic control solutions to automate them. This can be seen in the global accident rate of 2.14 accidents per million departures in 2020, a decrease of 27% from the 2019 rate of 2.94 accidents per million departures.

Opportunity: Adoption of satellite-based air traffic control systems

Ground-based ATC systems are operated by human controllers manually, thereby resulting in excessive delays. This may lead to passenger discomfort, fuel waste, and disruption in the schedule of airlines. The ATC market is likely to witness the transformation to next-generation satellite-based systems from ground-based systems. The primary purpose of the shift is to reduce flight delays, implement more direct flight routes, and make flying a safer and eco-friendly experience. Satellite based ATC system reduces the time of flight due to timed planning, resulting in reduced carbon foot-print. Additionally better planned flight route can save huge costs to aviation industry and its stakeholders. A satellite-based ATC system is expected to be one of the key emerging technologies in airspace management systems. During implementation, a few non-technical issues such as funding, budget reductions, and environmental impact are expected to be observed. However, there is significant scope for satellite-based navigation systems in the ATC market for navigation and surveillance applications. Due to advantages provided by satellite based ATC system, it is one of the technologies driving towards the vision of SESAR and NextGen initiatives.

Challenges: Upgrading existing aircraft with advanced air traffic control systems

Upgrading existing aircraft fleets to serve advancements in ATC poses a major challenge for the growth of the market. In emerging regions, such as Latin America, Africa, and the Asia Pacific, countries majorly have low-cost carriers that tend to lease aircraft from other larger airlines with significant fleet strengths. This trend helps low-cost airlines reduce investments and operational costs. Most aircraft leased are old and hence not implemented with technically advanced systems. Upgrading air traffic equipment with new advancements, such as satellite-based systems, would challenge many airlines in emerging countries.

The ATCT segment is estimated to account for the largest share of the Air Traffic Control (ATC) market in 2022

The ATCT is an aeronautical facility located at every airport that has regularly scheduled flights. The direction of incoming and outbound flights, on the ground and in the airfield, is vital as orientation and siting of controllers are decided based on this; this is done for maximum visibility. The main function of ATCT is to handle aircraft takeoff and landing, as well as ground traffic. Additionally, due to the configuration of terminals and airfield, the ATCT has a commanding view of all ground operations, thereby improving safety, efficiency, and security of aircraft.

Greenfield segment accounts for the highest CAGR of air traffic control (ATC) market by investment type from 2022 to 2027

Upcoming new airports in developing countries has contributed to the growth of Greenfield market. Greenfield towers are constructed on an undeveloped site, whereas brownfield towers are usually built-in developed sites and can be modified or upgraded. In greenfield investments, different types of air traffic control equipment are to be installed; however, in brownfield investments, a few or all air traffic control equipment are upgraded or modernized. Increasing airspace congestion and growing need to modernize airport infrastructure are the key factors driving the growth of the air traffic control market. A few greenfield airports are also constructed near the existing airports to effectively manage the growing air passenger traffic, as well as to address the growing requirement for increased capacity and efficiency.

For instance, in February 2018, the Prime Minister of India announced the construction of an airport at Navi Mumbai, which requires an investment of USD 2.58 billion. Also, the government plans to develop greenfield airports in 6 cities-Nizamabad, Nellore, Kurnool, Ramagundam, Tadepalligudem, and Kothagudem, which, in turn, would drive the deployment of new ATC systems at these airports

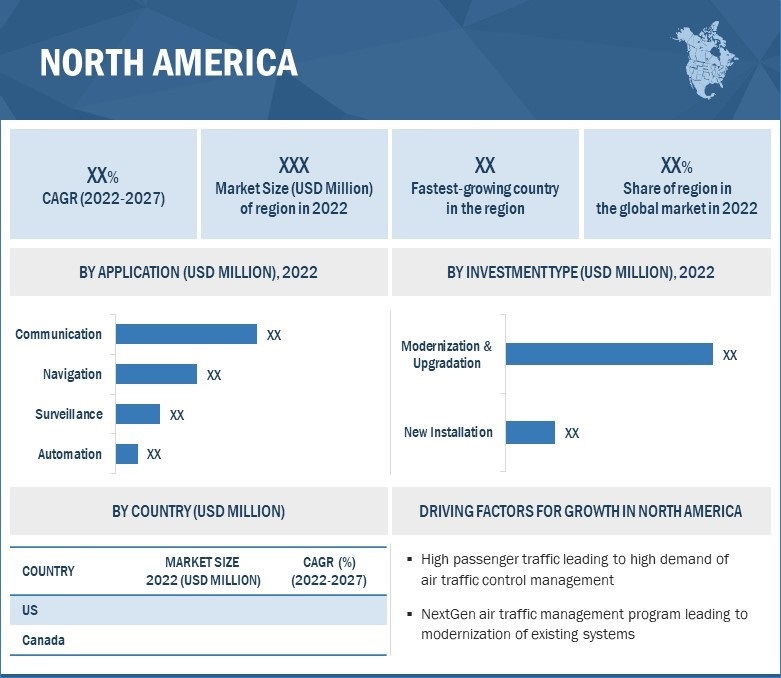
The North American market is projected to contribute the largest share in the year 2022
Air Traffic Control (ATC) Market by Region

Air Traffic Control (ATC) Market by Region

To know about the assumptions considered for the study, download the pdf brochure

Emerging Industry Trends

Remote Tower Systems

The remote tower system is a remote Air Traffic Control (ATC) room with video-sensor-based surveillance instead of the conventional out-of-the-window view from a real tower. Remote tower systems are gaining popularity as these contribute toward cost effectiveness and help airports stay competitive. Remote tower systems provide an integrated solution of subsystems that facilitate a wide range of services over conventional Air Traffic Services (ATS). High-definition real-time images are transferred via the data network to an integrated controller working position at the Remote Tower Center (RTC) as per the required airport model. It provides additional features, such as object tracking & alerting, night vision & image enhancement, and enhanced situational awareness in low visibility conditions, etc.

Key Players

The Air Traffic Control Companies are dominated by globally established players such as

Thales Group: Thales Group secured the first rank in the air traffic control market. It focuses on securing contracts to strengthen its position in the market. The company has enhanced its revenue through contracts and strategic partnerships. In March 2020, the US Federal Aviation Administration (FAA) awarded Leidos Holdings, Inc. (US) and Thales Group a contract to supply up to 142 secondary surveillance radars for the Mode S Beacon Replacement System (MSBRS). The company is working globally on leveraging the space-based Automatic Dependent Surveillance-Broadcast (ADS-B) service. 

Raytheon Technologies Corporation: Raytheon Technologies Corporation is ranked second in the air traffic control market. It provides air traffic control solutions to more than 60& of the global airspace. The company has developed strong customer relationships by partnering with potential customers and including them on Raytheon Six Sigma teams to improve its programs and overall business processes. In order to cut down costs, it has implemented lean processes, undertaken strategic supply chain initiatives, and adopted Integrated Product Development System (IPDS) and other programs to enhance production capacities.

L3harris Technologies, Inc.: L3Harris Technologies, Inc is ranked third in the air traffic control market. It provides air traffic control solutions to enable customers to integrate and manage complex programs, including US Federal Aviation Administration (FAA), other civil and military air navigation service providers (ANSPs), airports, airlines, and system integrators. The company is a prime contractor and system architect for the FAA Telecommunication Infrastructure (FTI) program, which is responsible for integrating, modernizing, and maintaining the communication infrastructure for the US air traffic control system.

Indra Sistemas, S.A.: Indra Sistemas, S.A. has been ranked fourth in the air traffic control market. It is a leading provider of ATC solutions with a strong distribution and service network. One of the key strategies adopted by the company is the in-house development of technologies and solutions instead of outsourcing these to third parties. It caters to varied industries, such as transport & traffic, public administration, energy & industry, security & defense, financial services, healthcare, and telecom & media.

Saab AB: Saab AB has been ranked fifth in the air traffic control market. It is active in the defense market, commercial aeronautics, infrastructure security, and traffic control. The company delivers solutions, services, and products both as a main supplier directly to end customers and as a subcontractor of subsystems and components. Its products are used in over 100 countries, and the company has operations in every continent. Its international operations and expansion are concentrated in Europe, US, Australia, and Brazil. Its operations are divided into 6 business areas: aeronautics, dynamics, surveillance, support and services, industrial products and services, and Kockums.

Want to explore hidden markets that can drive new revenue in Air Traffic Control (ATC) Market?

Scope of the Report

Report Metric

Details

Growth Rate (CAGR)

8.4%

Estimated Market Size in 2023

USD  9.0 Billion

Projected Market Size in 2027

USD 13.5 Billion

Market size available for years

2018–2027

Base year considered

2021

Forecast period

2022-2027

Forecast units

Value (USD Million)

Segments covered

By airpspace, application, offering, sector, investment type, and airport size

Geographies covered

North America, Europe, Asia Pacific, Middle East & Africa, and Latin America.

Companies covered

Thales Group, Indra Sistemas, S. A., Raytheon Technologies Corporation, L3Harris Technologies, Inc., Lockheed Martin Corporation (36 Companies)

Air Traffic Control (ATC): Market Highlights

The study categorizes the Air traffic control (ATC)  market based on airpspace, application, offering, sector, investment type, airport size, and region.

Aspect

Details

Air Traffic Control Market, By Airspace

  • ATCC
  • TRACON
  • Air Traffic Control Tower (ATCT)
  • Remote Towe

Air Traffic Control Market, By Application

  • Communication
  •  Navigation
  •  Surveillance
  • Automation

Air Traffic Control Market, By Offering

  • Hardware
  • Software
  • Services

Air Traffic Control Market, By Sector

  • Commercial
  • Military

Air Traffic Control Market, By Investment Type

  • Greenfield
  • Brownfield

Air Traffic Control Market, By Airport Size

  • Large
  • Medium
  • Small

Air Traffic Control Market, By Region

  • North America
  • Europe
  • Asia-Pacific
  • Middle East and Africa
  • Latin Americ

Frequently Asked Questions (FAQ):

To speak to our analyst for a discussion on the above findings, click Speak to Analyst


Exclusive indicates content/data unique to MarketsandMarkets and not available with any competitors.

TABLE OF CONTENTS
 
1 INTRODUCTION (Page No. - 45)
    1.1 STUDY OBJECTIVES 
    1.2 MARKET DEFINITION 
    1.3 MARKET SCOPE 
           FIGURE 1 AIR TRAFFIC CONTROL: MARKETS COVERED
           1.3.1 REGIONAL SCOPE
           1.3.2 YEARS CONSIDERED
    1.4 INCLUSIONS AND EXCLUSIONS 
    1.5 CURRENCY CONSIDERED 
                        TABLE 1 USD EXCHANGE RATES
    1.6 LIMITATIONS 
    1.7 MARKET STAKEHOLDERS 
    1.8 SUMMARY OF CHANGES 
 
2 RESEARCH METHODOLOGY (Page No. - 51)
    2.1 RESEARCH DATA 
           FIGURE 2 RESEARCH PROCESS FLOW
           FIGURE 3 RESEARCH DESIGN
           2.1.1 SECONDARY DATA
           2.1.2 PRIMARY DATA
                    2.1.2.1 Key data from primary sources
                    2.1.2.2 Key primary sources
                    2.1.2.3 Breakdown of primaries
           2.1.3 DEMAND-SIDE INDICATORS
           2.1.4 SUPPLY-SIDE ANALYSIS
    2.2 MARKET SIZE ESTIMATION 
           2.2.1 SEGMENTS AND SUBSEGMENTS
                    TABLE 2 AIR TRAFFIC CONTROL: SEGMENTS AND SUBSEGMENTS
    2.3 RESEARCH APPROACH AND METHODOLOGY 
           2.3.1 BOTTOM-UP APPROACH
                    TABLE 3 AIR TRAFFIC CONTROL: MARKET ESTIMATION PROCEDURE
                    2.3.1.1 Regional air traffic control market
                    2.3.1.2 Market size estimation of air traffic control market, by sector
                    2.3.1.3 Market size estimation of air traffic control market, by investment type
                               FIGURE 4 MARKET SIZE ESTIMATION METHODOLOGY: BOTTOM-UP APPROACH
           2.3.2 TOP-DOWN APPROACH
                    FIGURE 5 MARKET SIZE ESTIMATION METHODOLOGY: TOP-DOWN APPROACH
    2.4 MARKET BREAKDOWN AND DATA TRIANGULATION 
           FIGURE 6 DATA TRIANGULATION METHODOLOGY
           2.4.1 TRIANGULATION THROUGH PRIMARY AND SECONDARY RESEARCH
    2.5 GROWTH RATE ASSUMPTIONS 
    2.6 RESEARCH ASSUMPTIONS 
    2.7 RISK ASSESSMENT 
 
3 EXECUTIVE SUMMARY (Page No. - 61)
    FIGURE 7 BY AIRSPACE, ARTCC SEGMENT PROJECTED TO LEAD MARKET DURING FORECAST PERIOD
    FIGURE 8 BY OFFERING, HARDWARE SEGMENT ESTIMATED TO ACCOUNT FOR LARGER MARKET SHARE IN 2022
    FIGURE 9 BY SECTOR, COMMERCIAL SEGMENT PROJECTED TO LEAD MARKET DURING FORECAST PERIOD
    FIGURE 10 BY APPLICATION, AUTOMATION SEGMENT PROJECTED TO REGISTER HIGHEST CAGR DURING FORECAST PERIOD
    FIGURE 11 ASIA PACIFIC ESTIMATED TO HOLD LARGEST MARKET SHARE IN 2022
 
4 PREMIUM INSIGHTS (Page No. - 65)
    4.1 ATTRACTIVE OPPORTUNITIES FOR PLAYERS IN AIR TRAFFIC CONTROL MARKET 
           FIGURE 12 MODERNIZATION OF EXISTING AIRPORTS AND CONSTRUCTION OF NEW AIRPORTS TO DRIVE MARKET
    4.2 AIR TRAFFIC CONTROL MARKET, BY APPLICATION 
           FIGURE 13 COMMUNICATION SEGMENT PROJECTED TO LEAD MARKET DURING FORECAST PERIOD
    4.3 AIR TRAFFIC CONTROL MARKET, BY INVESTMENT TYPE 
           FIGURE 14 MODERNIZATION & UPGRADATION SEGMENT ESTIMATED TO ACCOUNT FOR LARGER MARKET SHARE DURING FORECAST PERIOD
    4.4 AIR TRAFFIC CONTROL MARKET, BY AIRPORT SIZE 
           FIGURE 15 MEDIUM SEGMENT ESTIMATED TO COMMAND LARGEST MARKET SHARE DURING FORECAST PERIOD
    4.5 AIR TRAFFIC CONTROL MARKET, BY COUNTRY 
           FIGURE 16 INDIA PROJECTED TO WITNESS HIGHEST CAGR FROM 2022 TO 2027
 
5 MARKET OVERVIEW (Page No. - 68)
    5.1 INTRODUCTION 
    5.2 MARKET DYNAMICS 
           FIGURE 17 MARKET DYNAMICS OF AIR TRAFFIC CONTROL MARKET
           5.2.1 DRIVERS
                    5.2.1.1 Launch of SESAR 3 Joint Undertaking program to modernize European air traffic control
                    5.2.1.2 Global focus on improving air safety
                    5.2.1.3 Modernization of air traffic control infrastructure
           5.2.2 RESTRAINTS
                    5.2.2.1 Stringent regulatory norms associated with aircraft operations
                    5.2.2.2 High cost of air traffic control equipment
           5.2.3 OPPORTUNITIES
                    5.2.3.1 Advancements in unmanned traffic control
                    5.2.3.2 Growing role of digitalization in aviation
                    5.2.3.3 Adoption of satellite-based air traffic control systems
                    5.2.3.4 Need for optimization of air traffic control
           5.2.4 CHALLENGES
                    5.2.4.1 Risk of cyber threats due to ADS–B in air traffic control
                    5.2.4.2 Limited availability of skilled personnel
                    5.2.4.3 Upgrading existing aircraft with advanced air traffic control systems
    5.3 VALUE CHAIN ANALYSIS 
           FIGURE 18 VALUE CHAIN ANALYSIS: AIR TRAFFIC CONTROL
    5.4 OPERATIONAL DATA 
           TABLE 4 NEWLY CONSTRUCTED AND UPGRADED AIRPORTS
    5.5 TECHNOLOGY ANALYSIS 
           5.5.1 SPACE-BASED ADS-B IN AIR TRAFFIC CONTROL
           5.5.2 HOLOGRAPHIC RADAR
    5.6 AIR TRAFFIC CONTROL MARKET ECOSYSTEM 
           FIGURE 19 AIR TRAFFIC CONTROL MARKET ECOSYSTEM MAP
           TABLE 5 AIR TRAFFIC CONTROL MARKET ECOSYSTEM
    5.7 DISRUPTIONS IMPACTING CUSTOMER BUSINESS 
           5.7.1 REVENUE SHIFT AND NEW REVENUE POCKETS FOR AIR TRAFFIC CONTROL MARKET
                    FIGURE 20 REVENUE SHIFT IN AIR TRAFFIC CONTROL MARKET
    5.8 AVERAGE SELLING PRICE 
           TABLE 6 AVERAGE SELLING PRICE: AIR TRAFFIC CONTROL EQUIPMENT (USD THOUSAND)
    5.9 PORTER’S FIVE FORCES ANALYSIS 
           TABLE 7 AIR TRAFFIC CONTROL MARKET: PORTER’S FIVE FORCES ANALYSIS
           FIGURE 21 AIR TRAFFIC CONTROL MARKET: PORTER’S FIVE FORCES ANALYSIS
           5.9.1 THREAT OF NEW ENTRANTS
           5.9.2 THREAT OF SUBSTITUTES
           5.9.3 BARGAINING POWER OF SUPPLIERS
           5.9.4 BARGAINING POWER OF BUYERS
           5.9.5 INTENSITY OF COMPETITIVE RIVALRY
    5.1 TARIFF AND REGULATORY LANDSCAPE 
           5.10.1 REGULATORY BODIES, GOVERNMENT AGENCIES, AND OTHER ORGANIZATIONS
                    TABLE 8 NORTH AMERICA: REGULATORY BODIES, GOVERNMENT AGENCIES, AND OTHER ORGANIZATIONS
                    TABLE 9 EUROPE: REGULATORY BODIES, GOVERNMENT AGENCIES, AND OTHER ORGANIZATIONS
                    TABLE 10 ASIA PACIFIC: REGULATORY BODIES, GOVERNMENT AGENCIES, AND OTHER ORGANIZATIONS
                    TABLE 11 MIDDLE EAST & AFRICA: REGULATORY BODIES, GOVERNMENT AGENCIES, AND OTHER ORGANIZATIONS
                    TABLE 12 LATIN AMERICA: REGULATORY BODIES, GOVERNMENT AGENCIES, AND OTHER ORGANIZATIONS
           5.10.2 INTERNATIONAL CIVIL AVIATION ORGANIZATION REGULATIONS
    5.11 KEY CONFERENCES AND EVENTS IN 2022–2023 
           TABLE 13 AIR TRAFFIC CONTROL MARKET: CONFERENCES AND EVENTS
    5.12 KEY STAKEHOLDERS AND BUYING CRITERIA 
           5.12.1 KEY STAKEHOLDERS IN BUYING PROCESS
                    FIGURE 22 INFLUENCE OF STAKEHOLDERS ON BUYING PROCESS FOR TOP 3 APPLICATIONS
                    TABLE 14 INFLUENCE OF STAKEHOLDERS ON BUYING PROCESS FOR TOP 3 APPLICATIONS (%)
           5.12.2 BUYING CRITERIA
                    FIGURE 23 KEY BUYING CRITERIA FOR TOP 3 APPLICATIONS
                    TABLE 15 KEY BUYING CRITERIA FOR TOP 3 APPLICATIONS
 
6 INDUSTRY TRENDS (Page No. - 90)
    6.1 INTRODUCTION 
    6.2 TECHNOLOGY TRENDS 
           6.2.1 5G ADOPTION IN AIR TRAFFIC CONTROL
           6.2.2 HOLOGRAPHIC RADAR
           6.2.3 TIME BASED SEPARATION (TBS) AND ENHANCED TIME BASED SEPARATION (ETBS)
           6.2.4 TRAJECTORY BASED OPERATIONS (TBO) TECHNOLOGY
           6.2.5 AI AND ML IN AIR TRAFFIC CONTROL
           6.2.6 ADS-B AND ADS-C STREAMLINING SURVEILLANCE TECHNOLOGIES
           6.2.7 TERMINAL MANEUVERING AREA (TMA) USING RNP-BASED OPERATIONS
           6.2.8 VOICE OVER INTERNET PROTOCOL (VOIP) SYSTEMS IN ATC
           6.2.9 INTERNET OF THINGS (IOT) IN ATC
           6.2.10 AIRPORT SAFETY NETS
           6.2.11 REMOTE TOWER SYSTEMS
           6.2.12 GROUND BASED AUGMENTATION SYSTEMS (GBAS)
           6.2.13 IMPROVED OPERATIONS MANAGEMENT
           6.2.14 INTEGRATING UNMANNED AERIAL VEHICLE (UAV) MOVEMENTS INTO ATC
           6.2.15 AIRSPACE OPERATION AS OPEN ARCHITECTURE IOT SYSTEM
                    TABLE 16 IOT INFRASTRUCTURE FOR ATC
           6.2.16 USE OF IOT CONCEPTS IN MANAGEMENT AND OPERATION OF INDIVIDUAL DEVICES
           6.2.17 AMAN/DMAN INTEGRATION TOOLS
    6.3 USE CASES: AIR TRAFFIC CONTROL 
           6.3.1 FLIGHT DECK INTERVAL MANAGEMENT TECHNOLOGY BY NASA
                    TABLE 17 MANAGEMENT OF AIRCRAFT ARRIVAL AT BUSY AIRPORTS USING TECHNOLOGY
           6.3.2 USE OF AI AND BLOCKCHAIN TECHNOLOGY FOR AIR TRAFFIC CONTROL
                    TABLE 18 AI-POWERED PLATFORM TO OPTIMIZE AIR TRAFFIC CONTROL
           6.3.3 SESAR 3 JOINT UNDERTAKING
                    TABLE 19 SESAR 3 JOINT UNDERTAKING
    6.4 PATENT ANALYSIS 
           TABLE 20 PATENTS RELATED TO AIR TRAFFIC CONTROL MARKET GRANTED BETWEEN 2019 AND 2022
    6.5 IMPACT OF MEGATRENDS 
 
7 AIR TRAFFIC CONTROL MARKET, BY APPLICATION (Page No. - 103)
    7.1 INTRODUCTION 
           FIGURE 24 AIR TRAFFIC CONTROL MARKET, BY APPLICATION, 2022–2027 (USD MILLION)
           TABLE 21 AIR TRAFFIC CONTROL MARKET, BY APPLICATION, 2018–2021 (USD MILLION)
           TABLE 22 AIR TRAFFIC CONTROL MARKET, BY APPLICATION, 2022–2027 (USD MILLION)
    7.2 COMMUNICATION 
           7.2.1 CONTROLLER TO PILOT DATA LINK COMMUNICATIONS (CPDLC)
                    7.2.1.1 Traffic connection with ground-based ATM systems through CPDLC
           7.2.2 VERY HIGH FREQUENCY (VHF) COMMUNICATION
                    7.2.2.1 Line of sight communication between ATC and aircraft
           7.2.3 AUTOMATIC TERMINAL INFORMATION SYSTEM (ATIS)
                    7.2.3.1 Transmission of meteorological and operational information to pilots
           7.2.4 VOICE COMMUNICATION CONTROL SYSTEM (VCCS)
                    7.2.4.1 Essential hardware for communication
    7.3 NAVIGATION 
           7.3.1 VHF OMNIDIRECTIONAL RANGE (VOR)
                    7.3.1.1 Increasing commercial and general aviation traffic to drive demand for VOR
           7.3.2 DOPPLER VERY HIGH FREQUENCY OMNI RANGE (DVOR)
                    7.3.2.1 Ground-based navigation systems for safer landing and approach at airports
           7.3.3 DISTANCE MEASURING EQUIPMENT (DME)
                    7.3.3.1 Range determination hardware for safe navigation
           7.3.4 TACTICAL AIR NAVIGATION SYSTEM (TACAN)
                    7.3.4.1 Highly precise military navigation system
           7.3.5 NON-DIRECTIONAL BEACON (NDB)
                    7.3.5.1 Essential ATM hardware for aircraft landing
           7.3.6 GLOBAL NAVIGATION SATELLITE SYSTEM (GNSS)
                    7.3.6.1 GNSS to be key element of CNS/ATM
           7.3.7 GLOBAL POSITIONING SYSTEM (GPS)
                    7.3.7.1 GPS to play prime role during landings
           7.3.8 PRECISION AREA NAVIGATION (P-RNAV)
                    7.3.8.1 P-RNAV to define routes in terminal airspace
           7.3.9 INSTRUMENT LANDING SYSTEM (ILS)
                    7.3.9.1 Increased reliability of aircraft landing
           7.3.10 ADVANCED SURFACE MOVEMENT GUIDANCE & CONTROL SYSTEM (A-SMGCS)
                    7.3.10.1 Improved guidance and surveillance for aircraft control
    7.4 SURVEILLANCE 
           7.4.1 AUTOMATIC DEPENDENT SURVEILLANCE-BROADCAST (ADS-B)
                    7.4.1.1 Demand for GPS-based modern systems to boost use of ADS-B
           7.4.2 AIR TRAFFIC CONTROL RADAR BEACON SYSTEM (ATCRBS)
                    7.4.2.1 Rotating ground antennas to fetch important aircraft data using ATCRBS
           7.4.3 PRIMARY SURVEILLANCE RADAR (PSR)
                    7.4.3.1 Essential radar systems determined at every airport for ATM using PSR
           7.4.4 SECONDARY SURVEILLANCE RADAR (SSR)
                    7.4.4.1 Enables direct exchange of data between aircraft for collision avoidance
           7.4.5 HOLOGRAPHIC RADAR
                    7.4.5.1 Widely used to detect illegal drones
    7.5 AUTOMATION 
           7.5.1 ARRIVAL AND DEPARTURE DATA MANAGER
                    7.5.1.1 Sharing of electronic data between stakeholders
           7.5.2 ELECTRONIC FLIGHT STRIP (EFS)
                    7.5.2.1 Digitally presents important information about flights in tabular form
           7.5.3 ITOWER SIMULATION SYSTEM
                    7.5.3.1 ATC simulation system for training new recruits and route planning
           7.5.4 SURVEILLANCE DATA PROCESSING SYSTEM (SDPS)
                    7.5.4.1 Takes inputs from radar, ADS-B, and MLAT systems for better efficiency
           7.5.5 FLIGHT DATA PROCESSING SYSTEM (FDPS)
                    7.5.5.1 Regarded as most important software algorithm in ATM
           7.5.6 OBSTACLE SURFACE PLANNER
                    7.5.6.1 Helps prevent air and ground aircraft accidents
           7.5.7 NETWORK SOLUTIONS
                    7.5.7.1 Likely to replace traditional ATC networks
           7.5.8 SAFETY NET AND DECISION SUPPORT (SNET)
                    7.5.8.1 Provides advance air traffic alerts for airport operations
           7.5.9 CONTROL & MONITORING DISPLAY (CMD)
                    7.5.9.1 Assists in close monitoring of air traffic
 
8 AIR TRAFFIC CONTROL MARKET, BY OFFERING (Page No. - 116)
    8.1 INTRODUCTION 
           FIGURE 25 AIR TRAFFIC CONTROL MARKET, BY OFFERING, 2022–2027 (USD MILLION)
           TABLE 23 AIR TRAFFIC CONTROL MARKET, BY OFFERING, 2018–2021 (USD MILLION)
           TABLE 24 AIR TRAFFIC CONTROL MARKET, BY OFFERING, 2022–2027 (USD MILLION)
    8.2 HARDWARE 
           8.2.1 RADAR
                    8.2.1.1 Radar upgrades in French military
           8.2.2 SENSORS
                    8.2.2.1 Increasing use of automated sensor recording, monitoring, and evaluation systems
           8.2.3 MODULATORS AND DEMODULATORS
                    8.2.3.1 Adoption of modulators & demodulators to enhance signal strength
           8.2.4 ANTENNAS
                    8.2.4.1 Use of radio frequencies to receive and transmit information
           8.2.5 CAMERAS
                    8.2.5.1 Use of HD cameras in remote digital towers to monitor out-of-line-of-sight areas
           8.2.6 DISPLAYS
                    8.2.6.1 Displays enable reading in low-light conditions
           8.2.7 ENCODERS AND DECODERS
                    8.2.7.1 Encoders & decoders widely used to analyze ADS-B messages
           8.2.8 AMPLIFIERS
                    8.2.8.1 Rising use of amplifiers in surveillance systems
           8.2.9 OTHER DEVICES
    8.3 SOFTWARE & SOLUTIONS 
           8.3.1 DATABASE MANAGEMENT SYSTEMS
                    8.3.1.1 Wide-scale usage of DBMS to increase automation
           8.3.2 RADAR DATA COMPRESSOR UNITS
                    8.3.2.1 Radar data compressor units used to upgrade primary and secondary surveillance radar
           8.3.3 INCIDENT MANAGEMENT
                    8.3.3.1 Incident management vital for ATC operations
           8.3.4 DATA LINK SERVERS
                    8.3.4.1 DLS helps link ground stations to aircraft
           8.3.5 COMMUNICATIONS RECORDING AND MANAGEMENT
                    8.3.5.1 Communications recording and management secure and record important conversations between aircraft and ATC
           8.3.6 PLATFORM AND SUITE
                    8.3.6.1 Platform and suite ease operational overview in aircraft
           8.3.7 CAPACITY AND DEMAND MANAGEMENT
                    8.3.7.1 Capacity and demand management assist in quality management of flight data
 
9 AIR TRAFFIC CONTROL MARKET, BY AIRSPACE (Page No. - 123)
    9.1 INTRODUCTION 
           FIGURE 26 AIR TRAFFIC CONTROL MARKET, BY AIRSPACE, 2022–2027 (USD MILLION)
           TABLE 25 AIR TRAFFIC CONTROL MARKET, BY AIRSPACE, 2018–2021 (USD MILLION)
           TABLE 26 AIR TRAFFIC CONTROL MARKET, BY AIRSPACE, 2022–2027 (USD MILLION)
    9.2 ARTCC 
           9.2.1 EN-ROUTE CENTER CAPABLE OF DIRECT COMMUNICATIONS WITH IFR AIR TRAFFIC ON CERTAIN FREQUENCIES
    9.3 TERMINAL RADAR APPROACH CONTROL (TRACON) 
           9.3.1 HIGH DEPENDENCY ON TRACON CENTERS
    9.4 AIR TRAFFIC CONTROL TOWER (ATCT) 
           9.4.1 ATCT HANDLES AIRCRAFT TAKE-OFF AND LANDING, AND GROUND TRAFFIC
    9.5 REMOTE TOWER (RT) 
           9.5.1 REMOTE TOWER (RT) UTILIZES VARIOUS SENSORS AT AIRPORTS TO CONVEY REAL-TIME DATA TO RTC
 
10 AIR TRAFFIC CONTROL MARKET, BY AIRPORT SIZE (Page No. - 127)
     10.1 INTRODUCTION 
             FIGURE 27 AIR TRAFFIC CONTROL MARKET, BY AIRPORT SIZE, 2022–2027 (USD MILLION)
             TABLE 27 ATC MARKET, BY AIRPORT SIZE, 2018–2021(USD MILLION)
             TABLE 28 AIR TRAFFIC CONTROL MARKET, BY AIRPORT SIZE, 2022–2027(USD MILLION)
     10.2 LARGE 
             10.2.1 ADVANCED CONTROL TOWERS REQUIRED FOR SMOOTH OPERATIONS
     10.3 MEDIUM 
             10.3.1 AIRPORTS WITH SEASONAL AIR TRAFFIC TO BENEFIT FROM REMOTE TOWERS
     10.4 SMALL 
             10.4.1 REMOTE AIR TRAFFIC CONTROL UNITS TO HELP SMALL AIRPORTS REMAIN PROFITABLE
 
11 AIR TRAFFIC CONTROL MARKET, BY SECTOR (Page No. - 131)
     11.1 INTRODUCTION 
             FIGURE 28 AIR TRAFFIC CONTROL MARKET, BY SECTOR, 2020–2027 (USD MILLION)
             TABLE 29 ATC MARKET, BY SECTOR, 2018–2021 (USD MILLION)
             TABLE 30 AIR TRAFFIC CONTROL MARKET, BY SECTOR, 2022–2027 (USD MILLION)
     11.2 COMMERCIAL 
             11.2.1 REGULAR UPGRADES TO BOOST COMMERCIAL ATC MARKET
     11.3 MILITARY 
             11.3.1 MILITARY REQUIREMENT FOR PRECISE ATC SYSTEMS
 
12 AIR TRAFFIC CONTROL MARKET, BY INVESTMENT TYPE (Page No. - 135)
     12.1 INTRODUCTION 
             FIGURE 29 AIR TRAFFIC CONTROL MARKET, BY INVESTMENT TYPE, 2022–2027 (USD MILLION)
             TABLE 31 MARKET, BY INVESTMENT TYPE, 2018–2021 (USD MILLION)
             TABLE 32 MARKET, BY INVESTMENT TYPE, 2022–2027(USD MILLION)
     12.2 NEW INSTALLATION 
             12.2.1 NEWLY INSTALLED TOWERS EQUIPPED WITH LATEST TECHNOLOGIES TO MAKE THEM MORE EFFICIENT
             12.2.2 CHINA, INDIA, AND MIDDLE EAST COUNTRIES HAVE HIGH GREENFIELD AIRPORT CAPEX INVESTMENTS
     12.3 MODERNIZATION & UPGRADATION 
             12.3.1 UPGRADES IN CURRENT EQUIPMENT TO INCREASE EFFICIENCY
 
13 AIR TRAFFIC CONTROL MARKET, BY REGION (Page No. - 139)
     13.1 INTRODUCTION 
             TABLE 33 AIR TRAFFIC CONTROL MARKET, BY REGION, 2018–2021 (USD MILLION)
             TABLE 34 AIR TRAFFIC CONTROL MARKET, BY REGION, 2022–2027 (USD MILLION)
     13.2 NORTH AMERICA 
             13.2.1 PESTLE ANALYSIS: NORTH AMERICA
                        FIGURE 30 NORTH AMERICA: AIR TRAFFIC CONTROL MARKET SNAPSHOT
             13.2.2 NORTH AMERICA: AIR PASSENGER MOVEMENT
                        FIGURE 31 NORTH AMERICA: AIR PASSENGER MOVEMENT (2012–2021)
                        TABLE 35 NORTH AMERICA: AIR TRAFFIC CONTROL MARKET, BY COUNTRY, 2018–2021 (USD MILLION)
                        TABLE 36 NORTH AMERICA: MARKET, BY COUNTRY, 2022–2027 (USD MILLION)
                        TABLE 37 NORTH AMERICA: MARKET, BY APPLICATION, 2018–2021 (USD MILLION)
                        TABLE 38 NORTH AMERICA: MARKET, BY APPLICATION, 2022–2027 (USD MILLION)
                        TABLE 39 NORTH AMERICA: MARKET, BY OFFERING, 2018–2021 (USD MILLION)
                        TABLE 40 NORTH AMERICA: MARKET, BY OFFERING, 2022–2027 (USD MILLION)
                        TABLE 41 NORTH AMERICA: MARKET, BY INVESTMENT TYPE, 2018–2021 (USD MILLION)
                        TABLE 42 NORTH AMERICA: MARKET, BY INVESTMENT TYPE, 2022–2027 (USD MILLION)
                        TABLE 43 NORTH AMERICA: MARKET, BY SECTOR, 2018–2021 (USD MILLION)
                        TABLE 44 NORTH AMERICA: ATC MARKET, BY SECTOR, 2022–2027 (USD MILLION)
             13.2.3 US
                        13.2.3.1 NextGen program for modernization of existing ATC systems to drive market
                                     TABLE 45 US: AIR TRAFFIC CONTROL MARKET, BY APPLICATION, 2018–2021 (USD MILLION)
                                     TABLE 46 US: MARKET, BY APPLICATION, 2022–2027 (USD MILLION)
                                     TABLE 47 US: MARKET, BY INVESTMENT TYPE, 2018–2021 (USD MILLION)
                                     TABLE 48 US: MARKET, BY INVESTMENT TYPE, 2022–2027 (USD MILLION)
                                     TABLE 49 US: MARKET, BY SECTOR, 2018–2021 (USD MILLION)
                                     TABLE 50 US: ATC MARKET, BY SECTOR, 2022–2027 (USD MILLION)
             13.2.4 CANADA
                        13.2.4.1 Multi-Fleet Air Traffic Control Avionics Project to fuel market growth
                                     TABLE 51 CANADA: AIR TRAFFIC CONTROL MARKET, BY APPLICATION, 2018–2021 (USD MILLION)
                                     TABLE 52 CANADA: MARKET, BY APPLICATION, 2022–2027 (USD MILLION)
                                     TABLE 53 CANADA: MARKET, BY INVESTMENT TYPE, 2018–2021 (USD MILLION)
                                     TABLE 54 CANADA: MARKET, BY INVESTMENT TYPE, 2022–2027 (USD MILLION)
                                     TABLE 55 CANADA: MARKET, BY SECTOR, 2018–2021 (USD MILLION)
                                     TABLE 56 CANADA: MARKET, BY SECTOR, 2022–2027 (USD MILLION)
     13.3 EUROPE 
             13.3.1 PESTLE ANALYSIS: EUROPE
                        FIGURE 32 EUROPE: AIR TRAFFIC CONTROL MARKET SNAPSHOT
             13.3.2 EUROPE: AIR PASSENGER MOVEMENT
                        FIGURE 33 EUROPE: AIR PASSENGER MOVEMENT (2012–2021)
                        TABLE 57 EUROPE: AIR TRAFFIC CONTROL MARKET, BY COUNTRY, 2018–2021 (USD MILLION)
                        TABLE 58 EUROPE: MARKET, BY COUNTRY, 2022–2027 (USD MILLION)
                        TABLE 59 EUROPE: MARKET, BY APPLICATION, 2018–2021 (USD MILLION)
                        TABLE 60 EUROPE: MARKET, BY APPLICATION, 2022–2027 (USD MILLION)
                        TABLE 61 EUROPE: ATC MARKET, BY OFFERING, 2018–2021 (USD MILLION)
                        TABLE 62 EUROPE: MARKET, BY OFFERING, 2022–2027 (USD MILLION)
                        TABLE 63 EUROPE: MARKET, BY INVESTMENT TYPE, 2018–2021 (USD MILLION)
                        TABLE 64 EUROPE: MARKET, BY INVESTMENT TYPE, 2022–2027 (USD MILLION)
                        TABLE 65 EUROPE: AIR TRAFFIC CONTROL MARKET, BY SECTOR, 2018–2021 (USD MILLION)
                        TABLE 66 EUROPE: ATC MARKET, BY SECTOR, 2022–2027 (USD MILLION)
             13.3.3 UK
                        13.3.3.1 Airport congestion to lead to modernization of ATC systems
                                     TABLE 67 UK: AIR TRAFFIC CONTROL MARKET, BY APPLICATION, 2018–2021 (USD MILLION)
                                     TABLE 68 UK: MARKET, BY APPLICATION, 2022–2027 (USD MILLION)
                                     TABLE 69 UK: MARKET, BY INVESTMENT TYPE, 2018–2021 (USD MILLION)
                                     TABLE 70 UK: MARKET, BY INVESTMENT TYPE, 2022–2027 (USD MILLION)
                                     TABLE 71 UK: MARKET, BY SECTOR, 2018–2021 (USD MILLION)
                                     TABLE 72 UK: MARKET, BY SECTOR, 2022–2027 (USD MILLION)
             13.3.4 FRANCE
                        13.3.4.1 Modernization and expansion of existing airports to aid market growth
                                     TABLE 73 FRANCE: AIR TRAFFIC CONTROL MARKET, BY APPLICATION, 2018–2021 (USD MILLION)
                                     TABLE 74 FRANCE: MARKET, BY APPLICATION, 2022–2027 (USD MILLION)
                                     TABLE 75 FRANCE: MARKET, BY INVESTMENT TYPE, 2018–2021 (USD MILLION)
                                     TABLE 76 FRANCE: MARKET, BY INVESTMENT TYPE, 2022–2027 (USD MILLION)
                                     TABLE 77 FRANCE: MARKET, BY SECTOR, 2018–2021 (USD MILLION)
                                     TABLE 78 FRANCE: ATC MARKET, BY SECTOR, 2022–2027 (USD MILLION)
             13.3.5 SWEDEN
                        13.3.5.1 Increasing adoption of remote air traffic services to raise demand for ATC solutions
                                     TABLE 79 SWEDEN: AIR TRAFFIC CONTROL MARKET, BY APPLICATION, 2018–2021 (USD MILLION)
                                     TABLE 80 SWEDEN: MARKET, BY APPLICATION, 2022–2027 (USD MILLION)
                                     TABLE 81 SWEDEN: MARKET, BY INVESTMENT TYPE, 2018–2021 (USD MILLION)
                                     TABLE 82 SWEDEN: MARKET, BY INVESTMENT TYPE, 2022–2027 (USD MILLION)
                                     TABLE 83 SWEDEN: MARKET, BY SECTOR, 2018–2021 (USD MILLION)
                                     TABLE 84 SWEDEN: MARKET, BY SECTOR, 2022–2027 (USD MILLION)
             13.3.6 GERMANY
                        13.3.6.1 Implementation of remote control towers at airports to drive market
                                     TABLE 85 GERMANY: AIR TRAFFIC CONTROL MARKET, BY APPLICATION, 2018–2021 (USD MILLION)
                                     TABLE 86 GERMANY: MARKET, BY APPLICATION, 2022–2027 (USD MILLION)
                                     TABLE 87 GERMANY: MARKET, BY INVESTMENT TYPE, 2018–2021 (USD MILLION)
                                     TABLE 88 GERMANY: MARKET, BY INVESTMENT TYPE, 2022–2027 (USD MILLION)
                                     TABLE 89 GERMANY: MARKET, BY SECTOR, 2018–2021 (USD MILLION)
                                     TABLE 90 GERMANY: MARKET, BY SECTOR, 2022–2027 (USD MILLION)
             13.3.7 ITALY
                        13.3.7.1 Digital transformation of air traffic control to speed up market growth
                                     TABLE 91 ITALY: AIR TRAFFIC CONTROL MARKET, BY APPLICATION, 2018–2021 (USD MILLION)
                                     TABLE 92 ITALY: MARKET, BY APPLICATION, 2022–2027 (USD MILLION)
                                     TABLE 93 ITALY: MARKET, BY INVESTMENT TYPE, 2018–2021 (USD MILLION)
                                     TABLE 94 ITALY: MARKET, BY INVESTMENT TYPE, 2022–2027 (USD MILLION)
                                     TABLE 95 ITALY: MARKET, BY SECTOR, 2018–2021 (USD MILLION)
                                     TABLE 96 ITALY: MARKET, BY SECTOR, 2022–2027 (USD MILLION)
             13.3.8 SPAIN
                        13.3.8.1 Need for digitization of air traffic control to drive market
                                     TABLE 97 SPAIN: AIR TRAFFIC CONTROL MARKET, BY APPLICATION, 2018–2021 (USD MILLION)
                                     TABLE 98 SPAIN: ATC MARKET, BY APPLICATION, 2022–2027 (USD MILLION)
                                     TABLE 99 SPAIN: MARKET, BY INVESTMENT TYPE, 2018–2021 (USD MILLION)
                                     TABLE 100 SPAIN: MARKET, BY INVESTMENT TYPE, 2022–2027 (USD MILLION)
                                     TABLE 101 SPAIN: MARKET, BY SECTOR, 2018–2021 (USD MILLION)
                                     TABLE 102 SPAIN: ATC MARKET, BY SECTOR, 2022–2027 (USD MILLION)
             13.3.9 REST OF EUROPE
                        13.3.9.1 Increase in domestic and international air passenger traffic to accelerate demand for ATC
                                     TABLE 103 REST OF EUROPE: AIR TRAFFIC CONTROL MARKET, BY APPLICATION, 2018–2021 (USD MILLION)
                                     TABLE 104 REST OF EUROPE: ATC MARKET, BY APPLICATION, 2022–2027 (USD MILLION)
                                     TABLE 105 REST OF EUROPE: MARKET, BY INVESTMENT TYPE, 2018–2021 (USD MILLION)
                                     TABLE 106 REST OF EUROPE: MARKET, BY INVESTMENT TYPE, 2022–2027 (USD MILLION)
                                     TABLE 107 REST OF EUROPE: MARKET, BY SECTOR, 2018–2021 (USD MILLION)
                                     TABLE 108 REST OF EUROPE: MARKET, BY SECTOR, 2022–2027 (USD MILLION)
     13.4 ASIA PACIFIC 
             13.4.1 PESTLE ANALYSIS: ASIA PACIFIC
                        FIGURE 34 ASIA PACIFIC: AIR TRAFFIC CONTROL MARKET SNAPSHOT
             13.4.2 ASIA PACIFIC: AIR PASSENGER MOVEMENT
                        FIGURE 35 ASIA PACIFIC: AIR PASSENGER MOVEMENT (2012–2021)
                        TABLE 109 ASIA PACIFIC: ATC MARKET, BY COUNTRY, 2018–2021 (USD MILLION)
                        TABLE 110 ASIA PACIFIC: MARKET, BY COUNTRY, 2022–2027 (USD MILLION)
                        TABLE 111 ASIA PACIFIC: MARKET, BY APPLICATION, 2018–2021 (USD MILLION)
                        TABLE 112 ASIA PACIFIC: MARKET, BY APPLICATION, 2022–2027 (USD MILLION)
                        TABLE 113 ASIA PACIFIC: MARKET, BY OFFERING, 2018–2021 (USD MILLION)
                        TABLE 114 ASIA PACIFIC: MARKET, BY OFFERING, 2022–2027 (USD MILLION)
                        TABLE 115 ASIA PACIFIC: MARKET, BY INVESTMENT TYPE, 2018–2021 (USD MILLION)
                        TABLE 116 ASIA PACIFIC: MARKET, BY INVESTMENT TYPE, 2022–2027 (USD MILLION)
                        TABLE 117 ASIA PACIFIC: ATC MARKET, BY SECTOR, 2018–2021 (USD MILLION)
                        TABLE 118 ASIA PACIFIC: AIR TRAFFIC CONTROL MARKET, BY SECTOR, 2022–2027 (USD MILLION)
             13.4.3 CHINA
                        13.4.3.1 Upcoming greenfield airport projects to boost ATC growth
                                     TABLE 119 CHINA: AIR TRAFFIC CONTROL MARKET, BY APPLICATION, 2018–2021 (USD MILLION)
                                     TABLE 120 CHINA: MARKET, BY APPLICATION, 2022–2027 (USD MILLION)
                                     TABLE 121 CHINA: MARKET, BY INVESTMENT TYPE, 2018–2021 (USD MILLION)
                                     TABLE 122 CHINA: MARKET, BY INVESTMENT TYPE, 2022–2027 (USD MILLION)
                                     TABLE 123 CHINA: MARKET, BY SECTOR, 2018–2021 (USD MILLION)
                                     TABLE 124 CHINA: ATC MARKET, BY SECTOR, 2022–2027 (USD MILLION)
             13.4.4 INDIA
                        13.4.4.1 Government focus on increasing regional connectivity to propel market growth
                                     TABLE 125 INDIA: ATC MARKET, BY APPLICATION, 2018–2021 (USD MILLION)
                                     TABLE 126 INDIA: AIR TRAFFIC CONTROL MARKET, BY APPLICATION, 2022–2027 (USD MILLION)
                                     TABLE 127 INDIA: MARKET, BY INVESTMENT TYPE, 2018–2021 (USD MILLION)
                                     TABLE 128 INDIA: MARKET, BY INVESTMENT TYPE, 2022–2027 (USD MILLION)
                                     TABLE 129 INDIA: MARKET, BY SECTOR, 2018–2021 (USD MILLION)
                                     TABLE 130 INDIA: ATC MARKET, BY SECTOR, 2022–2027 (USD MILLION)
             13.4.5 SOUTH KOREA
                        13.4.5.1 Need to upgrade ILS and DME at airports to drive market
                                     TABLE 131 SOUTH KOREA: AIR TRAFFIC CONTROL MARKET, BY APPLICATION, 2018–2021 (USD MILLION)
                                     TABLE 132 SOUTH KOREA: MARKET, BY APPLICATION, 2022–2027 (USD MILLION)
                                     TABLE 133 SOUTH KOREA: MARKET, BY INVESTMENT TYPE, 2018–2021 (USD MILLION)
                                     TABLE 134 SOUTH KOREA: MARKET, BY INVESTMENT TYPE, 2022–2027 (USD MILLION)
                                     TABLE 135 SOUTH KOREA: MARKET, BY SECTOR, 2018–2021 (USD MILLION)
                                     TABLE 136 SOUTH KOREA: MARKET, BY SECTOR, 2022–2027 (USD MILLION)
             13.4.6 AUSTRALIA
                        13.4.6.1 Increase in air travel to aid market growth
                                     TABLE 137 AUSTRALIA: ATC MARKET, BY APPLICATION, 2018–2021 (USD MILLION)
                                     TABLE 138 AUSTRALIA: AIR TRAFFIC CONTROL MARKET, BY APPLICATION, 2022–2027 (USD MILLION)
                                     TABLE 139 AUSTRALIA: MARKET, BY INVESTMENT TYPE, 2018–2021 (USD MILLION)
                                     TABLE 140 AUSTRALIA: MARKET, BY INVESTMENT TYPE, 2022–2027 (USD MILLION)
                                     TABLE 141 AUSTRALIA: MARKET, BY SECTOR, 2018–2021 (USD MILLION)
                                     TABLE 142 AUSTRALIA: MARKET, BY SECTOR, 2022–2027 (USD MILLION)
             13.4.7 NEW ZEALAND
                        13.4.7.1 Wide-scale adoption of remote tower technology to fuel market growth
                                     TABLE 143 NEW ZEALAND: AIR TRAFFIC CONTROL MARKET, BY APPLICATION, 2018–2021 (USD MILLION)
                                     TABLE 144 NEW ZEALAND: MARKET, BY APPLICATION, 2022–2027 (USD MILLION)
                                     TABLE 145 NEW ZEALAND: MARKET, BY INVESTMENT TYPE, 2018–2021 (USD MILLION)
                                     TABLE 146 NEW ZEALAND: MARKET, BY INVESTMENT TYPE, 2022–2027 (USD MILLION)
                                     TABLE 147 NEW ZEALAND: MARKET, BY SECTOR, 2018–2021 (USD MILLION)
                                     TABLE 148 NEW ZEALAND: MARKET, BY SECTOR, 2022–2027 (USD MILLION)
             13.4.8 REST OF ASIA PACIFIC
                        13.4.8.1 Focus on airport upgrades and modernization to drive market
                                     TABLE 149 REST OF ASIA PACIFIC: AIR TRAFFIC CONTROL MARKET, BY APPLICATION, 2018–2021 (USD MILLION)
                                     TABLE 150 REST OF ASIA PACIFIC: MARKET, BY APPLICATION, 2022–2027 (USD MILLION)
                                     TABLE 151 REST OF ASIA PACIFIC: MARKET, BY INVESTMENT TYPE, 2018–2021 (USD MILLION)
                                     TABLE 152 REST OF ASIA PACIFIC: MARKET, BY INVESTMENT TYPE, 2022–2027 (USD MILLION)
                                     TABLE 153 REST OF ASIA PACIFIC: MARKET, BY SECTOR, 2018–2021 (USD MILLION)
                                     TABLE 154 REST OF ASIA PACIFIC: MARKET, BY SECTOR, 2022–2027 (USD MILLION)
     13.5 MIDDLE EAST & AFRICA 
             13.5.1 PESTLE ANALYSIS: MIDDLE EAST & AFRICA
             13.5.2 MIDDLE EAST & AFRICA: AIR PASSENGER MOVEMENT
                        FIGURE 36 MIDDLE EAST & AFRICA: AIR PASSENGER MOVEMENT (2012–2021)
                        TABLE 155 MIDDLE EAST & AFRICA: AIR TRAFFIC CONTROL MARKET, BY COUNTRY, 2018–2021 (USD MILLION)
                        TABLE 156 MIDDLE EAST & AFRICA: MARKET, BY COUNTRY, 2022–2027 (USD MILLION)
                        TABLE 157 MIDDLE EAST & AFRICA: MARKET, BY APPLICATION, 2018–2021 (USD MILLION)
                        TABLE 158 MIDDLE EAST & AFRICA: MARKET, BY APPLICATION, 2022–2027 (USD MILLION)
                        TABLE 159 MIDDLE EAST & AFRICA: MARKET, BY OFFERING, 2018–2021 (USD MILLION)
                        TABLE 160 MIDDLE EAST & AFRICA: MARKET, BY OFFERING, 2022–2027 (USD MILLION)
                        TABLE 161 MIDDLE EAST & AFRICA: MARKET, BY INVESTMENT TYPE, 2018–2021 (USD MILLION)
                        TABLE 162 MIDDLE EAST & AFRICA: MARKET, BY INVESTMENT TYPE, 2022–2027 (USD MILLION)
                        TABLE 163 MIDDLE EAST & AFRICA: ATC MARKET, BY SECTOR, 2018–2021 (USD MILLION)
                        TABLE 164 MIDDLE EAST & AFRICA: AIR TRAFFIC CONTROL MARKET, BY SECTOR, 2022–2027 (USD MILLION)
             13.5.3 UAE
                        13.5.3.1 Increasing tourism to drive demand for air traffic control and airport modernization
                                     TABLE 165 UAE: AIR TRAFFIC CONTROL MARKET, BY APPLICATION, 2018–2021 (USD MILLION)
                                     TABLE 166 UAE: MARKET, BY APPLICATION, 2022–2027 (USD MILLION)
                                     TABLE 167 UAE: MARKET, BY INVESTMENT TYPE, 2018–2021 (USD MILLION)
                                     TABLE 168 UAE: MARKET, BY INVESTMENT TYPE, 2022–2027 (USD MILLION)
                                     TABLE 169 UAE: MARKET, BY SECTOR, 2018–2021 (USD MILLION)
                                     TABLE 170 UAE: MARKET, BY SECTOR, 2022–2027 (USD MILLION)
             13.5.4 SAUDI ARABIA
                        13.5.4.1 Relaunch of airport privatization plans to encourage market growth
                                     TABLE 171 SAUDI ARABIA: AIR TRAFFIC CONTROL MARKET, BY APPLICATION, 2018–2021 (USD MILLION)
                                     TABLE 172 SAUDI ARABIA: MARKET, BY APPLICATION, 2022–2027 (USD MILLION)
                                     TABLE 173 SAUDI ARABIA: MARKET, BY INVESTMENT TYPE, 2018–2021 (USD MILLION)
                                     TABLE 174 SAUDI ARABIA: MARKET, BY INVESTMENT TYPE, 2022–2027 (USD MILLION)
                                     TABLE 175 SAUDI ARABIA: MARKET, BY SECTOR, 2018–2021 (USD MILLION)
                                     TABLE 176 SAUDI ARABIA: ATC MARKET, BY SECTOR, 2022–2027 (USD MILLION)
             13.5.5 SOUTH AFRICA
                        13.5.5.1 Modernization of airports and increasing tourism to support market growth
                                     TABLE 177 SOUTH AFRICA: AIR TRAFFIC CONTROL MARKET, BY APPLICATION, 2018–2021 (USD MILLION)
                                     TABLE 178 SOUTH AFRICA: MARKET, BY APPLICATION, 2022–2027 (USD MILLION)
                                     TABLE 179 SOUTH AFRICA: MARKET, BY INVESTMENT TYPE, 2018–2021 (USD MILLION)
                                     TABLE 180 SOUTH AFRICA: MARKET, BY INVESTMENT TYPE, 2022–2027 (USD MILLION)
                                     TABLE 181 SOUTH AFRICA: MARKET, BY SECTOR, 2018–2021 (USD MILLION)
                                     TABLE 182 SOUTH AFRICA: ATC MARKET, BY SECTOR, 2022–2027 (USD MILLION)
             13.5.6 REST OF MIDDLE EAST & AFRICA
                        13.5.6.1 Use of advanced automated air traffic control
                                     TABLE 183 REST OF MIDDLE EAST & AFRICA: AIR TRAFFIC CONTROL MARKET, BY APPLICATION, 2018–2021 (USD MILLION)
                                     TABLE 184 REST OF MIDDLE EAST & AFRICA: MARKET, BY APPLICATION, 2022–2027 (USD MILLION)
                                     TABLE 185 REST OF MIDDLE EAST & AFRICA: MARKET, BY INVESTMENT TYPE, 2018–2021 (USD MILLION)
                                     TABLE 186 REST OF MIDDLE EAST & AFRICA: MARKET, BY INVESTMENT TYPE, 2022–2027 (USD MILLION)
                                     TABLE 187 REST OF MIDDLE EAST & AFRICA: MARKET, BY SECTOR, 2018–2021 (USD MILLION)
                                     TABLE 188 REST OF MIDDLE EAST & AFRICA: MARKET, BY SECTOR, 2022–2027 (USD MILLION)
     13.6 LATIN AMERICA 
             13.6.1 PESTLE ANALYSIS: LATIN AMERICA
             13.6.2 LATIN AMERICA: AIR PASSENGER MOVEMENT
                        FIGURE 37 LATIN AMERICA: AIR PASSENGER MOVEMENT (2012–2021)
                        TABLE 189 LATIN AMERICA: AIR TRAFFIC CONTROL MARKET, BY COUNTRY, 2018–2021 (USD MILLION)
                        TABLE 190 LATIN AMERICA: MARKET, BY COUNTRY, 2022–2027 (USD MILLION)
                        TABLE 191 LATIN AMERICA: MARKET, BY APPLICATION, 2018–2021 (USD MILLION)
                        TABLE 192 LATIN AMERICA: MARKET, BY APPLICATION, 2022–2027 (USD MILLION)
                        TABLE 193 LATIN AMERICA: ATC MARKET, BY OFFERING, 2018–2021 (USD MILLION)
                        TABLE 194 LATIN AMERICA: MARKET, BY OFFERING, 2022–2027 (USD MILLION)
                        TABLE 195 LATIN AMERICA: MARKET, BY INVESTMENT TYPE, 2018–2021 (USD MILLION)
                        TABLE 196 LATIN AMERICA: MARKET, BY INVESTMENT TYPE, 2022–2027 (USD MILLION)
                        TABLE 197 LATIN AMERICA: MARKET, BY SECTOR, 2018–2021 (USD MILLION)
                        TABLE 198 LATIN AMERICA: ATC MARKET, BY SECTOR, 2022–2027 (USD MILLION)
             13.6.3 BRAZIL
                        13.6.3.1 Modernization of airports and increased tourism traffic
                                     TABLE 199 BRAZIL: AIR TRAFFIC CONTROL MARKET, BY APPLICATION, 2018–2021 (USD MILLION)
                                     TABLE 200 BRAZIL: MARKET, BY APPLICATION, 2022–2027 (USD MILLION)
                                     TABLE 201 BRAZIL: MARKET, BY INVESTMENT TYPE, 2018–2021 (USD MILLION)
                                     TABLE 202 BRAZIL: MARKET, BY INVESTMENT TYPE, 2022–2027 (USD MILLION)
                                     TABLE 203 BRAZIL: MARKET, BY SECTOR, 2018–2021 (USD MILLION)
                                     TABLE 204 BRAZIL: ATC MARKET, BY SECTOR, 2022–2027 (USD MILLION)
             13.6.4 MEXICO
                        13.6.4.1 Presence of several midsized airports to elevate demand for ATC solutions
                                     TABLE 205 MEXICO: AIR TRAFFIC CONTROL MARKET, BY APPLICATION, 2018–2021 (USD MILLION)
                                     TABLE 206 MEXICO: MARKET, BY APPLICATION, 2022–2027 (USD MILLION)
                                     TABLE 207 MEXICO: MARKET, BY INVESTMENT TYPE, 2018–2021 (USD MILLION)
                                     TABLE 208 MEXICO: MARKET, BY INVESTMENT TYPE, 2022–2027 (USD MILLION)
                                     TABLE 209 MEXICO: MARKET, BY SECTOR, 2018–2021 (USD MILLION)
                                     TABLE 210 MEXICO: ATC MARKET, BY SECTOR, 2022–2027 (USD MILLION)
             13.6.5 ARGENTINA
                        13.6.5.1 Modernization of air control centers projected to fuel market growth
                                     TABLE 211 ARGENTINA: AIR TRAFFIC CONTROL MARKET, BY APPLICATION, 2018–2021 (USD MILLION)
                                     TABLE 212 ARGENTINA: MARKET, BY APPLICATION, 2022–2027 (USD MILLION)
                                     TABLE 213 ARGENTINA: MARKET, BY INVESTMENT TYPE, 2018–2021 (USD MILLION)
                                     TABLE 214 ARGENTINA: MARKET, BY INVESTMENT TYPE, 2022–2027 (USD MILLION)
                                     TABLE 215 ARGENTINA: MARKET, BY SECTOR, 2018–2021 (USD MILLION)
                                     TABLE 216 ARGENTINA: ATC MARKET, BY SECTOR, 2022–2027 (USD MILLION)
             13.6.6 REST OF LATIN AMERICA
                        13.6.6.1 Continued surge in tourism and airport expansion plans to fuel market
                                     TABLE 217 REST OF LATIN AMERICA: ATC MARKET, BY APPLICATION, 2018–2021 (USD MILLION)
                                     TABLE 218 REST OF LATIN AMERICA: MARKET, BY APPLICATION, 2022–2027 (USD MILLION)
                                     TABLE 219 REST OF LATIN AMERICA: MARKET, BY INVESTMENT TYPE, 2018–2021 (USD MILLION)
                                     TABLE 220 REST OF LATIN AMERICA: MARKET, BY INVESTMENT TYPE, 2022–2027 (USD MILLION)
                                     TABLE 221 REST OF LATIN AMERICA: MARKET, BY SECTOR, 2018–2021 (USD MILLION)
                                     TABLE 222 REST OF LATIN AMERICA: MARKET, BY SECTOR, 2022–2027 (USD MILLION)
 
14 COMPETITIVE LANDSCAPE (Page No. - 212)
     14.1 INTRODUCTION 
     14.2 COMPETITIVE OVERVIEW 
             14.2.1 KEY DEVELOPMENTS OF LEADING PLAYERS IN AIR TRAFFIC CONTROL MARKET (2018–2021)
                        TABLE 223 KEY DEVELOPMENTS OF LEADING PLAYERS: AIR TRAFFIC CONTROL MARKET
     14.3 RANKING ANALYSIS OF KEY MARKET PLAYERS, 2021 
             FIGURE 38 RANKING ANALYSIS OF TOP FIVE PLAYERS IN AIR TRAFFIC CONTROL MARKET, 2021
     14.4 REVENUE ANALYSIS, 2019–2021 
             FIGURE 39 REVENUE ANALYSIS OF KEY COMPANIES
     14.5 MARKET SHARE ANALYSIS, 2021 
             FIGURE 40 MARKET SHARE ANALYSIS OF KEY COMPANIES
             TABLE 224 AIR TRAFFIC CONTROL MARKET: DEGREE OF COMPETITION
     14.6 COMPANY EVALUATION QUADRANT 
             14.6.1 STARS
             14.6.2 EMERGING LEADERS
             14.6.3 PERVASIVE PLAYERS
             14.6.4 PARTICIPANTS
                        FIGURE 41 MARKET COMPETITIVE LEADERSHIP MAPPING, 2021
             14.6.5 COMPETITIVE BENCHMARKING
                        TABLE 225 AIR TRAFFIC CONTROL MARKET: COMPETITIVE BENCHMARKING
     14.7 COMPETITIVE SCENARIO 
             14.7.1 PRODUCT LAUNCHES
                        TABLE 226 AIR TRAFFIC CONTROL MARKET: PRODUCT LAUNCHES, APRIL 2020–OCTOBER 2021
             14.7.2 DEALS
                        TABLE 227 AIR TRAFFIC CONTROL MARKET: DEALS, APRIL 2022–OCTOBER 2022
 
15 COMPANY PROFILES (Page No. - 222)
(Business Overview, Products Offered, Recent Developments, MnM View Right to win, Strategic choices made, Weaknesses and competitive threats) *  
     15.1 INTRODUCTION 
     15.2 KEY PLAYERS 
             15.2.1 THALES GROUP
                        TABLE 228 THALES GROUP: BUSINESS OVERVIEW
                        FIGURE 42 THALES GROUP: COMPANY SNAPSHOT
                        TABLE 229 THALES GROUP: PRODUCTS
                        TABLE 230 THALES GROUP: PRODUCT LAUNCHES
                        TABLE 231 THALES GROUP: DEALS
             5.2.2 RAYTHEON TECHNOLOGIES CORPORATION
                        TABLE 232 RAYTHEON TECHNOLOGIES CORPORATION: BUSINESS OVERVIEW
                        FIGURE 43 RAYTHEON TECHNOLOGIES CORPORATION: COMPANY SNAPSHOT
                        TABLE 233 RAYTHEON TECHNOLOGIES CORPORATION: PRODUCTS
                        TABLE 234 RAYTHEON TECHNOLOGIES CORPORATION: DEALS
             15.2.3 L3HARRIS TECHNOLOGIES, INC.
                        TABLE 235 L3HARRIS TECHNOLOGIES, INC.: BUSINESS OVERVIEW
                        FIGURE 44 L3HARRIS TECHNOLOGIES, INC.: COMPANY SNAPSHOT
                        TABLE 236 L3HARRIS TECHNOLOGIES, INC.: PRODUCTS
                        TABLE 237 L3HARRIS TECHNOLOGIES, INC.: DEALS
             15.2.4 INDRA SISTEMAS, S.A.
                        TABLE 238 INDRA SISTEMAS, S.A.: BUSINESS OVERVIEW
                        FIGURE 45 INDRA SISTEMAS, S.A.: COMPANY SNAPSHOT
                        TABLE 239 INDRA SISTEMAS, S.A.: PRODUCTS
                        TABLE 240 INDRA SISTEMAS, S.A.: DEALS
             15.2.5 SAAB AB
                        TABLE 241 SAAB AB: BUSINESS OVERVIEW
                        FIGURE 46 SAAB AB: COMPANY SNAPSHOT
                        TABLE 242 SAAB AB: PRODUCTS
                        TABLE 243 SAAB AB: DEALS
                        TABLE 244 SAAB AB: OTHERS
             15.2.6 NORTHROP GRUMMAN CORPORATION
                        TABLE 245 NORTHROP GRUMMAN CORPORATION: BUSINESS OVERVIEW
                        FIGURE 47 NORTHROP GRUMMAN CORPORATION: COMPANY SNAPSHOT
                        TABLE 246 NORTHROP GRUMMAN CORPORATION: PRODUCTS
                        TABLE 247 NORTHROP GRUMMAN CORPORATION: DEALS
             15.2.7 SITA GROUP
                        TABLE 248 SITA GROUP: BUSINESS OVERVIEW
                        TABLE 249 SITA GROUP: PRODUCTS
                        TABLE 250 SITA GROUP: DEALS
             15.2.8 BAE SYSTEMS PLC
                        TABLE 251 BAE SYSTEMS PLC: BUSINESS OVERVIEW
                        FIGURE 48 BAE SYSTEMS PLC: COMPANY SNAPSHOT
                        TABLE 252 BAE SYSTEMS PLC: PRODUCTS
                        TABLE 253 BAE SYSTEMS PLC: DEALS
             15.2.9 FREQUENTIS AG
                        TABLE 254 FREQUENTIS AG: BUSINESS OVERVIEW
                        FIGURE 49 FREQUENTIS AG: COMPANY SNAPSHOT
                        TABLE 255 FREQUENTIS AG: PRODUCTS
                        TABLE 256 FREQUENTIS AG: DEALS
             15.2.10 HONEYWELL INTERNATIONAL, INC.
                        TABLE 257 HONEYWELL INTERNATIONAL, INC.: BUSINESS OVERVIEW
                        FIGURE 50 HONEYWELL INTERNATIONAL, INC.: COMPANY SNAPSHOT
                        TABLE 258 HONEYWELL INTERNATIONAL, INC.: PRODUCTS
                        TABLE 259 HONEYWELL INTERNATIONAL, INC.: DEALS
             15.2.11 ADVANCED NAVIGATION AND POSITIONING CORPORATION
                        TABLE 260 ADVANCED NAVIGATION AND POSITIONING CORPORATION: BUSINESS OVERVIEW
                        TABLE 261 ADVANCED NAVIGATION AND POSITIONING CORPORATION: PRODUCTS
             15.2.12 LOCKHEED MARTIN CORPORATION
                        TABLE 262 LOCKHEED MARTIN CORPORATION: BUSINESS OVERVIEW
                        FIGURE 51 LOCKHEED MARTIN CORPORATION: COMPANY SNAPSHOT
                        TABLE 263 LOCKHEED MARTIN CORPORATION: PRODUCTS
                        TABLE 264 LOCKHEED MARTIN CORPORATION: DEALS
             15.2.13 INTELCAN TECHNOSYSTEMS INC.
                        TABLE 265 INTELCAN TECHNOSYSTEMS INC.: BUSINESS OVERVIEW
                        TABLE 266 INTELCAN TECHNOSYSTEMS INC.: PRODUCTS
                        TABLE 267 INTELCAN TECHNOSYSTEMS INC.: DEALS
             15.2.14 AMADEUS IT GROUP, S.A.
                        TABLE 268 AMADEUS IT GROUP, S.A.: BUSINESS OVERVIEW
                        FIGURE 52 AMADEUS IT GROUP, S.A.: COMPANY SNAPSHOT
                        TABLE 269 AMADEUS IT GROUP, S.A.: PRODUCTS
                        TABLE 270 AMADEUS IT GROUP, S.A.: DEALS
             15.2.15 LEONARDO S.P.A.
                        TABLE 271 LEONARDO S.P.A.: BUSINESS OVERVIEW
                        FIGURE 53 LEONARDO S.P.A.: COMPANY SNAPSHOT
                        TABLE 272 LEONARDO S.P.A.: PRODUCTS
                        TABLE 273 LEONARDO S.P.A.: PRODUCT LAUNCHES
             15.2.16 ADACEL TECHNOLOGIES, LTD.
                        TABLE 274 ADACEL TECHNOLOGIES, LTD.: BUSINESS OVERVIEW
                        FIGURE 54 ADACEL TECHNOLOGIES, LTD.: COMPANY SNAPSHOT
                        TABLE 275 ADACEL TECHNOLOGIES, LTD.: PRODUCTS
                        TABLE 276 ADACEL TECHNOLOGIES, LTD.: PRODUCT LAUNCHES
                        TABLE 277 ADACEL TECHNOLOGIES, LTD.: DEALS
             15.2.17 ACAMS AIRPORT TOWER SOLUTIONS
                        TABLE 278 ACAMS AIRPORT TOWER SOLUTIONS: BUSINESS OVERVIEW
                        TABLE 279 ACAMS AIRPORT TOWER SOLUTIONS: PRODUCTS
                        TABLE 280 ACAMS AIRPORT TOWER SOLUTIONS: DEALS
             15.2.18 SKYSOFT-ATM
                        TABLE 281 SKYSOFT-ATM: BUSINESS OVERVIEW
                        TABLE 282 SKYSOFT-ATM: PRODUCTS
                        TABLE 283 SKYSOFT-ATM: DEALS
             15.2.19 AQUILA AIR TRAFFIC MANAGEMENT SERVICES LIMITED
                        TABLE 284 AQUILA AIR TRAFFIC MANAGEMENT SERVICES LIMITED: BUSINESS OVERVIEW
                        TABLE 285 AQUILA AIR TRAFFIC MANAGEMENT SERVICES LIMITED: PRODUCTS
                        TABLE 286 AQUILA AIR TRAFFIC MANAGEMENT SERVICES LIMITED: DEALS
             15.2.20 LEIDOS HOLDINGS, INC.
                        TABLE 287 LEIDOS HOLDINGS, INC.: BUSINESS OVERVIEW
                        FIGURE 55 LEIDOS HOLDINGS, INC.: COMPANY SNAPSHOT
                        TABLE 288 LEIDOS HOLDINGS, INC.: PRODUCTS
                        TABLE 289 LEIDOS HOLDINGS, INC.: DEALS
             15.2.21 NATS HOLDINGS
                        TABLE 290 NATS HOLDINGS: BUSINESS OVERVIEW
             15.2.22 SEARIDGE TECHNOLOGIES
                        TABLE 291 SEARIDGE TECHNOLOGIES: BUSINESS OVERVIEW
             15.2.23 ARTISYS S.R.O.
                        TABLE 292 ARTISYS S.R.O.: BUSINESS OVERVIEW
             15.2.24 NAV CANADA
                        TABLE 293 NAV CANADA: COMPANY OVERVIEW
             15.2.25 ALTYS TECHNOLOGIES
                        TABLE 294 ALTYS TECHNOLOGIES: COMPANY OVERVIEW
             15.2.26 SAIPHER ATC
                        TABLE 295 SAIPHER ATC: COMPANY OVERVIEW
             15.2.27 CYRRUS LIMITED
                        TABLE 296 CYRRUS LIMITED: COMPANY OVERVIEW
             15.2.28 IDS AIRNAV
                        TABLE 297 IDS AIRNAV: COMPANY OVERVIEW
     15.3 OTHER PLAYERS 
             15.3.1 FEDERAL AVIATION ADMINISTRATION (FAA)
                        TABLE 298 FEDERAL AVIATION ADMINISTRATION (FAA): BUSINESS OVERVIEW
             15.3.2 DEUTSCHE FLUGSICHERUNG (DFS)
                        TABLE 299 DEUTSCHE FLUGSICHERUNG (DFS): BUSINESS OVERVIEW
             15.3.3 ENAV S.P.A
                        TABLE 300 ENAV S.P.A: BUSINESS OVERVIEW
             15.3.4 AIRPORTS AUTHORITY OF INDIA (AAI)
                        TABLE 301 AIRPORTS AUTHORITY OF INDIA (AAI): BUSINESS OVERVIEW
             15.3.5 SAUDI AIR NAVIGATION SERVICES (SANS)
                        TABLE 302 SAUDI AIR NAVIGATION SERVICES (SANS): BUSINESS OVERVIEW
             15.3.6 HIGHLANDS AND ISLANDS AIRPORTS LIMITED (HIAL)
                        TABLE 303 HIGHLANDS AND ISLANDS AIRPORTS LIMITED (HIAL): BUSINESS OVERVIEW
             15.3.7 DIRECTION DES SERVICES DE LA NAVIGATION AERIENNE (DSNA)
                        TABLE 304 DIRECTION DES SERVICES DE LA NAVIGATION AERIENNE (DSNA): BUSINESS OVERVIEW
*Details on Business Overview, Products Offered, Recent Developments, MnM View, Right to win, Strategic choices made, Weaknesses and competitive threats might not be captured in case of unlisted companies.  
 
16 APPENDIX (Page No. - 288)
     16.1 DISCUSSION GUIDE 
     16.2 KNOWLEDGESTORE: MARKETSANDMARKETS’ SUBSCRIPTION PORTAL 
     16.3 CUSTOMIZATION OPTIONS 
     16.4 RELATED REPORTS 
     16.5 AUTHOR DETAILS 
 

The study involved four major activities in estimating the current size of the air traffic control (ATC)  market. Exhaustive secondary research was done to collect information on the market, peer market, and parent market. The next step was to validate these findings, assumptions, and sizing with industry experts across the value chain through primary research. Both top-down and bottom-up approaches were employed to estimate the complete market size. After that, market breakdown and data triangulation were used to estimate the market size of segments and subsegments.

Secondary Research

The market share of companies offering air traffic control (ATC)  was arrived at based on the secondary data available through paid and unpaid sources and by analyzing the product portfolios of major companies and rating them based on their performance and quality.

In the secondary research process, sources such as government sources; SIPRI; corporate filings such as annual reports, press releases, and investor presentations of companies; white papers, journals, and certified publications; and articles by recognized authors, directories, and databases were used to identify and collect information for this study.

Secondary research was mainly used to obtain key information about the industry’s value and supply chain and to identify the key players by various products, market classifications, and segmentation according to their offerings and industry trends related to air traffic control (ATC)  towers, components, platforms, services, and regions, and key developments from both, market- and technology-oriented perspectives.

Primary Research

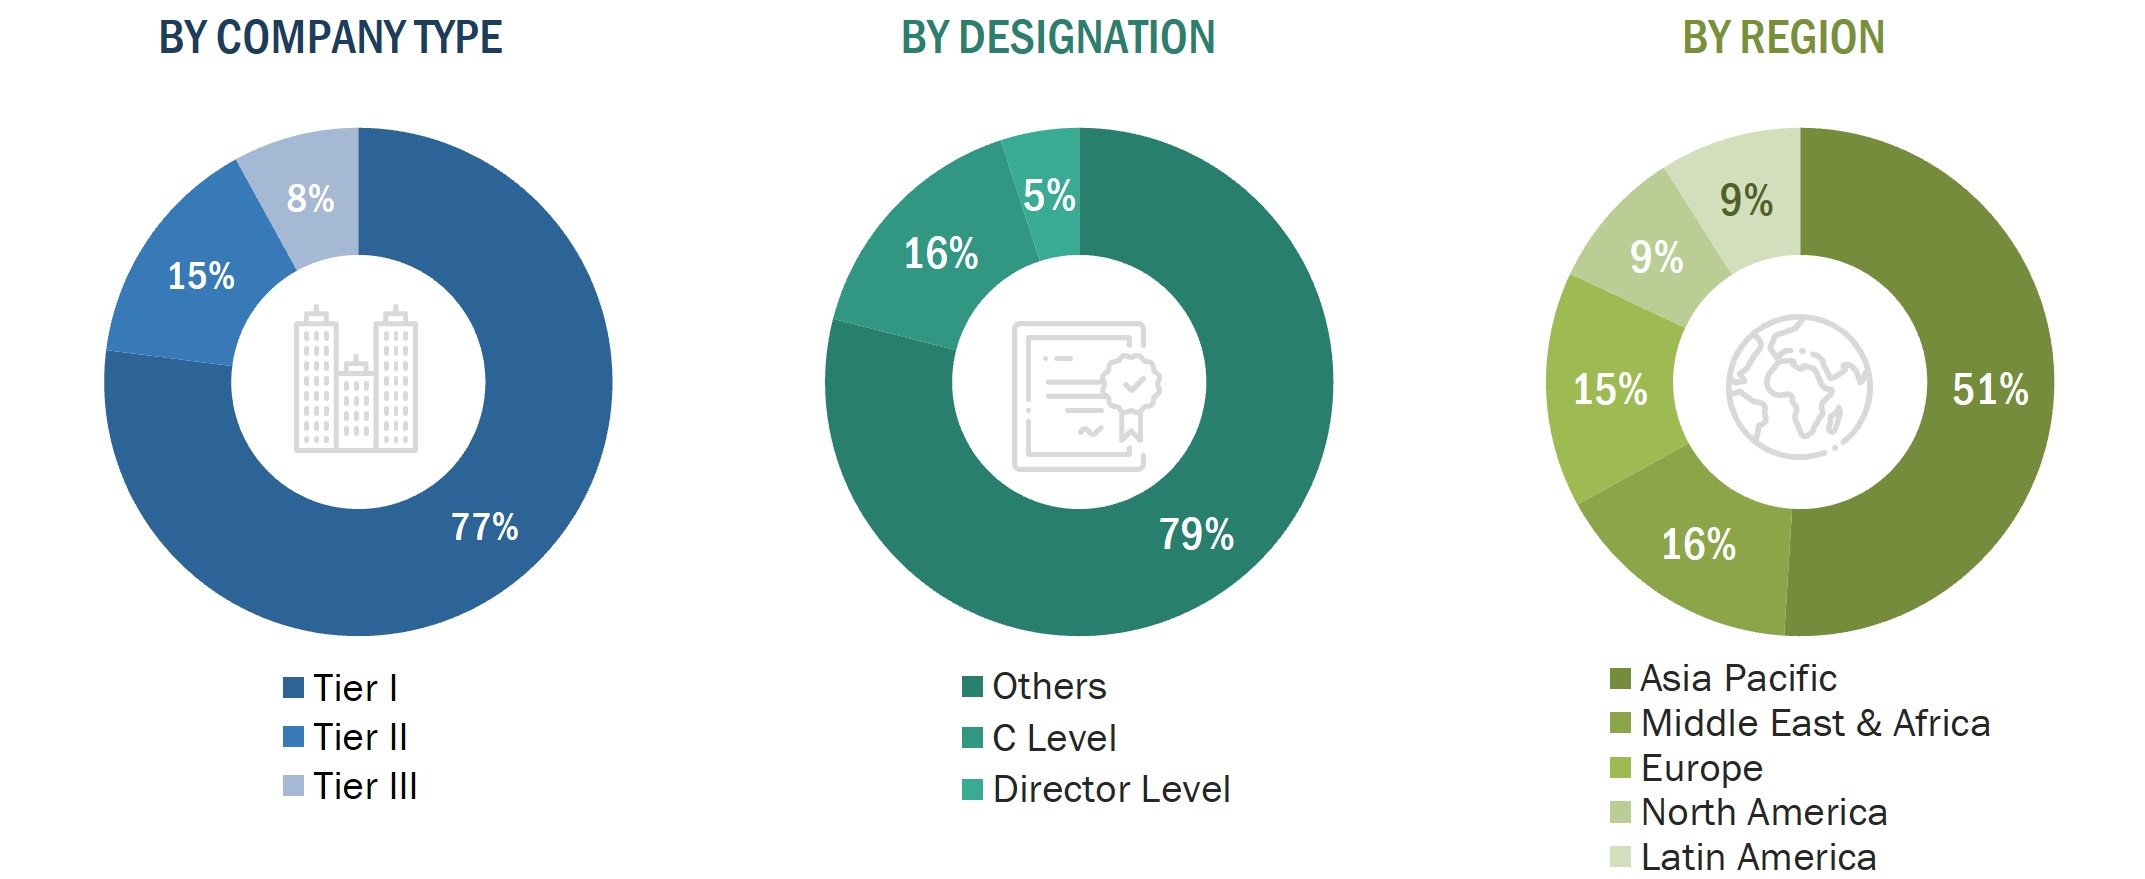
In the primary research process, various sources from the supply and demand sides were interviewed to obtain qualitative and quantitative information on the market. Primary sources from the supply side included industry experts such as vice presidents (VPs); directors from business development, marketing, and product development/innovation teams; related key executives from marine vessel manufacturers; aircraft manufacturers; C2 manufacturers; integrators; and key opinion leaders.
Air Traffic Control (ATC) Market Size, and Share

To know about the assumptions considered for the study, download the pdf brochure

Market Size Estimation

Both top-down and bottom-up approaches were used to estimate and validate the total size of the air traffic control (ATC)  market. These methods were also used extensively to estimate the size of various segments and subsegment of the market. The research methodology used to estimate the market size included the following:

  • Key players in the industry and market were identified through extensive secondary research of their product matrix and geographical presence and developments undertaken by them.
  • All percentage shares, splits, and breakdowns were determined using secondary sources and verified through primary sources.

Air traffic control (ATC)  Market Size: Bottom-Up Approach

Air Traffic Control (ATC) Market Size, and Bottom-Up Approach

Air traffic control (ATC) Market Size: Top-Down Approach

Air Traffic Control (ATC) Market Size, and Top-Down Approach

Data Triangulation

After arriving at the overall market size, the total market was split into several segments and subsegments. The data triangulation and market breakdown procedures explained below were implemented, wherever applicable, to complete the overall market engineering process and arrive at the estimated market numbers for air traffic control (ATC)  segments and subsegments. The data was triangulated by studying various factors and trends from both, the demand and supply sides. Along with this, the market size was validated using the top-down and bottom-up approaches.

The following figure indicates the market breakdown structure and the data triangulation procedure implemented in the market engineering process used to develop this report.

Report Objectives

To define, describe, segment, and forecast the size of the air traffic control (ATC)  market based on By airpspace, application, offering, sector, investment type, airport size, and region for the forecast period from 2022 to 2027

  • To forecast the size of various segments of the air traffic control (ATC)  market with respect to 6 major regions namely, North America, Europe, Asia Pacific, Rest of the World which consists of the Middle East and Latin America & Africa
  • To identify and analyze key drivers, restraints, opportunities, and challenges influencing the growth of the air traffic control (ATC)  market
  • To identify the opportunities for stakeholders in the market by identifying key market and technology trends
  • To analyze competitive developments such as contracts, agreements, acquisitions & partnerships, new product launches & developments, and Research & Development (R&D) activities in the air traffic control (ATC)  market.
  • To anticipate the status of the air traffic control (ATC)  market procurements by different countries, technological advancements in ATC; and joint developments undertaken by leading players to analyze the degree of competition in the market
  • To provide a comprehensive competitive landscape of the air traffic control (ATC)  market, along with an overview of the different strategies adopted by the key market players to strengthen their position in the market

Available Customizations

MarketsandMarkets offers the following customizations for this market report:

  • Market sizing and forecast for additional countries
  • By segment, by sud-segment type breakdown at country level
  • Additional five companies profiling

Product Analysis

  • Product matrix, which provides a detailed comparison of the product portfolio of each company in the air traffic control (ATC)  market
Custom Market Research Services

We will customize the research for you, in case the report listed above does not meet with your exact requirements. Our custom research will comprehensively cover the business information you require to help you arrive at strategic and profitable business decisions.

Request Customization

Instant Answers with GPT - Ask Now!

Ask real questions. Get complete answers !
Report Code
AS 3053
Published ON
Nov, 2022
Choose License Type
BUY NOW
  • SHARE
X
Request Customization
Speak to Analyst
Speak to Analyst
OR FACE-TO-FACE MEETING
PERSONALIZE THIS RESEARCH
  • Triangulate with your Own Data
  • Get Data as per your Format and Definition
  • Gain a Deeper Dive on a Specific Application, Geography, Customer or Competitor
  • Any level of Personalization
REQUEST A FREE CUSTOMIZATION
LET US HELP YOU!
  • What are the Known and Unknown Adjacencies Impacting the Air Traffic Control (ATC) Market
  • What will your New Revenue Sources be?
  • Who will be your Top Customer; what will make them switch?
  • Defend your Market Share or Win Competitors
  • Get a Scorecard for Target Partners
CUSTOMIZED WORKSHOP REQUEST
knowledgestore logo

Want to explore hidden markets that can drive new revenue in Air Traffic Control (ATC) Market?

Find Hidden Markets
  • Call Us
  • +1-888-600-6441 (Corporate office hours)
  • +1-888-600-6441 (US/Can toll free)
  • +44-800-368-9399 (UK office hours)
CONNECT WITH US
ABOUT TRUST ONLINE
©2024 MarketsandMarkets Research Private Ltd. All rights reserved
DMCA.com Protection Status
Website Feedback