Additive Manufacturing & Material Market by Technology, by Material (Plastics, Metals, and Ceramics), by Application, and by Geography - Analysis & Forecast to 2014 - 2020


The term additive manufacturing is defined as the process of making objects from 3D model data by using additive materials; it represents all additive processes, technologies, systems, and applications. The term additive manufacturing is also referred to as 3D printing. The global additive manufacturing market comprises 3D printers, printing materials, and service providers. The overall applications market comprises both rapid prototyping and rapid manufacturing.
The major market for additive manufacturing is in the Americas; however, Europe and Asia-Pacific are expected to grow at a high CAGR. The application market for additive manufacturing can be divided into the aerospace industry, the automotive industry, consumer products, healthcare, government and defense, industrial/business machines, education & research, and others (arts, architecture, and forensics). The additive manufacturing application in healthcare is expected to grow at the highest CAGR in the forecast period.
The report provides the profile of major companies in the additive manufacturing market. The report also provides the competitive landscape of key players,which indicates their growth strategies in the additive manufacturing market. The report also covers the entire value chain for the market from a raw material supplier to an end user. Along with the value chain, this report also provides an in-depth view on application, technology, and material market. The additive manufacturing market excluding materials is expected to reach $11,145.1 million by 2020,at a CAGR of 20.9% from 2014 to 2020. The additive manufacturing material market is expected to reach $1,082.0 million by 2020, at a CAGR of 19.3% from 2014 to 2020.
The report also provides market dynamics such as drivers, restraints, and opportunities. Apart from the market segmentation, there port also includes critical market data and qualitative information for each technology type along with qualitative analyses, such as the Porter’s five force analysis, value chain analysis, and market crackdown analysis.
Major players in the global additive manufacturing market include 3D Systems, Inc. (U.S.), Stratasys Ltd. (U.S.), ExOne (U.S.), Arcam AB (Sweden), EnvisionTEC (Germany), EOS (Germany), Materialise NV (Belgium), and MCor Technologies Ltd. (Ireland), among others. The detailed explanation of the different market segments is given below:
Additive manufacturing can be defined as the process of making objects from 3D model data by using additive materials; it represents all additive processes, technologies, systems, and applications. It can be used to manufacture products of any geometrical shape with a wide choice ofthe material to be used. Hence, it is now viewed as the solution for production with less resources and fast output.
Additive manufacturing has several advantages such a slower resource requirement, faster production cycle, flexible design, and substantial savings on tooling over traditional manufacturing technologies such as injection molding, Computer Numerical Control (CNC) machining, and vacuum casting. This is very conducive in the manufacturing of low volume customized products of high value.
This report describes market trends, drivers, and challenges for the additive manufacturing market and forecasts the market from 2014 to 2020 on the basis of technology, material, application, and geography. The market by geography is segmented into the Americas, Europe, APAC, and RoW (Rest of the World).
In the additive manufacturing market by technology, stereolitho graphya ccounts for the largest percentage share, followed by the Poly-Jet technology. Consumer products represent the major application market followed by the automotive industry. The Americas accounts for the highest share among all geographic regions; whereas plastics account for the highest share in the materials market.
Major players in the market include 3D Systems, Inc. (U.S.), Stratasys Ltd. (U.S.), ExOne (U.S.), Arcam AB (Sweden), EnvisionTEC (Germany), EOS (Germany), Materialise NV (Belgium), and MCor Technologies Ltd. (Ireland).
Global Additive Manufacturing Market, 2014-2020 ($ Million)
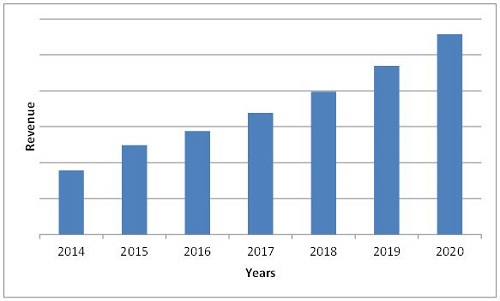
Source: MarketsandMarkets Analysis
The additive manufacturing market excluding materials is expected to increase at a CAGR of 20.9% from 2014 to 2020. Consumer products are the major application inthis market. The stereolithography technology dominates other technologies with the highest share in the market. The Americas has the highest share in the additive manufacturing material market.
Global Additive Manufacturing Material Market, 2014 - 2020 ($ Million)
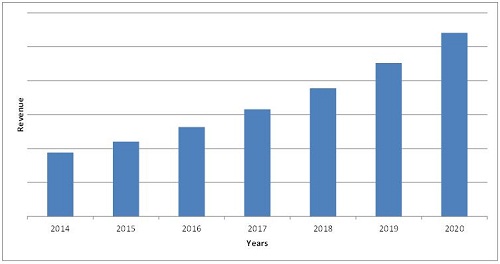
Source: MarketsandMarkets Analysis
The additive material market is expected to grow at a CAGR of 19.3% from 2014 to 2020.
 Exclusive indicates content/data unique to MarketsandMarkets and not available with any competitors.
Table Of Contents
1 Introduction (Page No. - 18)
1.1 Objectives Of The Study
1.2 Markets Covered
1.3 Stakeholders
1.4 Market Scope
2 Research Methodology (Page No. - 21)
2.1 Factor Analysis
2.1.1 AM Started A New Revolution in Design Engineering
2.1.2 Focus On Research in AM
2.1.3 Growing interest From Governments
2.1.4 Rapid Manufacturing Leading The Prototyping Growth
2.2 Market Size Estimation
2.3 Market Crackdown & Data Triangulation
2.4 Market Share Estimation
2.4.1 Key Data From Secondary Sources
2.4.2 Key Data From Primary Sources
2.4.2.1 Key Industry Insights
2.4.3 Assumptions
3 Executive Summary (Page No. - 30)
4 Premium Insights- AM Market (Page No. - 33)
4.1 Attractive Market Opportunity in The Additive Manufacturing Market
4.2 Additive Manufacturing Market- Top Three Technology Segments
4.3 Additive Manufacturing Market in Different Regions
4.4 Americas Commanded The Largest Share Among All Regions in 2013
4.5 Additive Manufacturing Market, by Application
4.6 Additive Manufacturing Market, by Application : Consumer Products Application Vs Healthcare Applications
4.7 Additive Manufacturing: Top Technologies by Applications
5 Premium Insights- Materials Market (Page No. - 39)
5.1 Attractive Market Opportunity in Additive Manufacturing Materials
5.2 Additive Manufacturing Material Market- Top Three Material Segments
5.3 Additive Manufacturing Material Market in Different Regions
5.4 Americas Commanded The Largest Share Among All Regions in 2013
5.5 Additive Manufacturing Material Market: Material Types
5.6 Additive Manufacturing Material Market: Consumer Applications Vs Industrial/Business Applications
5.7 Additive Manufacturing Material Market: Top Three Plastics Materials, by Region
6 Market Overview (Page No. - 45)
6.1 Introduction
6.2 Evolution
6.3 Market Segmentation
6.3.1 Additive Manufacturing Market by Technology
6.3.2 Additive Manufacturing Market, by Material
6.3.3 Additive Manufacturing Market, by Application
6.4 Market Dynamics
6.4.1 Drivers
6.4.1.1 Ease Of Manufacturing Complex Designs
6.4.1.2 Development Of New and Improved Technologies and Materials
6.4.1.3 Increased Government Funding
6.4.1.4 Relatively Lower Production Cost For Rapid Manufacturing
6.4.2 Restraints
6.4.2.1 Issues Related To Material Availability, Cost, Quality, Development & Validation, Standardization, and Characterization
6.4.2.1.1 Availability & Cost Of Am Materials
6.4.2.1.2 Material Development & Validation
6.4.2.1.3 Material Standardization & Characterization
6.4.2.1.4 Quality Of Materials
6.4.2.2 Lack Of Standardized Equipment and Process Control
6.4.3 Opportunities
6.4.3.1 Wide Scope Of Application
6.4.3.2 Potential Can Be Enhanced With Strong Mergers and Acquisitions
6.4.3.3 Largely Untapped Personal AM Market
6.4.3.4 Development Of New Supply Chain Models
6.4.3.5 Expiry Of Key Patents
6.4.4 Challenges
6.4.4.1 Need Of Better Software Efficiency
6.4.4.2 Need For Setting Reliable Standards
6.4.5 Burning Issues
6.4.5.1 Intellectual Property Rights and Copyright Issues
6.4.6 Winning Imperatives
6.4.6.1 Huge Growth in Healthcare
7 Industry Trends (Page No. - 60)
7.1 Introduction
7.2 Value Chain Analysis
7.3 Supply Chain Analysis
7.4 Industry Trends
7.5 Porter’s Five Forces Analysis
7.5.1 Threat From New Entrants
7.5.2 Threat From Substitutes
7.5.3 Bargaining Power Of Suppliers
7.5.4 Bargaining Power Of Buyers
7.5.5 Degree Of Competition
7.6 Strategic Benchmarking
7.6.1 Development Of Innovative Products
7.6.2 Growth Strategies
8 Market, by Technology (Page No. - 72)
8.1 Introduction
8.2 Stereolithography (Sla)
8.2.1 Major Companies in Stereolithography
8.2.2 Advantages and Disadvantages Of Stereolithography(SLA)
8.3 Polyjet Printing
8.3.1 Major Companies in Polyjet Printing
8.3.2 Advantages and Disadvantages Of Polyjet Printing
8.4 Binder Jetting Printing
8.4.1 Major Companies involved in Binder Jetting Printing Technology
8.4.2 Advantages and Disadvantages Of Binder Jetting Printing
8.5 Laser Sintering (LS)
8.5.1 Major Companies in Laser Sintering
8.5.2 Advantages and Disadvantages Of Laser Sintering Technology
8.5.3 Selective Laser Sintering (SLS)
8.5.3.1 Major Companies in Selective Laser Sintering
8.5.4 Selective Laser Melting (SLM)
8.5.4.1 Major Companies in Selective Laser Melting
8.5.5 Direct Metal Laser Sintering
8.5.5.1 Major Companies in Direct Metal Laser Sintering
8.6 Electron Beam Melting (EBM)
8.6.1 Major Companies in EBM Technology
8.6.2 Advantages and Disadvantages Of EBM Technology
8.7 Fused Disposition Modelling (FDM)
8.7.1 Major Companies in Fdm Technology
8.7.2 Advantages & Disadvantages Of Fdm Technology
8.8 Laminated Object Manufacturing (LOM)
8.8.1 Major Companies in Laminated Object Manufacturing Technology
8.8.2 Advantages and Disadvantages Of Laminated Object Manufacturing Technology
8.9 Three Dimensional Printing (3DP)
8.9.1 Major Companies in 3 Dimensional Printing Technology
8.9.2 Advantages and Disadvantages Of Three Dimensional Printing
8.1 Others
8.10.1 Digital Light Processing (DLP)
8.10.2 Multiphase Jet Solidification (MJS)
9 Market, by Material Type (Page No. - 102)
9.1 Introduction
9.2 Plastics
9.2.1 Acrylonitrile Butadiene Styrene (ABS)
9.2.2 Polylactic Acid(PLA)
9.2.2.1 Classifications Of ABS and PLA Materials
9.2.3 Photopolymers
9.2.4 Nylon
9.2.5 Others
9.2.5.1 Polypropylene
9.2.5.2 Polycarbonate
9.2.5.3 Polyvinyl Alcohol
9.2.5.4 High Density Polyethylene
9.3 Metals
9.3.1 Steel
9.3.2 Silver
9.3.3 Aluminum (Alumide)
9.3.4 Titanium
9.3.5 Gold
9.3.6 Others
9.4 Ceramics
9.4.1 Glass
9.4.2 Silica
9.4.3 Quartz
9.4.4 Others
10 Market, by Application (Page No. - 120)
10.1 Introduction
10.2 Aerospace Industry
10.3 Automotive Industry
10.4 Consumer Products
10.5 Healthcare Industry
10.6 Government & Defense
10.7 Industrial/Business Machines
10.8 Education & Research
10.9 Others (Architecture, Arts, Forensics)
11 Market by Geography (Page No. - 161)
11.1 Introduction
11.2 Americas
11.2.1 Key Activities Of Major Additive Manufacturing Players Present in This Region
11.3 Europe
11.4 APAC
11.4.1 Key Activities Of Major Additive Manufacturing Players Present in This Region
11.5 Rest Of The World
11.5.1 Key Activities by Major Additive Manufacturing Players Present in This Region
12 Competitive Landscape (Page No. - 201)
12.1 Overview
12.2 Market Share Analysis, Global Additive Manufacturing Market
12.3 Competitive Situation and Trends
12.3.1 New Product Launches and Developments
12.3.2 Agreements,Partnerships, Collaborations, & Joint Ventures
12.3.3 Mergers and Acquisitions
12.3.4 Expansions
12.3.5 Other Developments
13 Company Profiles (Page No. - 210)
(Overview, Products and Services, Financials, Strategy & Development)*
13.1 Introduction
13.2 3d Systems, INC.
13.3 Arcam AB
13.4 Envisiontec
13.5 EOS
13.6 Exone
13.7 Makerbot Industries, LLC
13.8 Materialise NV
13.9 Mcor Technologies LTD.
13.1 Optomec
13.11 Stratasys LTD.
*Details On Overview, Products and Services, Financials, Strategy & Development Might Not Be Captured In Case Of Unlisted Companies.
14 Appendix (Page No. - 250)
14.1 Insights Of Industry Experts
14.2 Discussion Guide
14.3 Introducing RT: Real Time Market Intelligence
14.4 Available Customizations
14.5 Related Reports
List Of Tables (139 Tables)
Table 1 Additive Manufacturing: R&D Expenditure, by Company
Table 2 Ease Of Manufacturing Complex Designs is Propelling The Growth Of AM Market
Table 3 Material Related Issues Are Restraining The Market Growth
Table 4 Wide Scope Of Application Provides Huge Growth Avenues For Players in The AM Market
Table 5 Developing Reliable Standards is A Major Challenge For AM
Table 6 High Demand For Metal AM Systems
Table 7 Additive Manufacturing Market Value, by Technology, 2014-2020 ($Million)
Table 8 Stereolithography: Additive Manufacturing Market Value, by Application, 2014-2020 ($Million)
Table 9 Stereolithography: Additive Manufacturing Market Value, by Geography, 2014-2020 ($Million)
Table 10 Advantages & Disadvantages Of Stereolithography
Table 11 Polyjet Printing, Market Value, by Application, 2014-2020, ($Million)
Table 12 Polyjet Printing, Market Value, by Geography, 2014-2020 ($Million)
Table 13 Advantages & Disadvantages Of Polyjet Technology
Table 14 Binder Jetting Printing Market Value, by Application, 2014-2020 ($Million)
Table 15 Binder Jetting Printing Market Value, by Geography, 2014-2020 ($Million)
Table 16 Advantages & Disadvantages Of Binder Jetting Printing
Table 17 Laser Sintering: Additive Manufacturing Market Value, by Application, 2014-2020 ($Million)
Table 18 Laser Sintering: Additive Manufacturing Market Value, by Geography, 2014-2020 ($Million)
Table 19 Advantages & Disadvantages Of Laser Sintering Technology
Table 20 Ebm: Additive Manufacturing Market Value, by Application, 2014-2020 ($Million)
Table 21 Ebm: Additive Manufacturing Market Value, by Geography, 2014-2020 ($Million)
Table 22 Advantages & Disadvantages Of Ebm Technology
Table 23 Fdm: Additive Manufacturing Market Value, by Application, 2014-2020 ($Million)
Table 24 Fdm: Additive Manufacturing Market Value, by Geography, 2014-2020 ($Million)
Table 25 Advantages & Disadvantages Of Fdm Technology
Table 26 Lom: Additive Manufacturing Market Value, by Application, 2014-2020 ($Million)
Table 27 Lom: Additive Manufacturing Market Value, by Geography, 2014-2020 ($Million)
Table 28 Advantages & Disadvantages Of Laminated Object Manufactring Technology
Table 29 3dp : Additive Manufacturing Market Value, by Application, 2014-2020 ($Million)
Table 30 3dp: Additive Manufacturing Market Value, by Geography, 2014-2020 ($Million)
Table 31 Advantages & Disadvantages Of Three Dimensional Printing
Table 32 Others: Additive Manufacturing Market Value, by Application, 2014-2020 ($Million)
Table 33 Others: Additive Manufacturing Market Value, by Geography, 2014-2020 ($Million)
Table 34 Comparison Of Additive Manufacturing Materials
Table 35 Additive Manufacturing Material Consumption, 2013-2020 (Tons)
Table 36 Additive Manufacturing Material Market Value, 2013-2020 ($Million)
Table 37 Plastics Material: Consumption and Market Size, 2013-2020
Table 38 Plastics Material Consumption, by Type, 2013-2020 (Tons)
Table 39 Plastics Material Market Size, by Type, 2013-2020 ($Million)
Table 40 Properties Of ABS and PLA
Table 41 Metals Material: Consumption and Market Size, 2013-2020
Table 42 Metals Material Consumption, by Type, 2013-2020 (Tons)
Table 43 Metals Material Market Size, by Type, 2013-2020 ($Million)
Table 44 Ceramics Material: Consumption and Market Size, 2013-2020
Table 45 Ceramics Material Consumption, by Type, 2013-2020 (Tons)
Table 46 Ceramics Material Market Size, by Type, 2013-2020 ($Million)
Table 47 Other Materials: Consumption and Market Value, 2013-2020
Table 48 Other Materials: Consumption, by Type, 2013-2020 (Tons)
Table 49 Other Materials: Market Value, by Type, 2013-2020 ($Million)
Table 50 Additive Manufacturing: Success Factors in Different Industries
Table 51 Additive Manufacturing Market Size, by Application, 2014-2020 ($Million)
Table 52 Additive Manufacturing Material Market Consumption, by Application, 2013-2020 (Tons)
Table 53 Additive Manufacturing Material Market Size, by Application, 2013-2020 ($Million)
Table 54 Aerospace Industry: Additive Manufacturing Market Size, by Technology, 2014-2020 ($Million)
Table 55 Aerospace Industry: Additive Manufacturing Material Market Consumption, 2014-2020 (Tons)
Table 56 Aerospace Industry: Additive Manufacturing Material Market Size, 2014-2020 ($Million)
Table 57 Aerospace Industry: Additive Manufacturing Market Size, by Geography, 2014-2020 ($Million)
Table 58 Automotive Industry: Additive Manufacturing Market Size, by Technology, 2014-2020 ($Million)
Table 59 Automotive Industry: Additive Manufacturing Material Market Consumption, 2014-2020 (Tons)
Table 60 Automotive Industry: Additive Manufacturing Material Market Size, 2014-2020 ($Million)
Table 61 Automotive Industry: Additive Manufacturing Market Value, by Geography, 2014-2020 ($Million)
Table 62 Consumer Products: Additive Manufacturing Market Size, by Technology, 2014-2020 ($Million)
Table 63 Consumer Products: Additive Manufacturing Material Market Consumption , 2014-2020 (Tons)
Table 64 Consumer Products: Additive Manufacturing Material Market Size, 2014-2020 ($Million)
Table 65 Consumer Products: Additive Manufacturing Market Value, by Geography, 2014-2020 ($Million)
Table 66 Healthcare Industry: Additive Manufacturing Market Size, by Technology, 2014-2020 ($Million)
Table 67 Healthcare Industry: Additive Manufacturing Material Market Consumption, 2014-2020 (Tons)
Table 68 Healthcare Industry: Additive Manufacturing Market Value, by Material, 2014-2020 ($Million)
Table 69 Healthcare Industry: Additive Manufacturing Market Size, by Geography, 2014-2020 ($Million)
Table 70 Government & Defense: Additive Manufacturing Market Size, by Technology, 2014-2020 ($Million)
Table 71 Government & Defense: Additive Manufacturing Material Market Consumption, 2014-2020 (Tons)
Table 72 Government & Defense: Additive Manufacturing Material Market Size, 2014-2020 ($Million)
Table 73 Government & Defense: Additive Manufacturing Market Size, by Geography, 2014-2020 ($Million)
Table 74 Industrial/Business Machines: Additive Manufacturing Market Value, by Technology, 2014-2020 ($Million)
Table 75 Industrial/Business Machines: Additive Manufacturing Material Market Consumption, 2014-2020 (Tons)
Table 76 Industrial/Business Machines: Additive Manufacturing Material Market Size, 2014-2020 ($Million)
Table 77 Industrial/Business Machines: Additive Manufacturing Market Size, by Geography, 2014-2020 ($Million)
Table 78 Education & Research: Additive Manufacturing Market Value, by Technology, 2014-2020 ($Million)
Table 79 Education & Research: Additive Manufacturing Material Market Consumption, 2014-2020 (Tons)
Table 80 Education & Research: Additive Manufacturing Material Market Size, 2014-2020 ($Million)
Table 81 Education & Research: Additive Manufacturing Market Size, by Geography, 2014-2020 ($Million)
Table 82 Others (Architecture, Arts, Forensics): Additive Manufacturing Market Size, by Technology, 2014-2020 ($Million)
Table 83 Others (Architecture, Arts, Forensics): Additive Manufacturing Material Market Consumption, 2014-2020 ($Million)
Table 84 Others (Architecture, Arts, Forensics): Additive Manufacturing Material Market Size, 2014-2020 ($Million)
Table 85 Others (Architecture, Arts, Forensics): Additive Manufacturing Market Size, by Geography, 2014-2020 ($Million)
Table 86 AM Market Size, by Geography, 2014-2020 ($Million)
Table 87 AM Material Market Size, by Geography, 2014-2020 (Tons)
Table 88 AM Material Market Size, by Geography, 2014-2020 ($Million)
Table 89 Americas: AM Market Size, 2014-2020 ($Million)
Table 90 Americas: AM Market, by Application, 2014-2020 ($Million)
Table 91 Americas: AM Materials Market Size, by Type, 2014-2020 (Tons)
Table 92 Americas: AM Materials Market Size, 2014-2020 ($Million)
Table 93 Americas: Plastics Market Size, by Type, 2014-2020 (Tons)
Table 94 Americas: Plastics Market Size, by Type 2014-2020 ($Million)
Table 95 Americas: Metals Market Size, by Type, 2014-2020 (Tons)
Table 96 Americas: Metals Market Size, by Type, 2014-2020 ($Million)
Table 97 Americas: Ceramics Market Volume, by Type, 2014-2020 (Tons)
Table 98 Americas: Ceramics Market Size, by Type, 2014-2020 ($Million)
Table 99 Europe: AM Market Size, 2014-2020 ($Million)
Table 100 Europe: AM Market Size, by Application, 2014-2020 ($Million)
Table 101 Europe: AM Materials Market Size, by Type, 2014-2020 (Tons)
Table 102 Europe: AM Materials Market Size, by Type, 2014-2020 ($Million)
Table 103 Europe: Plastics Market Size, by Type, 2014-2020 (Tons)
Table 104 Europe: Plastics Market Size, by Type, 2014-2020 ($Million)
Table 105 Europe: Metals Market Size, by Type, 2014-2020 (Tons)
Table 106 Europe: Metals Market Size, by Type, 2014-2020 ($Million)
Table 107 Europe: Ceramics Market Size, by Type, 2014-2020 (Tons)
Table 108 Europe: Ceramics Market Size, by Type, 2014-2020 ($Million)
Table 109 Key Activities Of Major Additive Manufacturing Players Present in This Region
Table 110 APAC: AM Market Size, 2014-2020 ($Million)
Table 111 APAC: AM Market Size, by Application, 2014-2020 ($Million)
Table 112 APAC: AM Materials Market Size, by Type, 2014-2020 (Tons)
Table 113 APAC: AM Materials Market Size, by Type, 2014-2020 ($Million)
Table 114 APAC: Plastics Market Volume, by Type, 2014-2020 (Tons)
Table 115 APAC: Plastics Market Size, by Type, 2014-2020 ($Million)
Table 116 APAC: Metal Market Size, by Type, 2014-2020 (Tons)
Table 117 APAC: Metals Market Size, by Type, 2014-2020 ($Million)
Table 118 APAC: Ceramics Market Size, by Type, 2014-2020 (Tons)
Table 119 APAC: Ceramics Market Size, by Type, 2014-2020 ($Million)
Table 120 ROW: AM Market Size, 2014-2020 ($Million)
Table 121 ROW: AM Market Size, by Application, 2014-2020 ($Million)
Table 122 ROW: AM Materials Market Size, by Type, 2014-2020 (Tons)
Table 123 ROW: AM Materials Market Size, by Type, 2014-2020 ($Million)
Table 124 ROW: Plastics Market Size, by Type, 2014-2020 (Tons)
Table 125 ROW: Plastics Market Size, by Type, 2014-2020 ($Million)
Table 126 ROW: Metals Market Size, by Type, 2014-2020 (Tons)
Table 127 ROW: Metals Market Size, by Type, 2014-2020 ($Million)
Table 128 ROW: Ceramics Market Size, by Type, 2014-2020 (Tons)
Table 129 ROW: Ceramics Market Size, by Type, 2014-2020 ($Million)
Table 130 New Product Launches and Developments, 2011 - 2014
Table 131 Agreements, Partnerships,Collaborations & Joint Ventures, 2011-2014
Table 132 Mergers and Acquisitions, 2011-2014
Table 133 Expansions, 2011-2014
Table 134 Other Developments, 2011-2014
Table 135 Envisiontec: Business Overview
Table 136 EOS: Business Overview
Table 137 Makerbot Industries, LLC: Business Overview
Table 138 MCOR Technologies LTD.: Business Overview
Table 139 Optomec: Business Overview
List Of Figures (96 Figures)
Figure 1 Global Additive Manufacturing Market, by Technology
Figure 2 Research Methodology
Figure 3 Market Size Estimation Methodology: Bottom-Up Approach
Figure 4 Market Size Estimation Methodology: Top-Down Approach
Figure 5 Breakdown Of Primary Interviews: by Company Type, Designation, & Region
Figure 6 Additive Manufactring Market, by Material, 2013
Figure 7 Additive Manufacturing Application Snapshot: The Healthcare Application is Expected To Grow At The Highest Rate Figure 8 Addiitve Manufactruing Market : Geographic Regions
Figure 9 Attractive Market Opprtunity In Additive Manufacturing Market
Figure 10 Laser Sintering Technology Market To Grow At The Fastest Rate Among All The AM Technologies
Figure 11 Stereolithography Has The Largest Share in The Global Additive Manufacturing Market
Figure 12 The Americas Are The Largest Share Holders Of The AM Market
Figure 13 Consumer Products Application Segment Will Continue To Dominate The Americas Market For The Next Six Years
Figure 14 Healthcare Applications To Grow At The Fastest Rate in All Regions
Figure 15 Laser Sintering Expected To Grow With The Highest Cagr
Figure 16 Plastics Market is Expected To Grow At The Highest Rate Among All Materials
Figure 17 Plastics Have Captured The Largest Share in The Additive Manufacturing Material Market
Figure 18 Americas is The Largest Share Holder For Material Market in Additive Manufacturing
Figure 19 Plastics Will Continue To Dominate The American Market For The Next Six Years
Figure 20 Consumer Applications Are Expected To Growat The Fastest Rate Across All Geographic Regions
Figure 21 PLA Plastics Material Dominates The Overall Plastics Material Market in All Geographic Regions
Figure 22 Additive Manufacturing Process
Figure 23 Additive Manufacturing To Play A Bigger Role in Manufacturing Technology in Different Sectors
Figure 24 Additive Manufacturing Market Segmentation, by Technology
Figure 25 Additive Manufacturing Market Segmentation, by Material
Figure 26 Additive Manufacturing Market Segmentation, by Application
Figure 27 Ease Of Manufacturing Complex Designs is Driving The Demand For AM
Figure 28 Value Chain Analysis
Figure 29 Supply Chain Of AM
Figure 30 Porter’s Five Forces Analysis
Figure 31 Porter’s Five Forces Analysis (2013): Impact Analysis
Figure 32 Threat From New Entrants: Impact Analysis
Figure 33 Threat From Substitutes:Impact Analysis
Figure 34 Bargaining Power Of Suppliers:Impact Analysis
Figure 35 Bargaining Power Of Buyers:Impact Analysis
Figure 36 Degree Of Competition:Impact Analysis
Figure 37 Recent Product Launches Imbibing Latest Technology
Figure 38 Recent Acquisitions by Market Leaders in The Additive Manufacturing Market
Figure 39 Stereolithography Accounts For The Highest Share Among All Technologies
Figure 40 Consumer Application Expected To Grow At The Highest Cagr in The Stereolithography Technology Market
Figure 41 Europe Expected To Hold The Highest Share in 2020 Due To Government Funding and Broad Application Scope
Figure 42 Healthcare Application is Expected To Drive The Polyjet Printing Market With The Highest Cagr
Figure 43 The America Held The Highest Share in Polyjet Printing in 2013
Figure 44 Automotive Application Accounted For The Highest Share in 2013
Figure 45 ROW Market is Expected To Grow At The Highest Cagr
Figure 46 Healthcare Application is Expected To Hold The Highest Market Share in 2020
Figure 47 Europe Market is Estimated To Overtake America by 2020
Figure 48 Healthcare Application is The Major Share Holder and It is Expected To Maintain Its Position Till 2020
Figure 49 APAC Market is Expected To Grow At The Highest Cagr Among All Regions
Figure 50 Additive Manufacturing Materials Market Segmentation
Figure 51 Plastic Holds The Future Potential in The Additive Manufacturing Material Market
Figure 52 Pla is Expected To Grows At The Highest Cagr Among All Plastic Materials
Figure 53 Steel is Expected To Surpass Silver by 2020
Figure 54 Silica Holds The Higher Share in The Ceramic Market
Figure 55 Laywood is The Potential Material For Other Material Market
Figure 56 Additive Manufacturing Market: by Application
Figure 57 Additive Manufacturing Market: Applications’ Historic Data
Figure 58 Additive Manufacturing Market: Future Application Areas
Figure 59 Consumer Product is The Major Application Of Additive Manufacturing
Figure 60 Automotive Applications Will Surpass Consumer Products in 2020
Figure 61 Binder Jetting is The Fastest Growing Technology in The Aerospace industry
Figure 62 Europe is Expected To Hold The Largest Share During The Forecast Period From 2014 To 2020
Figure 63 Stereolithography Holds The Largest Share in Automotive Applications
Figure 64 Europe Will Surpass The American Additive Manufacturing Market in Automotive Applications by 2020
Figure 65 Stereolithography Will Hold Its Leadership Position Till 2020
Figure 66 The Europe Market Will Grow At The Highest Cagr in Consumer Product Applications
Figure 67 Laser Sintering Technology is Upcoming Leader in Heathcare Applications
Figure 68 America is The Largest Share Holder in Healthcare Applications
Figure 69 Binder-Jetting Technolgy is Expected To Grow At The Highest Cagr Among All The Technologies During The Forecast Period
Figure 70 Europe is Expected To Surpass The American Market by 2020
Figure 71 Stereolithography Technology is The Major Share Holder Among All Technologies
Figure 72 APAC Market is Expected To Grow At The Highest Cagr in The Industrial/Business Machine Application
Figure 73 Binder-Jetting Technology is Expected To Grow At The Fastest Rate Among All Technologies
Figure 74 Americas Continue To Hold Its Leadership Position Till 2020
Figure 75 Binder-Jetting is The Fastest Growing Technology in The Other Applications’ Market
Figure 76 Americas Holds A Major Share in The Other Applications’ Market
Figure 77 Geographic Snapshot (2013) – Rapid Growth Markets Are Emerging As New Hot Spots
Figure 78 Americas Market Snapshot: Demand Will Be Driven by Consumer Products’ Applications
Figure 79 APAC AM Snapshot – Healthcare is The Fastest Growing Application Segment
Figure 80 Companies Adopting Mergers and Acquisitions As The Key Growth Strategy Over The Last Three Years
Figure 81 Stratasys LTD. and Exone Grew At The Fastest Rate Between 2010 - 2013
Figure 82 Global Additive Manufacturing Market Share, by Key Player, 2013
Figure 83 Market Evolution Framework-Significant Product Developments Have Fuelled The Growth and Innovation in 2013
Figure 84 Battle For Market Share: New Product Launches Was The Key Strategy
Figure 85 Geographic Revenue Mix Of Top 4 Market Players
Figure 86 Competitive Benchmarking Of Key Market Players (2010-2013): 3d Systems, INC. and Startasys LTD. Emerged As Champions Due To Their Diversified Product Portfolios
Figure 87 3d Systems, INC.: Business Overview
Figure 88 3d Systems, INC. SWOT Analysis
Figure 89 Arcam Ab : Business Overview
Figure 90 Arcam Ab SWOT Analysis
Figure 91 Envisiontec SWOT Analysis
Figure 92 Exone Business Overview:
Figure 93 Exone SWOT Analysis
Figure 94 Materialise Nv : Business Overview
Figure 95 Stratasys LTD.: Business Overview
Figure 96 Stratasys LTD. SWOT Analysis


Growth opportunities and latent adjacency in Additive Manufacturing & Material Market
I would like to get an overview regarding the AM market tendencies and more specifically which are the materials trends. Also would like to understand the market size and use of AM materials in automotive sector.
I would like to know more about Additive Manufacturing Global Market focus on Plastic materials and their division on principal AM technologies (FDM, SLS, SLA, etc.)
I'm writing a report on the impact of Am in the economy. I will be interesting to see the market dynamics of the market.
I would like to know about the metals used for additive manufacturing by industry. Also, we expect to focus more on the cost/value of parts made than on the cost/value of machines sold or powders sold. Could you provide us with these insights?