3D Radar Market by Frequency Band (C/S/X Band, L Band, E/F Band, Others), Range (Long, Medium, Short), Platform (Airborne, Ground, Naval), Region (North America, Europe, Asia Pacific, Middle East, RoW) - Global Forecast to 2022


[144 Pages Report] The 3D radar market is estimated to grow from USD 702.8 Million in 2017 to USD 1,775.0 Million by 2022, at a CAGR of 20.36% from 2017 to 2022. The objectives of this study are to analyze the 3D radar market, along with its statistics from 2017 to 2022. It also aims to define, describe, and forecast the 3D radar market on the basis of the frequency band, range, platform, and region. The year 2016 has been considered to be the base year for this study on the 3D radar market, whereas 2017 to 2022 has been considered as the forecast period for the study.
The 3D radar market is projected to grow from USD 702.8 Million in 2017 to USD 1,775.0 Million by 2022, at a CAGR of 20.36% from 2017 to 2022. The emergence of modern warfare techniques with the rapid technological developments has led to the replacement of traditional combat systems with advanced combat technologies, such as electronic warfare and network-centric warfare. This, in turn, is expected to drive the growth of the 3D radar market during the forecast period from 2017 to 2022. The 3D radar market has been segmented based on the frequency band, range, platform, and region.
Based on the frequency band, the 3D radar market has been segmented into C/S/X band, L band, E/F band, and others. A frequency band is an interval at which a particular radar transmits a signal. These frequency bands are distinguished by their wavelengths, which range from 0 GHz to 40 GHz. Radio frequency waves are sent through antennas into space that are then reflected from the targets.
Based on the range, the 3D radar market has been segmented into long range, medium range, and short range. The long range segment is expected to lead the 3D radar market in 2017. Long range 3D radar has gained popularity in recent years, owing to its growing applicability in weather monitoring applications as it helps in accurate prediction of natural calamities, such as floods, earthquakes, cyclones, and hurricanes.
Based on the platform, the 3D radar market has been segmented into airborne, ground, and naval. The ground segment of the 3D radar market is projected to witness the highest growth during the forecast period while the airborne segment is expected to lead the market in 2017. The manufacturers of different types of airborne 3D radar are making efforts to develop specialized airborne 3D radar for Unmanned Aerial Vehicles (UAVs) as the use of airborne 3D radar in Unmanned Aerial Vehicles (UAVs) enables easy data collection of fast-changing terrains, such as snow slopes and active volcanoes.
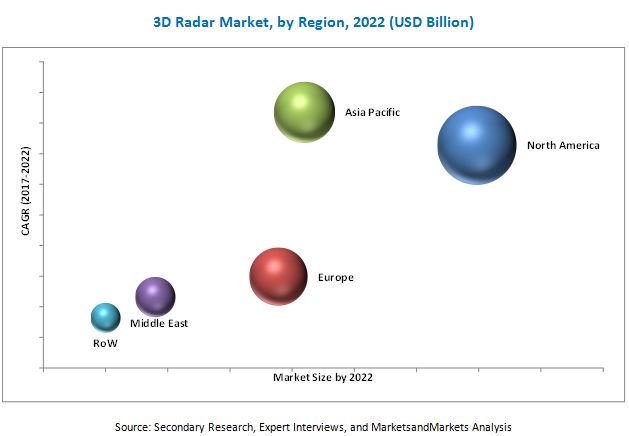
The 3D radar market has been studied for North America, Europe, Asia Pacific, Middle East, and Rest of the World (RoW). The North American region is expected to lead the 3D radar market in 2017 as the region is home to several leading manufacturers of different types of 3D radar, which include Northrop Grumman Corporation (US), Rockwell Collins Inc. (US), Airbus Defense and Space (US), etc.
The huge costs incurred in the development of different types of 3D radar is the major factor restraining the growth of the 3D radar market across the globe. Significant investments are required at different stages of the value chain of the 3D radar industry (especially in the R&D, manufacturing, system integration, and assembly stages).
Products offered by various companies operating in the 3D radar market have been listed in the report. The recent developments section of the report provides information on the strategies adopted by various companies between March 2012 and August 2017 to strengthen their positions in the 3D radar market. Major players in the 3D radar market include Northrop Grumman Corporation (US), Raytheon Company (US), Airbus Defense and Space (US), etc. These companies have an excellent geographic reach and distribution channels.
To speak to our analyst for a discussion on the above findings, click Speak to Analyst
 Exclusive indicates content/data unique to MarketsandMarkets and not available with any competitors.
Table of Contents
1 Introduction (Page No. - 15)
1.1 Objectives of the Study
1.2 Market Definition
1.3 Market Scope
1.3.1 Markets Covered
1.3.2 Regional Scope
1.3.3 Years Considered for the Study
1.4 Currency & Pricing
1.5 Market Stakeholders
2 Research Methodology (Page No. - 18)
2.1 Research Data
2.1.1 Secondary Data
2.1.1.1 Key Data From Secondary Sources
2.1.2 Primary Data
2.1.2.1 Key Data From Primary Sources
2.1.2.2 Breakdown of Primaries
2.2 Market Size Estimation
2.2.1 Bottom-Up Approach
2.2.2 Top-Down Approach
2.3 Data Triangulation
2.4 Research Assumptions & Limitations
3 Executive Summary (Page No. - 27)
4 Premium Insights (Page No. - 31)
4.1 Attractive Opportunities in 3D Radar Market
4.2 3D Radar Market, By Frequency Band
4.3 Market, By Platform
4.4 Market, By Range
4.5 Market, By Region
5 Market Overview (Page No. - 34)
5.1 Introduction
5.2 Market Segmentation
5.3 Market Dynamics
5.3.1 By Frequency Band
5.3.2 By Range
5.3.3 By Platform
5.3.4 By Region
5.4 Market Dynamics
5.5 Drivers
5.5.1 Increasing Use of Modern Warfare Techniques
5.5.2 Adoption of 3D Radar By Airports
5.5.3 Geopolitical Instabilities in Asia Pacific and the Middle East
5.6 Restraints
5.6.1 High Cost of 3D Radar
5.7 Opportunities
5.7.1 Miniaturization of 3D Radar for Uavs and Unmanned Combat Vehicles
5.7.2 Growing Deployment of Air & Missile Defense Systems
5.8 Challenges
5.8.1 Vulnerability of Fully Automated 3D Radar
6 Industry Trends (Page No. - 43)
6.1 Introduction
6.2 New Product Development of 3D Radar, By Top Manufacturers, 2016-2017
6.3 New Trends and Technologies in 3D Radar Market
6.3.1 Digital Signal Processor
6.3.2 3D Weather Monitoring Radar
6.3.3 Advanced Materials
6.3.4 Solid-State Transmitters
6.3.5 Lightweight 3D Radar
6.3.6 3D Radar With Autonomous Operation
6.3.7 Counter Stealth Radar
6.4 4D Radar Future Trends
6.5 Patent Listings, 2010 & 2016
7 3D Radar Market, By Frequency Band (Page No. - 47)
7.1 Introduction
7.2 C/S/X Band
7.3 E/F Band
7.4 L Band
7.5 Others
8 3D Radar Market, By Range (Page No. - 52)
8.1 Introduction
8.2 Long Range
8.3 Medium Range
8.4 Short Range
9 3D Radar Market, By Platform (Page No. - 56)
9.1 Introduction
9.2 Airborne
9.3 Ground
9.4 Naval
10 Regional Analysis (Page No. - 61)
10.1 Introduction
10.2 North America
10.2.1 By Frequency Band
10.2.2 By Range
10.2.3 By Platform
10.2.4 By Country
10.2.4.1 US
10.2.4.1.1 By Frequency Band
10.2.4.1.2 By Range
10.2.4.1.3 By Platform
10.2.4.2 Canada
10.2.4.2.1 By Frequency Band
10.2.4.2.2 By Range
10.2.4.2.3 By Platform
10.3 Europe
10.3.1 By Frequency Band
10.3.2 By Range
10.3.3 By Platform
10.3.4 By Country
10.3.4.1 UK
10.3.4.1.1 By Frequency Band
10.3.4.1.2 By Range
10.3.4.1.3 By Platform
10.3.4.2 Germany
10.3.4.2.1 By Frequency Band
10.3.4.2.2 By Range
10.3.4.2.3 By Platform
10.3.4.3 France
10.3.4.3.1 By Frequency Band
10.3.4.3.2 By Range
10.3.4.3.3 By Platform
10.3.4.4 Russia
10.3.4.4.1 By Frequency Band
10.3.4.4.2 By Range
10.3.4.4.3 By Platform
10.3.4.5 Rest of Europe
10.3.4.5.1 By Frequency Band
10.3.4.5.2 By Range
10.3.4.5.3 By Platform
10.4 Asia Pacific
10.4.1 By Frequency Band
10.4.2 By Range
10.4.3 By Platform
10.4.4 By Country
10.4.4.1 China
10.4.4.1.1 By Frequency Band
10.4.4.1.2 By Range
10.4.4.1.3 By Platform
10.4.4.2 India
10.4.4.2.1 By Frequency Band
10.4.4.2.2 By Range
10.4.4.2.3 By Platform
10.4.4.3 Japan
10.4.4.3.1 By Frequency Band
10.4.4.3.2 By Range
10.4.4.3.3 By Platform
10.4.4.4 Rest of Asia Pacific
10.4.4.4.1 By Frequency Band
10.4.4.4.2 By Range
10.4.4.4.3 By Platform
10.5 Middle East
10.5.1 By Frequency Band
10.5.2 By Range
10.5.3 By Platform
10.5.4 By Country
10.5.4.1 Saudi Arabia
10.5.4.1.1 By Frequency Band
10.5.4.1.2 By Range
10.5.4.1.3 By Platform
10.5.4.2 UAE
10.5.4.2.1 By Frequency Band
10.5.4.2.2 By Range
10.5.4.2.3 By Platform
10.5.4.3 Israel
10.5.4.3.1 By Frequency Band
10.5.4.3.2 By Range
10.5.4.3.3 By Platform
10.5.4.4 Rest of Middle East
10.5.4.4.1 By Frequency Band
10.5.4.4.2 By Range
10.5.4.4.3 By Platform
10.6 Rest of the World
10.6.1 By Frequency Band
10.6.2 By Range
10.6.3 By Platform
11 Competitive Landscape (Page No. - 98)
11.1 Introduction
11.2 Market Ranking Analysis
11.3 Competitive Leadership Mapping
11.3.1 Visionary Leaders
11.3.2 Innovators
11.3.3 Dynamic Differentiators
11.3.4 Emerging Companies
11.4 3D Radars Market (Global),
11.5 Competitive Benchmarking
11.5.1 Strength of Product Portfolio (For 25 Players)
11.5.2 Business Strategy Excellence (For 25 Players)
*Top 25 Companies Analysed for This Study are - Northrop Grumman Corporation, (US), Raytheon Company (US) Thales Group (France), BAE Systems Plc (UK), Harris Corporation, Honeywell International Inc.(US), Airbus Defense and Space (France), SAAB Group (Sweden), Leonardo S.p.A (Italy), ELTA Systems Ltd.(Israel), ASELSAN A.S.(Turkey), Rheinmetall AG (Germany), Indra Sistemas, S.A.(Spain), Bharat Electronics Limited (India), Reutech Radar Systems (South Africa), Rosoboronexport (Russia), Aveillant Ltd.(UK), INVAP (Argentina), Artsys360 (Israel), Robin Radar Systems (Netherlands), Almaz-Antey (Russia), PIT-RADWAR S.A.(Poland), SRC Inc. (US), GEM Elettronica (Italy), Hanwha Systems (South Korea)
12 Company Profiles (Page No. - 103)
(Overview, Strength of Product Portfolio , Business Strategy Excellence , Products Offering, Recent Development’s, Business Strategy)*
12.1 Northrop Grumman Corporation
12.2 Raytheon Company
12.3 Thales Group
12.4 BAE Systems Plc
12.5 Airbus Defense and Space
12.6 Honeywell International Inc.
12.7 SAAB Group
12.8 Harris Corporation
12.9 Leonardo S.p.A
12.10 ASELSAN A.S.
12.11 Rheinmetall AG
12.12 ELTA Systems Ltd
*Details on Overview, Strength of Product Portfolio, Business Strategy Excellence, Products Offering, Recent Development’s, Business Strategy Might Not Be Captured in Case of Unlisted Companies.
13 Appendix (Page No. - 137)
13.1 Discussion Guide
13.2 Knowledge Store: Marketsandmarkets’ Subscription Portal
13.3 Introducing RT: Real-Time Market Intelligence
13.4 Available Customizations
13.5 Related Reports
13.6 Author Details
List of Tables (80 Tables)
Table 1 Number of Active Conflicts and Death Casualties Due to Missile Attacks Across the Globe Between 2008 and 2014
Table 2 Innovation & Patent Registrations, 2010 & 2016
Table 3 3D Radars Market Size, By Frequency Band, 2015-2022 (USD Million)
Table 4 C/S/X Band: 3D Radars Market Size, By Region, 2015-2022 (USD Million)
Table 5 E/F Band: 3D Radars Market Size, By Region, 2015-2022 (USD Million)
Table 6 L Band: Market Size, By Region, 2015-2022 (USD Million)
Table 7 Others: Market Size, By Region, 2015-2022 (USD Million)
Table 8 Market Size, By Range, 2015-2022 (USD Million)
Table 9 Long Range: 3D Radars Market Size, By Region, 2015-2022 (USD Million)
Table 10 Medium Range: 3D Radars Market Size, By Region, 2015-2022 (USD Million)
Table 11 Short Range: 3D Radars Market Size, By Region, 2015-2022 (USD Million)
Table 12 3D Radars Market Size, By Platform, 2015-2022 (USD Million)
Table 13 Airborne: 3D Radars Market Size, By Region, 2015-2022 (USD Million)
Table 14 Ground: Market Size, By Region, 2015-2022 (USD Million)
Table 15 Naval: Market Size, By Region, 2015-2022 (USD Million)
Table 16 3D Radars Market Size, By Region, 2015-2022 (USD Million)
Table 17 North America: 3D Radars Market Size, By Frequency Band, 2015-2022 (USD Million)
Table 18 North America: 3D Radars Market Size, By Range, 2015-2022 (USD Million)
Table 19 North America: 3D Radars Market Size, By Platform, 2015-2022 (USD Million)
Table 20 North America: 3D Radars Market Size, By Country, 2015-2022 (USD Million)
Table 21 US: 3D Radars Market Size, By Frequency Band, 2015-2022 (USD Million)
Table 22 US: 3D Radars Market Size, By Range, 2015-2022 (USD Million)
Table 23 US: 3D Radars Market Size, By Platform, 2015-2022 (USD Million)
Table 24 Canada: 3D Radars Market Size, By Frequency Band, 2015-2022 (USD Million)
Table 25 Canada: 3D Radars Market Size, By Range, 2015-2022 (USD Million)
Table 26 Canada: 3D Radars Market Size, By Platform, 2015-2022 (USD Million)
Table 27 Europe: 3D Radars Market Size, By Frequency Band, 2015-2022 (USD Million)
Table 28 Europe: 3D Radars Market Size, By Range, 2015-2022 (USD Million)
Table 29 Europe: 3D Radars Market Size, By Platform, 2015-2022 (USD Million)
Table 30 Europe: Market Size, By Country, 2015-2022 (USD Million)
Table 31 UK: Market Size, By Frequency Band, 2015-2022 (USD Million)
Table 32 UK: Market Size, By Range, 2015-2022 (USD Million)
Table 33 UK: Market Size, By Platform, 2015-2022 (USD Million)
Table 34 Germany: Market Size, By Frequency Band, 2015-2022 (USD Million)
Table 35 Germany: Market Size, By Range, 2015-2022 (USD Million)
Table 36 Germany: Market Size, By Platform, 2015-2022 (USD Million)
Table 37 France: 3D Radars Market Size, By Frequency Band, 2015-2022 (USD Million)
Table 38 France: Market Size, By Range, 2015-2022 (USD Million)
Table 39 France: Market Size, By Platform, 2015-2022 (USD Million)
Table 40 Russia: Market Size, By Frequency Band, 2015-2022 (USD Million)
Table 41 Russia: Market Size, By Range, 2015-2022 (USD Million)
Table 42 Russia: Market Size, By Platform, 2015-2022 (USD Million)
Table 43 Rest of Europe: 3D Radars Market Size, By Frequency Band, 2015-2022 (USD Million)
Table 44 Rest of Europe: Market Size, By Range, 2015-2022 (USD Million)
Table 45 Rest of Europe: Market Size, By Platform, 2015-2022 (USD Million)
Table 46 Asia Pacific: Market Size, By Frequency Band, 2015-2022 (USD Million)
Table 47 Asia Pacific: Market Size, By Range, 2015-2022 (USD Million)
Table 48 Asia Pacific: Market Size, By Platform, 2015-2022 (USD Billion)
Table 49 Asia Pacific: Market Size, By Country, 2015-2022 (USD Million)
Table 50 China: Market Size, By Frequency Band, 2015-2022 (USD Million)
Table 51 China: Market Size, By Range, 2015-2022 (USD Million)
Table 52 China: Market Size, By Platform, 2015-2022 (USD Million)
Table 53 India: Market Size, By Frequency Band, 2015-2022 (USD Million)
Table 54 India: Market Size, By Range, 2015-2022 (USD Million)
Table 55 India: Market Size, By Platform, 2015-2022 (USD Million)
Table 56 Japan: Market Size, By Frequency Band, 2015-2022 (USD Million)
Table 57 Japan: Market Size, By Range, 2015-2022 (USD Million)
Table 58 Japan: Market Size, By Platform, 2015-2022 (USD Million)
Table 59 Rest of Asia Pacific: 3D Radars Market Size, By Frequency Band, 2015-2022 (USD Million)
Table 60 Rest of Asia Pacific: Market Size, By Range, 2015-2022 (USD Million)
Table 61 Rest of Asia Pacific: Market Size, By Platform, 2015-2022 (USD Million)
Table 62 Middle East: Market Size, By Frequency Band, 2015-2022 (USD Million)
Table 63 Middle East: Market Size, By Range, 2015-2022 (USD Million)
Table 64 Middle East: Market Size, By Platform, 2015-2022 (USD Billion)
Table 65 Middle East: Market Size, By Country, 2015-2022 (USD Million)
Table 66 Saudi Arabia: Market Size, By Frequency Band, 2015-2022 (USD Million)
Table 67 Saudi Arabia: Market Size, By Range, 2015-2022 (USD Million)
Table 68 Saudi Arabia: Market Size, By Platform, 2015-2022 (USD Million)
Table 69 UAE: Market Size, By Frequency Band, 2015-2022 (USD Million)
Table 70 UAE: Market Size, By Range, 2015-2022 (USD Million)
Table 71 UAE: Market Size, By Platform, 2015-2022 (USD Million)
Table 72 Israel: Market Size, By Frequency Band, 2015-2022 (USD Million)
Table 73 Israel: Market Size, By Range, 2015-2022 (USD Million)
Table 74 Israel: Market Size, By Platform, 2015-2022 (USD Million)
Table 75 Rest of Middle East: 3D Radars Market Size, By Frequency Band, 2015-2022 (USD Million)
Table 76 Rest of Middle East: Market Size, By Range, 2015-2022 (USD Million)
Table 77 Rest of Middle East: Market Size, By Platform, 2015-2022 (USD Million)
Table 78 Rest of the World: Market Size, By Frequency Band, 2015-2022 (USD Million)
Table 79 Rest of the World: Market Size, By Range, 2015-2022 (USD Million)
Table 80 Rest of the World: Market Size, By Platform, 2015-2022 (USD Billion)
List of Figures (47 Figures)
Figure 1 Research Process Flow
Figure 2 Research Design
Figure 3 Breakdown of Primary Interviews: By Company Type, Designation, & Region
Figure 4 Market Size Estimation Methodology: Bottom-Up Approach
Figure 5 Market Size Estimation Methodology: Top-Down Approach
Figure 6 Data Triangulation
Figure 7 Assumptions of the Research Study
Figure 8 The C/S/X Band Segment is Projected to Lead the Market During the Forecast Period
Figure 9 The Long Range Segment Accounted for the Largest Share of the Market in 2017
Figure 10 Airborne Segment is Projected to Dominate the Market During the Forecast Period
Figure 11 The 3D Radars Market in Asia Pacific is Projected to Grow at the Highest CAGR During the Forecast Period
Figure 12 Contracts, Agreements & Collaborations Contributed A Major Share to Overall Developments By Key Players in the Aircraft Insulation Market From March 2010 to July 2017
Figure 13 Increasing Demand for 3D Radar in the Commercial & Defense Sectors is Driving the Demand in the Market
Figure 14 The C/S/X Segment is Projected to Lead the 3D Radars Market During the Forecast Period
Figure 15 The Air Borne Segment is Expected to Lead the 3D Radar During the Forecast Period
Figure 16 The Long Range Segment Will Lead the 3D Radars Market During the Forecast Period
Figure 17 North America Estimated to Account for the Largest Share in the Market in 2017
Figure 18 3D Radars Market: By Frequency Band
Figure 19 Market: By Range
Figure 20 Market: By Platform
Figure 21 Market: By Region
Figure 22 Drivers, Restraints, Opportunities & Challenges: 3D Radars Market
Figure 23 Market, By Region, 2016 & 2021 (USD Million)
Figure 24 Functions of 3D Radar By Airports
Figure 25 Market, By Region, 2015 & 2020 (USD Million)
Figure 26 Advanced Technologies Used in Market
Figure 27 The L Band Segment is Projected to Grow at the Highest CAGR During the Forecast Period
Figure 28 The Medium Range Segment is Projected to Grow at the Highest CAGR During the Forecast Period
Figure 29 The Ground Segment is Projected to Grow at the Highest CAGR During the Forecast Period
Figure 30 North America is Estimated to Account for the Largest Share of the Market in 2017
Figure 31 North America Market Snapshot
Figure 32 Europe 3D Radars Market Snapshot
Figure 33 Asia Pacific Market Snapshot
Figure 34 Middle East Market Snapshot
Figure 35 Market Ranking Analysis of the Key Players, 2017
Figure 36 Competitive Leadership Mapping, 2017
Figure 37 Northrop Grumman Corporation: Company Snapshot
Figure 38 Raytheon Company: Company Snapshot
Figure 39 Thales Group: Company Snapshot
Figure 40 BAE Systems Plc: Company Snapshot
Figure 41 Airbus Defense and Space: Company Snapshot
Figure 42 Honeywell International Inc.: Company Snapshot
Figure 43 SAAB Group: Company Snapshot
Figure 44 Harris Corporation: Company Snapshot
Figure 45 Leonardo S.p.A: Company Snapshot
Figure 46 ASELSAN A.S.: Company Snapshot
Figure 47 Rheinmetall AG : Company Snapshot
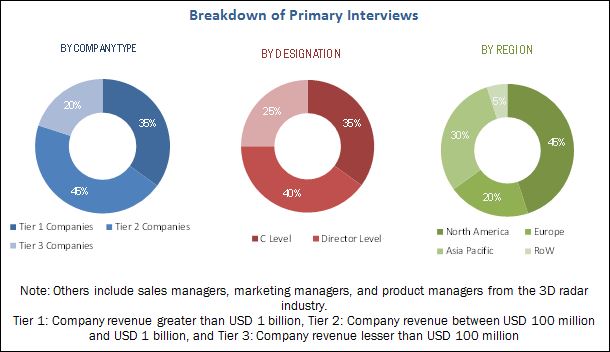
The research methodology that has been used to estimate and forecast the 3D radar market begins with capturing data on the revenues of the key 3D radar equipment through secondary sources such as Ministry of Defense (MOD) (India), Defence Research & Development Organization (DRDO) (India), and paid databases. The 3D radar offerings are also taken into consideration to determine the market segmentation. The bottom-up procedure has been employed to arrive at the overall size of the market from the revenue of key players in the market. After arriving at the overall market size, the total market has been split into several segments and subsegments, which have then been verified through primary research by conducting extensive interviews with key experts such as Chief Executive Officers (CEOs), Vice Presidents (VPs), directors, and executives of the leading companies operating in the market. The data triangulation and market breakdown procedures have been employed to complete the overall market engineering process and arrive at the exact statistics for all the segments and subsegments. The breakdown of profiles of primaries has been depicted in the figure below:
To know about the assumptions considered for the study, download the pdf brochure
The 3D radar ecosystem comprises airline component providers such as Northrop Grumman Corporation (US), Raytheon Company (US), Thales Group (France), Airbus Defense and Space (US), BAE Systems plc (UK), etc., and the manufacturers of different types of 3D radar such as Honeywell International Inc. (US), SAAB Group (Sweden), ELTA Systems Ltd. (Israel), Leonardo S.p.A. (Italy), Indra Sistemas, S.A. (Spain), etc.
Target Audience for this Report:
- Original Equipment Manufacturers (OEMs)
- Defense Organizations
- Manufacturers of Defense Systems
- Component and Material Manufacturers of 3D Radar Systems
- 3D Radar Research Centers
“This study on the 3D radar market answers several questions for the stakeholders, primarily which market segments to focus on in the next two to five years for prioritizing their efforts and investments.”
Scope of the Report
This research report categorizes the 3D radar market into the following segments:
-
3D Radar Market, by Range
- Long Range
- Medium Range
- Short Range
-
3D Radar Market, by Platform
- Airborne
- Ground
- Naval
-
3D Radar Market, by Frequency Band
- C/S/X Band
- E/F Band
- L Band
- Others
-
3D Radar Market, by Region
- North America
- Europe
- Asia Pacific
- Middle East
- Rest of the World
Available Customizations
Along with the market data, MarketsandMarkets offers customizations as per specific needs of the companies. The following customization options are available for the report on the 3D radar market:
-
Regional Analysis
- Further breakdown of the rest of the world 3D radar market
-
Company Information
- Detailed analysis and profiling of the additional market players (up to five)


Growth opportunities and latent adjacency in 3D Radar Market