Wireline Services Market by Application (Onshore & Offshore), Type (Electricline & Slickline), Services (Completion, Intervention, & Logging), Hole Type (Cased Hole & Open Hole), and Region - Global Forecasts to 2021


The global wireline services market is estimated to be USD 8.26 Billion in 2016, and is expected to grow at a CAGR of 2.1% from 2016 to 2021. Increasing oil production and aging reservoirs are major factors driving the wireline service market.
The years considered for the study are as follows:
- Base Year � 2015
- Estimated Year � 2016
- Projected Year � 2021
- Forecast Period � 2016 to 2021
2015 has been considered as the base year for company profiles. Whenever information was unavailable for the base year, the prior year has been considered.
Objectives of the Study
- To define, describe, and forecast the global wireline service market by wireline type, service, hole type, application, and region
- To provide detailed information regarding major factors influencing the growth of the market (drivers, restraints, opportunities, and industry-specific challenges)
- To strategically analyze the market with respect to individual growth trends, future prospects, and contribution of each segment to the market
- To strategically profile key players and comprehensively analyze their market shares and core competencies
- To track and analyze competitive developments such as contracts & agreements, expansions, new product developments, and mergers & acquisitions in the market
Research Methodology
This research study involved the use of extensive secondary sources, directories, and databases such as Hoovers, Bloomberg Businessweek, Factiva, and OneSource to identify and collect information useful for a technical, market-oriented, and commercial study of the global artificial lift market. Primary sources are mainly industry experts from core and related industries, preferred suppliers, manufacturers, distributors, service providers, technology developers, standard and certification organizations of companies, and organizations related to all the segments of this industry�s value chain. The points given below explain the research methodology.
- Study of annual revenue and market developments of major players that provide wireline services
- Analysis of major applications of and demand for wireline services for oil & gas operators
- Assessment of future trends and growth of onshore and offshore applications
- Assessment of the market with respect to the wireline type and service used for different applications
- Study of market trends in various regions/countries supported by various types of wireline services used for onshore and offshore applications
- Study of contracts and developments related to the market by key players across different regions
- Finalization of overall market sizes by triangulating the supply-side data, which includes product developments, supply chain, and annual revenues of companies providing wireline services across the globe
After arriving at the overall market size, the total market has been split into several segments and subsegments. The figure given below illustrates the breakdown of primaries conducted during the research study on the basis of company type, designation, and region.
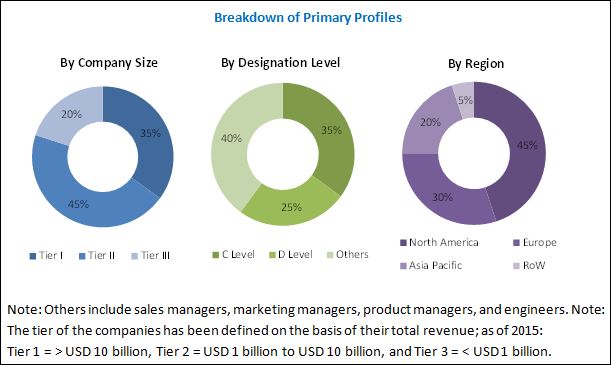
To know about the assumptions considered for the study, download the pdf brochure
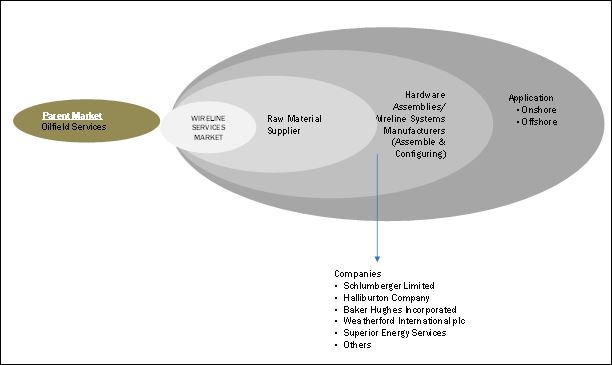
Market Ecosystem:
The ecosystem of the global wireline service market starts with the production and manufacturing of iron and steel. The manufactured parts are then assembled by the oilfield service providers to form wireline systems, which are then tested. This stage is followed by supply of the wireline systems to the oilfield operator companies.
Target Audience:
The report�s target audience includes:
- Oilfield service companies
- Exploration and production companies
- Wireline tools and equipment manufacturers
- Oil & gas field operators
- National Oil Companies (NOCs)
- Government and research organizations
- Consulting companies of the energy and power sector
- Power and energy associations
- Investment banks
Scope of the Report:
- By Wireline Type
- Electricline
- Slickline
- By Service
- Completion
- Well Intervention
- Logging
- By Hole Type
- Cased-Hole
- Open Hole
- By Application
- Onshore
- Offshore
- By Region
- North America
- Asia-Pacific
- Europe
- Middle East
- Africa
- South America
Available Customizations:
With the given market data, MarketsandMarkets offers customizations as per the client�s specific needs. The following customization options are available for this report:
Regional Analysis
Further breakdown of region/country-specific analysis
Company Information
Detailed analysis and profiling of additional market players (Up to 5)
Segment Analysis
Further segmental split of wireline services into shallow water and deep water regions under offshore applications
The global wireline services market is projected to grow at a CAGR of 2.1% from 2016 to 2021, to reach a market size of USD 9.15 Billion by 2021. This growth is attributed to increasing oil production and maturing oilfields.
The report segments the wireline market on the basis of hole type into cased-hole and open hole. The cased-hole segment is projected to dominate the wireline service market and is expected to grow at the highest CAGR from 2016 to 2021.
The wireline service market is segmented based on wireline type into electricline and slickline. The electricline segment accounted for the largest market share in 2015 and is expected to grow at the highest CAGR during the forecast period. The prominence of the electric line services over the slick line services can be attributed largely to the wide application of electricline for well logging purposes which prove very helpful for reservoir understanding and field development activity.
The report segments the wireline service market based on application into onshore and offshore. The offshore segment is expected to grow at the fastest rate during the forecast period, owing to use of wireline services for well service and completion applications. Asia-Pacific is the key market for offshore applications due to discovery of new reserves in the Gulf of Thailand, Great Australian Bight, Turkmenistan, and South China Sea.
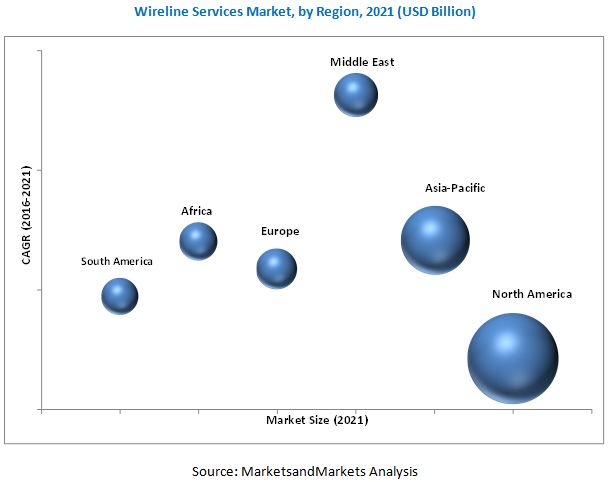
In this report, the wireline service market has been analyzed with respect to six regions, namely, North America, Asia-Pacific, Europe, the Middle East, Africa, and South America. North America is expected to dominate the global wireline service market during the forecast period, owing to the increasing shale gas production and offshore production.
The Middle East market is projected to grow at the highest CAGR from 2016 to 2021 due to the high use of enhanced oil recovery techniques in the region and the high oil production in the region. Qatar, Kuwait, and Saudi Arabia are expected to drive the wireline service market in the Middle East region.
Decline in oil prices could be a restraint for the market. Decline in oil prices has drastically affected the oil & gas exploration & production investments across the globe, leading to a sharp fall in the rate of oilfield services and lowering the revenues from wireline services.
Leading players in the wireline services market include Schlumberger Limited (U.S.), Halliburton Company (U.S.), Baker Hughes Incorporated (U.S.), Weatherford International PLC (Switzerland), and Superior Energy Services (U.S.). New product developments was the strategy most commonly adopted by top players in the market from 2013 to 2016. It was followed by contracts & agreements, expansions, and mergers & acquisitions.
To speak to our analyst for a discussion on the above findings, click Speak to Analyst
 Exclusive indicates content/data unique to MarketsandMarkets and not available with any competitors.
Table of Contents
1 Introduction (Page No. - 16)
1.1 Objectives of the Study
1.2 Market Definition
1.3 Study Scope
1.3.1 Markets Covered: Wireline Service Market
1.3.2 Geographic Scope
1.3.3 Years Considered for the Study
1.4 Currency
1.5 Limitations
1.6 Stakeholders
2 Research Methodology (Page No. - 20)
2.1 Research Data
2.1.1 Secondary Data
2.1.1.1 Key Data From Secondary Sources
2.1.2 Primary Data
2.1.2.1 Key Data From Primary Sources
2.1.2.2 Key Industry Insights
2.1.2.3 Breakdown of Primaries
2.2 Market Size Estimation
2.2.1 Bottom-Up Approach
2.2.2 Top-Down Approach
2.3 Data Triangulation Methodology
2.4 Research Assumptions
3 Executive Summary (Page No. - 28)
3.1 Introduction
3.2 Historical Backdrop, Evolution, & Current Scenario
3.3 Future Outlook
3.4 Conclusion
4 Premium Insights (Page No. - 33)
4.1 North America is Expected to Hold the Largest Market During the Forecast Period
4.2 Wireline Services Market, By Application
4.3 Market, By Service
4.4 Market, By Wireline Type
4.5 North America Market
5 Market Overview (Page No. - 37)
5.1 Introduction
5.2 Market Segmentation
5.2.1 Introduction
5.2.2 By Application
5.2.2.1 Onshore
5.2.2.2 Offshore
5.2.3 By Service
5.2.3.1 Well Completion
5.2.3.2 Well Intervention
5.2.3.3 Well Logging
5.2.4 By Wireline Type
5.2.4.1 Electric Line
5.2.4.2 Slickline
5.2.5 By Hole Type
5.2.5.1 Cased-Hole
5.2.5.2 Open Hole
5.3 Market Dynamics
5.3.1 Drivers
5.3.1.1 Aging Reservoirs
5.3.1.2 Increasing Oil Production
5.3.1.3 Lifting of Iranian Oil Export Sanctions
5.3.2 Restraints
5.3.2.1 Declining Oil Spending Due to Low Crude Oil Prices
5.3.2.2 Increasing Focus on Renewable Energy
5.3.2.2.1 Solar
5.3.2.2.2 Wind
5.3.3 Opportunities
5.3.3.1 New Oilfield Discoveries
5.3.3.2 Technological Advancements
5.3.4 Challenges
5.3.4.1 Regulatory Issues Regarding E&P Activities
5.4 Impact of Oil Price Decline
5.4.1 Value Chain Analysis
6 Wireline Service Market, By Application (Page No. - 49)
6.1 Introduction
6.2 Onshore
6.3 Offshore
7 Wireline Service Market, By Wireline Type (Page No. - 53)
7.1 Introduction
7.2 Electric Line
7.3 Slickline
8 Wireline Services Market, By Service (Page No. - 57)
8.1 Introduction
8.2 Well Logging
8.3 Well Intervention
8.4 Well Completion
9 Wireline Service Market, By Hole Type (Page No. - 61)
9.1 Introduction
9.2 Cased-Hole
9.3 Open Hole
10 Wireline Services Market, By Region (Page No. - 64)
10.1 Introduction
10.2 North America
10.2.1 By Hole Type
10.2.2 By Wireline Type
10.2.3 By Application
10.2.4 By Service
10.2.5 By Country
10.2.5.1 U.S.
10.2.5.2 Canada
10.2.5.3 Mexico
10.3 Asia-Pacific
10.3.1 By Hole Type
10.3.2 By Wireline Type
10.3.3 By Application
10.3.4 By Service
10.3.5 By Country
10.3.5.1 China
10.3.5.2 Thailand
10.3.5.3 Indonesia
10.3.5.4 India
10.3.5.5 Australia
10.3.5.6 Malaysia
10.3.5.7 Vietnam
10.3.5.8 Rest of Asia-Pacific
10.4 Europe
10.4.1 By Hole Type
10.4.2 By Wireline Type
10.4.3 By Application
10.4.4 By Service
10.4.5 By Country
10.4.5.1 Russia
10.4.5.2 The Netherlands
10.4.5.3 Norway
10.4.5.4 U.K.
10.4.5.5 Poland
10.4.5.6 Rest of Europe
10.5 Middle East
10.5.1 By Hole Type
10.5.2 By Wireline Type
10.5.3 By Application
10.5.4 By Service
10.5.5 By Country
10.5.5.1 UAE
10.5.5.2 Oman
10.5.5.3 Qatar
10.5.5.4 Saudi Arabia
10.5.5.5 Iran
10.5.5.6 Kuwait
10.5.5.7 Rest of Middle East
10.6 Africa
10.6.1 By Hole Type
10.6.2 By Wireline Type
10.6.3 By Application
10.6.4 By Service
10.6.5 By Country
10.6.5.1 Algeria
10.6.5.2 Angola
10.6.5.3 Egypt
10.6.5.4 Libya
10.6.5.5 Nigeria
10.6.5.6 Rest of Africa
10.7 South America
10.7.1 By Hole Type
10.7.2 By Wireline Type
10.7.3 By Application
10.7.4 By Service
10.7.5 By Country
10.7.5.1 Argentina
10.7.5.2 Brazil
10.7.5.3 Colombia
10.7.5.4 Ecuador
10.7.5.5 Trinidad & Tobago
10.7.5.6 Peru
10.7.5.7 Venezuela
10.7.5.8 Rest of South America
11 Competitive Landscape (Page No. - 106)
11.1 Overview
11.2 Market Share Analysis
11.3 Competitive Situation & Trends
11.4 Market Developments
11.4.1 Key New Product Developments
11.4.2 Key Contracts & Agreements
11.4.3 Key Expansions
11.4.4 Key Merger & Acquisitions
11.4.5 Other Developments, 2013�2016
12 Company Profiles (Page No. - 123)
(Overview, Products & Services, Strategies & Insights, Developments and MnM View)*
12.1 Introduction
12.2 Schlumberger Limited
12.3 Halliburton Company
12.4 Baker Hughes Incorporated
12.5 Weatherford International PLC.
12.6 Superior Energy Services, Inc.
12.7 Pioneer Energy Services Corp.
12.8 C&J Energy Services Ltd.
12.9 Expro International Group Holding Ltd.
12.10 Archer Limited
12.11 National Oilwell Varco, Inc.
12.12 Basic Energy Services, Inc.
12.13 Oilserv
12.14 Wireline Engineering Ltd.
*Details on Overview, Products & Services, Strategies & Insights, Developments and MnM View Might Not Be Captured in Case of Unlisted Companies.
13 Appendix (Page No. - 156)
13.1 Insights of Industry Experts
13.2 Discussion Guide
13.3 Knowledge Store: Marketsandmarkets� Subscription Portal
13.4 Introducing RT: Real-Time Market Intelligence
13.5 Available Customizations
13.6 Related Reports
13.7 Author Details
List of Tables (89 Tables)
Table 1 Investment in Renewable Energy, By Sector, 2015
Table 2 Wireline Services Market Size, By Application, 2014�2021 (USD Million)
Table 3 Onshore: Market Size, By Region, 2014�2021 (USD Million)
Table 4 Offshore: Market Size, By Region, 2014�2021 (USD Million)
Table 5 Market Size, By Wireline Type, 2014�2021 (USD Million)
Table 6 Electric Line: Market Size, By Hole Type, 2014�2021 (USD Million)
Table 7 Slickline: Market Size, By Hole Type, 2014�2021 (USD Million)
Table 8 Electric Line: Market Size, By Region, 2014�2021 (USD Million)
Table 9 Slickline: Market Size, By Region, 2014�2021 (USD Million)
Table 10 Market Size, By Service, 2014-2021 (USD Million)
Table 11 Well Logging: Market Size, By Region, 2014�2021 (USD Million)
Table 12 Well Intervention: Market Size, By Region, 2014�2021 (USD Million)
Table 13 Well Completion: Market Size, By Region, 2014�2021 (USD Million)
Table 14 Market Size, By Hole Type, 2014�2021 (USD Million)
Table 15 Cased-Hole: Market Size, By Wireline Type, 2014�2021 (USD Million)
Table 16 Open Hole: Market Size, By Wireline Type, 2014�2021 (USD Million)
Table 17 Market Size, By Region, 2014�2021 (USD Million)
Table 18 North America: Wireline Service Market Size, By Country, 2014�2021 (USD Million)
Table 19 North America: Market Size, By Hole Type, 2014�2021 (USD Million)
Table 20 North America: Market Size, By Wireline Type, 2014�2021 (USD Million)
Table 21 North America: Market Size, By Application, 2014�2021 (USD Million)
Table 22 North America: Market Size, By Service, 2014�2021 (USD Million)
Table 23 U.S.: Market Size, By Service, 2014�2021 (USD Million)
Table 24 Canada: Market Size, By Service, 2014�2021 (USD Million)
Table 25 Mexico: Market Size, By Service, 2014�2021 (USD Million)
Table 26 Asia-Pacific: Wireline Service Market Size, By Country, 2014�2021 (USD Million)
Table 27 Asia-Pacific: Market Size, By Hole Type, 2014�2021 (USD Million)
Table 28 Asia-Pacific: Market Size, By Wireline Type, 2014�2021 (USD Million)
Table 29 Asia-Pacific: Market Size, By Application, 2014�2021 (USD Million)
Table 30 Asia-Pacific: Market Size, By Service, 2014�2021 (USD Million)
Table 31 China: Market Size, By Service, 2014�2021 (USD Million)
Table 32 Thailand: Market Size, By Service, 2014�2021 (USD Million)
Table 33 Indonesia: Market Size, By Service, 2014�2021 (USD Million)
Table 34 India: Market Size, By Service, 2014�2021 (USD Million)
Table 35 Australia: Market Size, By Service, 2014�2021 (USD Million)
Table 36 Malaysia: Market Size, By Service, 2014�2021 (USD Million)
Table 37 Vietnam: Market Size, By Service, 2014�2021 (USD Million)
Table 38 Rest of Asia-Pacific: Market Size, By Service, 2014�2021 (USD Million)
Table 39 Europe: Wireline Service Market Size, By Country, 2014�2021 (USD Million)
Table 40 Europe: Market Size, By Hole Type, 2014�2021 (USD Million)
Table 41 Europe: Market Size, By Wireline Type, 2014�2021 (USD Million)
Table 42 Europe: Market Size, By Application, 2014�2021 (USD Million)
Table 43 Europe: Market Size, By Service, 2014�2021 (USD Million)
Table 44 Russia: Market Size, By Service, 2014�2021 (USD Million)
Table 45 The Netherlands: Market Size, By Service, 2014�2021 (USD Million)
Table 46 Norway: Market Size, By Service, 2014�2021 (USD Million)
Table 47 U.K.: Market Size, By Service, 2014�2021 (USD Million)
Table 48 Poland: Market Size, By Service, 2014�2021 (USD Million)
Table 49 Rest of Europe: Market Size, By Service, 2014�2021 (USD Million)
Table 50 Middle East: Wireline Service Market Size, By Country, 2014�2021 (USD Million)
Table 51 Middle East: Market Size, By Hole Type, 2014�2021 (USD Million)
Table 52 Middle East: Market Size, By Wireline Type, 2014�2021 (USD Million)
Table 53 Middle East: Market Size, By Application, 2014�2021 (USD Million)
Table 54 Middle East: Market Size, By Service, 2014�2021 (USD Million)
Table 55 UAE: Market Size, By Service, 2014�2021 (USD Million)
Table 56 Oman: Wireline Services By Market Size, By Service, 2014�2021 (USD Million)
Table 57 Qatar: Market Size, By Service, 2014�2021 (USD Million)
Table 58 Saudi Arabia: Market Size, By Service, 2014�2021 (USD Million)
Table 59 Iran: Market Size, By Service, 2014�2021 (USD Million)
Table 60 Kuwait: Market Size, By Service, 2014�2021 (USD Million)
Table 61 Rest of Middle East: Market Size, By Service, 2014�2021 (USD Million)
Table 62 Africa: Wireline Service Market Size, By Country, 2014�2021 (USD Million)
Table 63 Africa: Market Size, By Hole Type, 2014�2021 (USD Million)
Table 64 Africa: Market Size, By Wireline Type, 2014�2021 (USD Million)
Table 65 Africa: Market Size, By Application, 2014�2021 (USD Million)
Table 66 Africa: Market Size, By Service, 2014�2021 (USD Million)
Table 67 Algeria: Market Size, By Service, 2014�2021 (USD Million)
Table 68 Angola: Market Size, By Service, 2014�2021 (USD Million)
Table 69 Egypt: Market Size, By Service, 2014�2021 (USD Million)
Table 70 Libya: Market Size, By Service, 2014�2021 (USD Million)
Table 71 Nigeria: Market Size, By Service, 2014�2021 (USD Million)
Table 72 Rest of Africa: Market Size, By Service, 2014�2021 (USD Million)
Table 73 South America: Market Size, By Country, 2014�2021 (USD Million)
Table 74 South America: Market Size, By Hole Type, 2014�2021 (USD Million)
Table 75 South America: Market Size, By Wireline Type, 2014�2021 (USD Million)
Table 76 South America: Market Size, By Application, 2014�2021 (USD Million)
Table 77 South America: Market Size, By Service, 2014�2021 (USD Million)
Table 78 Argentina: Market Size, By Service, 2014�2021 (USD Million)
Table 79 Brazil: Market Size, By Service, 2014�2021 (USD Million)
Table 80 Colombia: Market Size, By Service, 2014�2021 (USD Million)
Table 81 Ecuador: Market Size, By Service, 2014�2021 (USD Million)
Table 82 Trinidad & Tobago: Market Size, By Service, 2014�2021 (USD Million)
Table 83 Peru: Market Size, By Service, 2014�2021 (USD Million)
Table 84 Venezuela: Market Size, By Service, 2014�2021 (USD Million)
Table 85 Rest of South America: Market Size, By Service, 2014�2021 (USD Million)
Table 86 Key New Product Developments, 2015�2016
Table 87 Key Contracts & Agreements, 2015�2016
Table 88 Key Expansions, 2014�2016
Table 89 Key Merger & Acquisitions, 2014�2016
List of Figures (56 Figures)
Figure 1 Research Design: Wireline Service Market
Figure 2 Bottom-Up Approach
Figure 3 Top-Down Approach
Figure 4 Assumptions of the Research Study
Figure 5 North America Accounted for the Largest Market Share in the Market in 2015
Figure 6 Cased-Hole Segment is Expected to Dominate the Market During the Forecast Period
Figure 7 Electric Line Segment is Expected to Witness the Maximum Demand During the Forecast Period
Figure 8 North America is Projected to Dominate the Market, 2016�2021
Figure 9 Well Intervention Segment is Expected to Grow at the Highest CAGR From 2016 to 2021
Figure 10 Top Market Developments (2012�2016)
Figure 11 Attractive Market Opportunities in the Market, 2016�2021
Figure 12 Middle East & Africa is Expected to Grow at the Highest CAGR From 2016 to 2021
Figure 13 Offshore Segment is Expected to Grow at the Fastest Rate During the Forecast Period
Figure 14 Demand From the Well Logging Segment is Expected to Dominate the Wireline Service Market, 2016�2021
Figure 15 Electric Line Segment is Expected to Grow at the Highest CAGR From 2016 to 2021
Figure 16 U.S. Accounted for the Largest Share in the North American Wireline Service Market in 2015
Figure 17 Market Segmentation: Wireline Service Market
Figure 18 Geographic Scope: Market
Figure 19 Increasing Production From Existing Wells in the U.S. & the OPEC Countries is Expected to Generate Demand for Wireline Services
Figure 20 Global Oil Production & Consumption, 2011�2017
Figure 21 Iran Oil Production, 2007�2017
Figure 22 Decline in Crude Oil Prices Since 2014 has Continued in 2016
Figure 23 Oil & Gas RIG Count has Seen A Decreasing Trend Worldwide in 2016
Figure 24 Investment in Renewable Energy, By Region, 2015 (USD Billion)
Figure 25 Solar PV Global Capacity, 2011�2014 (Gigawatts)
Figure 26 Annual Installed Wind Capacity, 2014�2019 (Gigawatts)
Figure 27 Value Chain Analysis: Market
Figure 28 Onshore Application Dominated the Market, 2015
Figure 29 Electric Line is the Largest Market Segment for Wireline Services, 2016�2021
Figure 30 Well Logging Services Segment Dominates the Market, 2016 & 2021
Figure 31 Wireline Service Market: Hole Type
Figure 32 Market Size, By Region, 2014�2021 (USD Million)
Figure 33 Geographic Snapshot, 2016
Figure 34 North America: Overview of the Market
Figure 35 Asia-Pacific: Overview of the Market
Figure 36 Companies Adopted Contracts & Agreements as the Key Growth Strategy, 2013�2016
Figure 37 Market Share Analysis, By Value, 2015
Figure 38 Market Evaluation Framework, 2013�2016
Figure 39 Battle for Market Share: New Product Launches and Contracts & Agreements Were the Key Strategies, 2013�2016
Figure 40 Regional Revenue Mix of the Top 5 Market Players
Figure 41 Schlumberger Limited: Company Snapshot
Figure 42 Schlumberger Limited: SWOT Analysis
Figure 43 Halliburton Company: Company Snapshot
Figure 44 Halliburton Company: SWOT Analysis
Figure 45 Baker Hughes Incorporated: Company Snapshot
Figure 46 Baker Hughes Incorporated: SWOT Analysis
Figure 47 Weatherford International PLC.: Company Snapshot
Figure 48 Weatherford International PLC.: SWOT Analysis
Figure 49 Superior Energy Services, Inc.: Company Snapshot
Figure 50 Superior Energy Services, Inc.: SWOT Analysis
Figure 51 Pioneer Energy Services Corp.: Company Snapshot
Figure 52 C&J Energy Services Ltd.: Company Snapshot
Figure 53 Expro International Group Holding Ltd.: Company Snapshot
Figure 54 Archer Limited: Company Snapshot
Figure 55 National Oilwell Varco, Inc.: Company Snapshot
Figure 56 Basic Energy Services, Inc.: Company Snapshot


Growth opportunities and latent adjacency in Wireline Services Market