Drilling Waste Management Market by Service (Treatment & Disposal, Containment & Handling, & Solids Control), Application (Onshore & Offshore), & Region (North America, Europe, Asia-Pacific, South America, Middle East, & Africa) - Global Forecast to 2020


[202 Pages Report] The global drilling waste management market is estimated to be USD 3.80 Billion in 2015, and is projected to reach USD 5.08 Billion by 2020. The market is projected to grow at a CAGR of 6.0% from 2015 to 2020. Rapid technological developments improving the drilling and production capability aid exploration and production activities in the deep-water and ultra-deep-water areas across the globe. These factors boost the market. The drilling waste management contains three types of processes, namely, solids control, containment & handling, and treatment & disposal. The market is segmented on the basis of application and type of service. On the basis of application, the market is divided under the hood�onshore and offshore.
Years considered for the study:
Base Year: 2014
Forecast Years: 2015-estimated, 2020-predicted
Research Methodology
- Major services were identified along with the number of same applied and practiced in each region across the globe
- Secondary�s were conducted to find the number of drilled wells and depth of the wells drilled globally across various countries and their contribution to the market
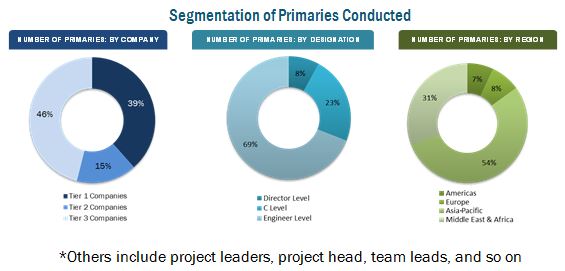
- The drilling waste management market was identified as per the application being onshore and offshore and the split was calculated by conducting primary�s with industry participants, subject-matter experts, C-level executives of key market players, and industry consultants among other experts, which helped to obtain and verify critical qualitative and quantitative information as well as assess future market prospects
- Top companies� revenues (regional/global), drilling waste services pricing, and industry trends along with top-down, bottom-up, and MnM KNOW were used to estimate the market size
- This was further broken down into several segments and subsegments on the basis of information gathered
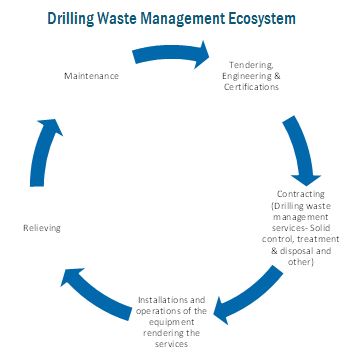
Market Ecosystem
Target Audience
- Original Equipment Manufacturers (OEMs)
- EPC Companies
- Oil & Gas Service Providers
- Distributers & Suppliers
- Consulting Firms
- Private Equity Groups
- Investment Houses
- Equity Research Firms
- Other Stakeholders
Scope of the Report
- This study estimates the global drilling waste management market, in terms of dollar value, till 2020
- It offers a detailed qualitative and quantitative analysis of this market
- It provides a comprehensive review of major market drivers, restraints, opportunities, challenges, winning imperatives, and key issues of the market
- It covers various important aspects of the market. These include analysis of value chain, Porter�s Five Forces model, competitive landscape, market dynamics, market estimates in terms of value, and future trends in the drilling waste management market.
The market has been segmented into:
On the following basis:
- By Application:
- Onshore
- Offshore
- By Service:
- Solid Control
- Containment & Handling
- Treatment & disposal
- By Region:
- North America
- South America
- Europe
- Asia-Pacific
- The Middle East
- Africa
Available Customization
With the market data provided above, MarketsandMarkets offers customizations as per the company�s specific needs. The following customization options are available for the report:
- Detailed analysis and profiling of additional market players (Up to 5)
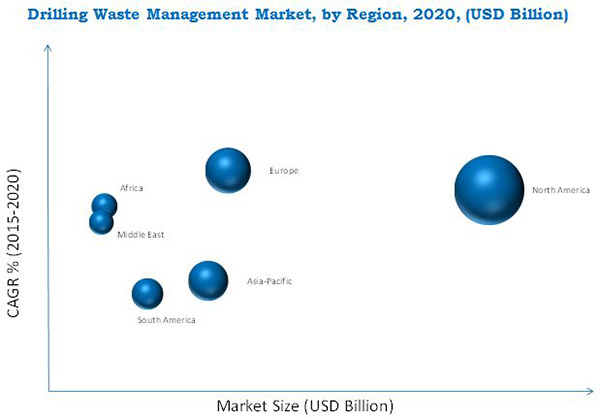
The global drilling waste management market is expected to grow from USD 3.80 Billion in 2015 to USD 5.08 Billion by 2020, at a CAGR of 6.0%. North America accounted for the largest market share due to the abundance of the drilling activities created by the increase of the shale oil. Europe is projected to grow at the highest CAGR during the forecast period which can be attributed to the maturing fields in the region.
The increase in the energy demand has resulted in the rise in oil & gas production from the regions such as North America and the Middle East. Due to this increase, there is increase in the exploration & production activities in the region. The drilling activity process plays a crucial role for oil & gas Exploration and Production (E&P). This increase in the drilling activities results in the surge of the waste produced while drilling which comprises of the drilling mud and cuttings. Therefore, it is very important to have a suitable waste management application for drilling processes, safeguarding the environment. Increase in production and exploration activities provides opportunities of drilling waste management.
The drilling waste management market has also been classified on the basis of services such as treatment & disposal, solid control, and containment & handling. Nearly two-fifth of the market is covered by treatment & disposal a service which includes the services such as onsite burial (pits and landfills), land farming, land spreading, bioremediation, thermal treatment, and slurry injection among others. Solid control services occupy the second largest market share and are growing at a moderate pace. The recent slump in the crude oil prices has resulted in the decrement of the market size in 2015 and is expected to regain the market in the coming years.
The drilling waste management market has also been classified on the basis of application into onshore and offshore. Onshore application market occupies the major share among the application segment and is expected to grow at a steady rate during the forecast period. It finds its major market in the North American and European region. Offshore market is expected to grow at a much faster pace, reasons for which can be attributed to the strict waste management regulations, high cost of the treatment and increase in the drilling activities in the deep and ultra-deep region.
The recent decline of oil prices have affected the exploration & production activities across various regions and so the revenues of oil & gas operators. Trickling down the effect, there has been decline in new field exploration activities and so the growth of drilling waste management is sluggish in 2015.
Various players in the market are focusing on contracts & agreements for their geographical expansion and surge in the customer base. For instance, Halliburton Co. offers products and services to the energy industry. Waste management services are provided under the product name Baroid, which gives solutions to waste handling & transport and waste treatment & disposal. In November 2014, Halliburton and Baker Hughes Incorporated (U.S.) reached a definitive agreement to combine the two companies and secured a unanimous approval from their board of directors. The new entity would retain the name Halliburton and would be headquartered at Houston, Texas. The merger nearly saved USD 2.0 Billion for the new company by creating synergies and generating increased cash flows.
 Exclusive indicates content/data unique to MarketsandMarkets and not available with any competitors.
Table of Contents
1 Introduction (Page No. - 15)
1.1 Objectives of the Study
1.2 Market Definition
1.3 Market Scope
1.3.1 Markets Covered
1.3.2 Years
1.3.3 Currency
1.3.4 Package Size
1.3.5 Stakeholders
2 Research Methodology (Page No. - 18)
2.1 Research Data
2.1.1 Secondary Data
2.1.1.1 Key Data From Secondary Sources
2.1.2 Primary Data
2.1.2.1 Key Data From Primary Sources
2.1.2.2 Key Industry Insights
2.1.2.3 Breakdown of Primaries
2.2 Market Size Estimation
2.3 Market Breakdown and Data Triangulation
2.4 Research Assumptions and Limitations
2.4.1 Assumptions
2.4.2 Limitations
3 Executive Summary (Page No. - 28)
3.1 Introduction
3.2 Historical Scenario
3.3 Current Scenario
3.4 Future Outlook
3.5 Conclusion
4 Premium Insights (Page No. - 33)
4.1 North America is Expected to Account for the Largest Market Share During the Forecast Period
4.2 Drilling Waste Management Market, By Application
4.3 Drilling Waste Management Market, By Service
4.4 Drilling Waste Management Market, By Region
4.5 Life Cycle Analysis, By Region
5 Market Overview (Page No. - 38)
5.1 Introduction
5.2 Environmental Impact
5.3 Waste Management Hierarchy
5.3.1 Waste Minimization
5.3.2 Reuse Or Recycling
5.3.3 Treatment & Disposal
5.4 Market Dynamics
5.4.1 Drivers
5.4.1.1 Growing Environmental Concerns
5.4.1.2 Stringent Government Regulations
5.4.1.3 Introduction of New Drilling Technologies
5.4.2 Restraint
5.4.2.1 Slump in Crude Oil Prices
5.4.3 Opportunities
5.4.3.1 Drilling Developments
5.4.3.2 New Completion Requirements
5.4.3.3 New Oil Production Sources
5.4.4 Challenges
5.4.4.1 Operational & Economic Challenges
5.4.4.2 Intense Competition in the Service Market
5.5 Impact of Market Dynamics
5.6 Winning Imperatives
5.6.1 Research & Development for Superior Treatment Technology
5.6.2 Goal to Achieve Zero Discharge
5.7 Burning Issues
5.7.1 Lack of Experienced Personnel
6 Industry Trends (Page No. - 53)
6.1 Value Chain Analysis
6.1.1 Equipment Manufacturers/Suppliers
6.1.2 Service Providers
6.1.3 Oil- & Gas-Producing Companies
6.2 Porter�s Five Forces Analysis
6.2.1 Threat of Substitutes
6.2.2 Bargaining Power of Buyers
6.2.3 Bargaining Power of Suppliers
6.2.4 Threat of New Entrants
6.2.5 Intensity of Competitive Rivalry
6.3 Supply Chain Analysis
7 Drilling Waste Management Market, By Service (Page No. - 58)
7.1 Introduction
7.2 Treatment & Disposal
7.3 Solids Control
7.4 Containment & Handling
8 Drilling Waste Management Market, By Application (Page No. - 65)
8.1 Introduction
8.2 Onshore
8.3 Offshore
9 Drilling Waste Management Market, By Region (Page No. - 70)
9.1 Introduction
9.2 North America
9.2.1 By Application
9.2.2 By Service
9.2.3 By Country
9.2.3.1 U.S.
9.2.3.1.1 Drilling Waste Industry Regulation
9.2.3.2 Canada
9.2.3.2.1 Drilling Waste Industry Regulation
9.2.3.3 Mexico
9.2.3.3.1 Drilling Waste Industry Regulation
9.3 Europe
9.3.1 By Application
9.3.2 By Service
9.3.3 By Country
9.3.3.1 Russia
9.3.3.1.1 Drilling Waste Industry Regulation
9.3.3.2 Norway
9.3.3.2.1 Drilling Waste Industry Regulation
9.3.3.3 U.K.
9.3.3.3.1 Drilling Waste Industry Regulation
9.3.3.4 Others (Europe)
9.4 Asia-Pacific
9.4.1 By Application
9.4.2 By Service
9.4.3 By Country
9.4.3.1 China
9.4.3.2 Central Asia
9.4.3.3 Thailand
9.4.3.4 India
9.4.3.5 Australia
9.4.3.6 Indonesia
9.4.3.7 Malaysia
9.4.3.8 Others (Asia-Pacific)
9.5 South America
9.5.1 By Application
9.5.2 By Service
9.5.3 By Country
9.5.3.1 Venezuela
9.5.3.1.1 Drilling Waste Industry Regulation
9.5.3.2 Argentina
9.5.3.2.1 Drilling Waste Industry Regulation
9.5.3.3 Brazil
9.5.3.3.1 Drilling Waste Industry Regulation
9.5.3.4 Others (South America)
9.6 Africa
9.6.1 By Application
9.6.2 By Service
9.6.3 By Country
9.6.3.1 Egypt
9.6.3.2 Nigeria
9.6.3.3 Angola
9.6.3.4 Algeria
9.6.3.5 Libya
9.6.3.6 Others (Africa)
9.7 Middle East
9.7.1 By Application
9.7.2 By Service
9.7.3 By Country
9.7.3.1 Oman
9.7.3.1.1 Drilling Waste Industry Regulation
9.7.3.2 Saudi Arabia
9.7.3.2.1 Drilling Waste Industry Regulation
9.7.3.3 Kuwait
9.7.3.3.1 Drilling Waste Industry Regulation
9.7.3.4 UAE
9.7.3.4.1 Drilling Waste Industry Regulation
9.7.3.5 Qatar
9.7.3.5.1 Drilling Waste Industry Regulation
9.7.3.6 Iraq
9.7.3.7 Turkey
9.7.3.8 Yemen
9.7.3.9 Others (Middle East)
10 Competitive Landscape (Page No. - 113)
10.1 Overview
10.2 Competitive Situation & Trends
10.3 Market Share Analysis, By Key Players
10.4 Contracts & Agreements
10.5 New Product/Technology Launches
10.6 Expansions
10.7 Mergers & Acquisitions
10.8 Joint Ventures
11 Company Profiles (Page No. - 121)
(Business Overview, Products & Services Offered, Developments, SWOT Analysis, and MnM View)*
11.1 Introduction
11.2 Schlumberger Limited.
11.3 Halliburton Company
11.4 Baker Hughes Incorporated
11.5 Weatherford International PLC.
11.6 National Oilwell Varco, Inc.
11.7 Scomi Group Bhd
11.8 Hebei Gn Solids Control Co. Ltd.
11.9 Newalta Corporation,
11.10 Nuverra Environmental Solutions
11.11 Secure Energy Services, Inc.
11.12 Imdex Limited
11.13 Augean PLC.
11.14 Xi�an Kosun Machinery Co., Ltd.
11.15 Derrick Equipment Company
11.16 Ridgeline Canada, Inc.
11.17 Soiltech as
11.18 Soli-Bond, Inc.
11.19 Specialty Drilling Fluids Ltd.
11.20 Step Oiltools
11.21 Tervita Corporation
11.22 Twma Ltd.
*Details on Business Overview, Products & Services Offered, Developments, SWOT Analysis, MnM View Might Not Be Captured in Case of Unlisted Companies.
12 Appendix (Page No. - 184)
12.1 Discussion Guide
12.2 Key Player Developments
12.2.1 Mergers & Acquisitions
12.2.2 Joint Ventures
12.2.3 New Product/Technology Launches
12.2.4 Expansions
12.2.5 Contracts & Agreements
12.3 Knowledge Store: Marketsandmarkets� Subscription Portal
12.4 Introducing RT: Real-Time Market Intelligence
12.5 Available Customizations
12.6 Related Reports
List of Tables (79 Tables)
Table 1 Constituents That Impact the Environment, By Waste Type
Table 2 Expopsure Type and Its Duration
Table 3 Elemental Composition of Drilling Mud (Mg/Kg)
Table 4 Waste Minimization Technologies
Table 5 Drill Cuttings Reuse & Recycle Management Options
Table 6 Drill Cuttings & Drilling Fluid Disposal Technologies
Table 7 Impact of Market Dynamics
Table 8 Drilling Waste Management Market Size, By Service, 2013�2020 (USD Million)
Table 9 Treatment & Disposal: Market Size, By Region, 2013�2020 (USD Million)
Table 10 Solids Control: Market Size, By Region, 2013�2020 (USD Million)
Table 11 Containment & Handling: Market Size, By Region, 2013�2020 (USD Million)
Table 12 Drilling Waste Management Market, By Application, 2013�2020 (USD Million)
Table 13 Onshore: Market, By Region, 2013�2020 (USD Million)
Table 14 Offshore: Market, By Region, 2013�2020 (USD Million)
Table 15 Drilling Waste Management Market Size, By Region, 2013�2020 (USD Million)
Table 16 North America: Market Size, By Application, 2013�2020 (USD Million)
Table 17 North America: Market Size, By Service, 2013�2020 (USD Million)
Table 18 North America: Market Size, By Country, 2013�2020 (USD Million)
Table 19 U.S. California: Discharge Practices & Standards for Drilling Mud & Cuttings
Table 20 U.S. Gom: Discharge Practices & Standards for Drilling Mud & Cuttings
Table 21 U.S.: Market Size, By Service, 2013�2020 (USD Million)
Table 22 Canada: Market Size, By Service, 2013�2020 (USD Million)
Table 23 Mexico: Market Size, By Service, 2013�2020 (USD Million)
Table 24 Europe: Market Size, By Application, 2013�2020 (USD Million)
Table 25 Europe: Market Size, By Service, 2013�2020 (USD Million)
Table 26 Europe: Market Size, By Country, 2013�2020 (USD Million)
Table 27 Russia: Market Size, By Service, 2013�2020 (USD Million)
Table 28 Norway: Market Size, By Service, 2013�2020 (USD Million)
Table 29 U.K.: Market Size, By Service, 2013�2020 (USD Million)
Table 30 Others (Europe): Market Size, By Service, 2013�2020 (USD Million)
Table 31 Asia-Pacific: Market Size, By Application, 2013�2020 (USD Million)
Table 32 Asia-Pacific:Market Size, By Service, 2013�2020 (USD Million)
Table 33 Asia-Pacific: Market Size, By Country, 2013�2020 (USD Million)
Table 34 China: Market Size, By Service, 2013�2020 (USD Million)
Table 35 Central Asia: Market Size, By Service, 2013�2020 (USD Million)
Table 36 Thailand: Market Size, By Service, 2013�2020 (USD Million)
Table 37 India: Drilling Waste Management Market Size, By Service, 2013�2020 (USD Million)
Table 38 Australia: Market Size, By Service, 2013�2020 (USD Million)
Table 39 Indonesia: Market Size, By Service, 2013�2020 (USD Million)
Table 40 Malaysia:Market Size, By Service, 2013�2020 (USD Million)
Table 41 Others (Asia-Pacific): Market Size, By Service, 2013�2020 (USD Million)
Table 42 South America: Market Size, By Application, 2013�2020 (USD Million)
Table 43 South America: Market Size, By Service, 2013�2020 (USD Million)
Table 44 South America: Market Size, By Country, 2013�2020 (USD Million)
Table 45 Venezuela: Market Size, By Service, 2013�2020 (USD Million)
Table 46 Argentina: Market Size, By Service, 2013�2020 (USD Million)
Table 47 Brazil: Market Size, By Service, 2013�2020 (USD Million)
Table 48 Others (South America): Market Size, By Service, 2013�2020 (USD Million)
Table 49 Africa: Market Size, By Application, 2013�2020 (USD Million)
Table 50 Africa: Market Size, By Service, 2013�2020 (USD Million)
Table 51 Africa:Market Size, By Country, 2013�2020 (USD Million)
Table 52 Egypt: Market Size, By Service, 2013�2020 (USD Million)
Table 53 Nigeria: Market Size, By Service, 2013�2020 (USD Million)
Table 54 Angola:Market Size, By Service, 2013�2020 (USD Million)
Table 55 Algeria: Market Size, By Service, 2013�2020 (USD Million)
Table 56 Libya: Market Size, By Service, 2013�2020 (USD Million)
Table 57 Others (Africa): Market Size, By Service, 2013�2020 (USD Million)
Table 58 Middle East: Market Size, By Application, 2013�2020 (USD Million)
Table 59 Middle East: Market Size, By Service, 2013�2020 (USD Million)
Table 60 Middle East: Market Size, By Country, 2013�2020 (USD Million)
Table 61 Oman: Market Size, By Service, 2013�2020 (USD Million)
Table 62 Saudi Arabia: Market Size, By Service, 2013�2020 (USD Million)
Table 63 Kuwait: Market Size, By Service, 2013�2020 (USD Million)
Table 64 UAE: Market Size, By Service, 2013�2020 (USD Million)
Table 65 Qatar: Market Size, By Service, 2013�2020 (USD Million)
Table 66 Iraq: Market Size, By Service, 2013�2020 (USD Million)
Table 67 Turkey: Market Size, By Service, 2013�2020 (USD Million)
Table 68 Yemen: Market Size, By Service, 2013�2020 (USD Million)
Table 69 Others: Market Size, By Service, 2013�2020 (USD Million)
Table 70 Contracts & Agreements, 2015�January 2016
Table 71 New Product/Technology Launches, 2014�2015
Table 72 Expansions, 2014�2015
Table 73 Mergers & Acquisitions, 2013�2014
Table 74 Joint Ventures, 2010�2014
Table 75 Mergers & Acquisitions, 2011�2014
Table 76 Joint Ventures, 2010�2015
Table 77 New Product/Technology Launches, 2010�2015
Table 78 Investments & Expansions, 2010�2015
Table 79 Contracts & Agreements, 2010�2015
List of Figures (55 Figures)
Figure 1 Markets Covered: Market
Figure 2 Drilling Waste Management Market: Research Design
Figure 3 Breakdown of Primary Interviews: By Company Type, Designation, & Region
Figure 4 Market Size Estimation Methodology: Bottom-Up Approach
Figure 5 Market Size Estimation Methodology: Top-Down Approach
Figure 6 Data Triangulation
Figure 7 North America Accounted for the Largest Market Share in the Drilling Waste Management Market in 2014
Figure 8 Onshore Segment is Expected to Dominate the Market During the Forecast Period
Figure 9 Treatment & Disposal Segment of the Market is Expected to Account for the Maximum Demand During the Forecast Period
Figure 10 North America is Expected to Dominate the Market During the Forecast Period
Figure 11 Attractive Market Opportunities for Drilling Waste Management in Treatment and Disposal Services
Figure 12 Europe is Expected to Grow at the Highest CAGR During the Forecast Period
Figure 13 Onshore Drilling Waste Management Application is Expected to Dominate the Drilling Waste Management Market During the Forecast Period
Figure 14 Treatment & Disposal Service Segment is Expected to Hold the Largest Market Share in the Market During the Forecast Period
Figure 15 North America is Expected to Lead the Market Compared With the Other Regions During the Forecast Period
Figure 16 North America and Europe are Into the Maturity Phase in the Global Market, 2014
Figure 17 Waste Management Hierarchy
Figure 18 Brent Crude Oil Prices (USD Per Barrel)
Figure 19 Value Chain Analysis (2015), Drilling Waste Management: Major Value is Added During the Service Stage
Figure 20 Porter�s Five Forces Analysis: Market
Figure 21 Supply Chain Analysis (2015): Market
Figure 22 Drilling Waste Management Market Share (Value), By Service, 2014
Figure 23 Treatment & Disposal Segment is Projected to Grow at the Highest Rate During the Forecast Period
Figure 24 Europe & North America are Projected to Be the Two Fastest Growing Markets for Treatment & Disposal, 2015�2020
Figure 25 North America Was the Largest Market for Solids Control in 2014
Figure 26 North America & Europe are Projected to Be the Top Two Largest Markets (By Value) for Containment & Handling By 2020
Figure 27 Market Share (Value), By Application, 2014
Figure 28 Offshore Application Segment is Projected to Grow at A Faster Rate Than Onshore Application, 2015�2020
Figure 29 North America and Europe are Projected to Be the Two Largest Markets for Onshore Application, 2015�2020
Figure 30 Africa and Asia-Pacific are Projected to Be the Two Largest Markets for Offshore Application, 2015�2020
Figure 31 Drilling Waste Management Market Share (Value), By Region, 2014
Figure 32 Top Growing Markets: U.K., Norway, and Qatar are Expected to Witness Comparatively Stronger Growth Than the Other Countries During the Forecast Period
Figure 33 North America and Europe are Projected to Be the Largest Markets for Drilling Waste Management, 2015�2020
Figure 34 North America is Expected to Remain the Largest Market for Drilling Waste Management Till 2020
Figure 35 Companies Majorly Adopted the Strategy of Agreements, Partnerships, Collaborations, & Joint Ventures to Grab the Maximum Market Share
Figure 36 Battle for Market Share: Contracts & Agreements Was the Key Strategy Adopted By Major Players From 2010 to 2016
Figure 37 Drilling Waste Management Market Evolution Framework: 2010 to 2015
Figure 38 Drilling Waste Management Market Share (By Value), By Major Players, 2014
Figure 39 Region-Wise Revenue Mix of the Top 5 Market Players
Figure 40 Schlumberger Limited.: Company Snapshot
Figure 41 Schlumberger Limited.: SWOT Analysis
Figure 42 Halliburton Company: Company Snapshot
Figure 43 Halliburton Company: SWOT Analysis
Figure 44 Baker Hughes Incorporated: Company Snapshot
Figure 45 Baker Hughes Incorporated: SWOT Analysis
Figure 46 Weatherford International PLC.: Company Snapshot
Figure 47 Weatherford International PLC: SWOT Analysis
Figure 48 National Oilwell Varco, Inc.: Company Snapshot
Figure 49 National Oilwell Varco, Inc.: SWOT Analysis
Figure 50 Scomi Group BHD: Company Snapshot
Figure 51 Newalta Corporation: Company Snapshot
Figure 52 Nuverra Environmental Solutions: Company Snapshot
Figure 53 Secure Energy Services, Inc.: Company Snapshot
Figure 54 Imdex Limited: Company Snapshot
Figure 55 Augean PLC.: Company Snapshot


Growth opportunities and latent adjacency in Drilling Waste Management Market