Well Completion Equipment and Services Market by Type (Packers, Sand Control Tools, Multistage Fracturing Tools, Liner Hangers, Smart Wells, Valves & Others), by Application (Onshore & Offshore), & by Region - Global Trends and Forecast to 2021


[147 Pages Report] The global well completion equipment and services market is expected to grow from an estimated USD 8.98 Billion in 2016 to USD 11.09 Billion by 2021, at a CAGR of 4.31% from 2016 to 2021. Factors such as refracking of mature oil & gas wells and resuming shale operations are driving the market worldwide.
Objectives of the Study
- To define the key global markets of the well completion equipment & services market
- To analyze the well completion equipment & services market based on type, application, and region
- To strategically analyze micromarkets with respect to individual growth trends, future prospects, and contribution to the overall market
- To analyze major driving factors, restraints, opportunities, burning issues, and winning imperatives in the well completion equipment & services market
- To analyze trends and forecasts of the well completion equipment & services market and its subsegments
- To analyze the major stakeholders in the well completion equipment & services market and provide a detailed competitive landscape for the leading players of the industry
- To analyze the industrial trends in major regions, namely, North America, Asia-Pacific, Europe, South America, Africa, and the Middle East
- To track and analyze competitive developments, such as joint ventures and mergers & acquisitions in the global well completion equipment & services market, and profile the major players of the market
The well completion equipment & services market has been segmented on the basis of type, application, and region. The years considered for the study are as follows:
- Historical Year: 2014
- Base Year: 2015
- Estimated Year: 2016
- Projected Year: 2021
- Forecast Period: From 2016 to 2021
For company profiles in the report, 2015 has been used as the base year. Wherever recent (2015) data was unavailable, the previous year�s (2014) data has been included.
Research Methodology
This research study involved extensive usage of secondary sources, directories, and databases (such as Hoovers, Bloomberg, Businessweek, and Factiva) to identify and collect information useful for this technical, market-oriented, and commercial study of well completion equipment & services. The points mentioned below explain the research methodology applied in making this report.
- Analysis of country-wise rig count and well count for the past 10 years
- Analysis of region-wise capital expenditure in upstream oil & gas sector for the past 3 years
- Analysis of country-wise crude oil and natural gas production for the past 10 years
- Country-wise analysis of investments in onshore and offshore oil & gas fields
- Analysis of market trends of completion equipment & services across regions
- The overall market sizes have been finalized by triangulating the supply-side data, including product developments, supply chain, and global annual sales of well completion equipment & services
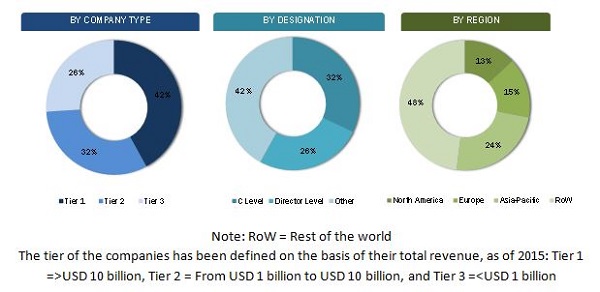
After arriving at the overall market size, the total market has been split into several segments and subsegments. The figure given below shows the breakdown of the primaries on the basis of company type, designation, and region, conducted during the research study.
To know about the assumptions considered for the study, download the pdf brochure
Market Ecosystem
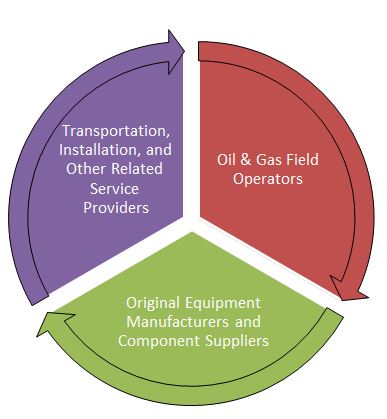
The well completion equipment & services market starts with the manufacturing of equipment such as packers and liner hanger among others. Schlumberger Ltd. (U.S.), Halliburton Company (U.S.), and Baker Hughes, Inc. (U.S.), among others are the leading equipment & service providers. The final stage covers oil & gas field operators. The prominent operators are BP p.l.c. (U.K.), Total S.A. (France), and Royal Dutch Shell plc (The Netherlands), among others.
Stakeholders
The stakeholders included in this report are as follows:
- Oilfield Service Companies
- Exploration and Production Companies
- Completion Tools and Equipment Manufacturers
- Oil & Gas Field Operators
- National Oil Companies (NOCs)
- Government and Industry Associations
- Consulting Companies of the Energy and Power Sector
- Investment Banks
�The study answers several questions for the stakeholders, primarily which market segments to focus in the next 2�5 years for prioritizing efforts and investments.�
Scope of the Report
- By Type
- Packers
- Sand Control Tools
- Multistage Fracturing Tools
- Liner Hangers
- Valves
- Smart Wells
- Others
- By Application
- Onshore
- Offshore
- By Region
- North America
- South America
- Europe
- Africa
- The Middle East
- Asia-Pacific
Available Customizations
With the given market data, MarketsandMarkets offers customizations as per the client�s specific needs. The following customization options are available for the report:
- Detailed analysis and profiling of additional market players (Up to 5)
- Further breakdown of regional markets
Under Paid Customization
- A new segment based on well type (trajectory) for North America
The well completion equipment & services market is projected to grow at a CAGR of 4.31% from 2016 to 2021 to reach USD 11.09 Billion by 2021. Refracking of mature oil & gas wells and resuming shale operations are the major factors driving the market.
The report segments the well completion equipment & services market on the basis of application into onshore and offshore. The offshore application is projected to grow at the fastest pace during the forecast period. The dwindling oil & gas reserves in the onshore fields have forced the operators to venture into offshore regions. This trend is likely to continue in the future as the increase in the production from the deepwater and ultra-deepwater reservoirs will drive the demand for the well completion equipment & services as well.
Based on type, the well completion equipment & services market has been categorized into packers, sand control tools, multistage fracturing tools, liner hangers, valves, smart wells, and others. The packers segment holds the largest market size, and is projected to grow at the highest rate during the forecast period. This is because packers are the most common and most widely used completion equipment. Though it costs less when compared to other equipment, the large number of units used tends to increase its market size in terms of value.
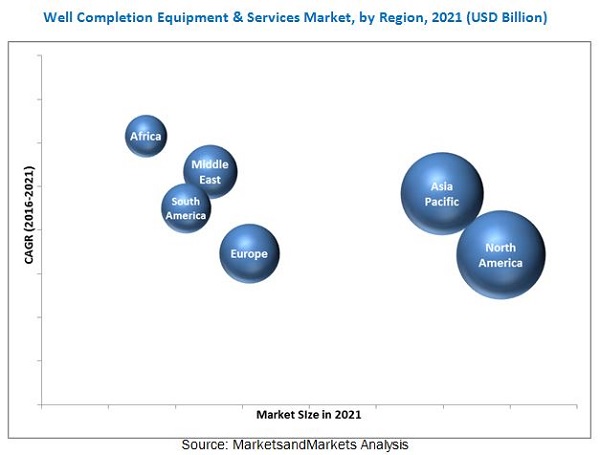
In this report, the well completion equipment & services market has been analyzed with respect to the following regions, namely, North America, South America, Europe, Africa, the Middle East and Asia-Pacific. North America is currently the largest market for well completion equipment & services, followed by Asia-Pacific and Europe. In North America, the growth of the well completion equipment & services market can primarily be attributed to factors such as shale revolution and presence of large drilled but not completed (DUC) wells, particularly in the U.S. The figure given below shows the regional scenario of the well completion equipment & services market from 2016 to 2021.
The demand for well completion equipment & services can be directly linked to the increase in rig count, well count, and upstream oil & gas expenditure. Reduction in exploratory drilling and oil price decline restrains the market growth to a certain extent, with pricing pressure issues being significant challenge of this market. However, arctic explorations offer lucrative growth opportunities for the well completion equipment & services market.
Some of the leading players in the well completion equipment & services market include Schlumberger Ltd. (U.S.), Halliburton Company (U.S.), Baker Hughes, Inc. (U.S.), Weatherford International Plc (Ireland), and National Oilwell Varco, Inc. (U.S.) among others. Mergers & acquisitions was the most common strategy adopted by the top players in the market, constituting almost one-third of the total development share. It was followed by new product launches, contracts & agreements, and expansions, respectively.
To speak to our analyst for a discussion on the above findings, click Speak to Analyst
 Exclusive indicates content/data unique to MarketsandMarkets and not available with any competitors.
Table of Contents
1 Introduction (Page No. - 14)
1.1 Objectives of the Study
1.2 Market Definition
1.3 Study Scope
1.3.1 Markets Covered
1.3.2 Years Considered for the Study
1.4 Currency
1.5 Limitation
1.6 Stakeholders
2 Research Methodology (Page No. - 17)
2.1 Introduction
2.2 Secondary Data
2.2.1 Key Data From Secondary Sources
2.3 Primary Data
2.3.1 Key Data From Primary Sources
2.3.2 Key Industry Insights
2.4 Breakdown of Primaries
2.5 Market Size Estimation
2.5.1 Bottom-Up Approach
2.5.2 Top-Down Approach
2.6 Market Breakdown & Data Triangulation
2.7 Research Assumptions & Limitations
2.7.1 Assumptions
2.7.2 Limitations
3 Executive Summary (Page No. - 25)
3.1 Historical Backdrop, Evolution, & Current Scenario
3.2 Future Outlook
3.3 Conclusion
4 Premium Insights (Page No. - 30)
4.1 Attractive Growth Opportunities in the Well Completion Equipment & Services Market
4.2 By Type
4.3 North America Well Completion Equipment & Services Market, 2016
4.4 Africa is Expected to Grow at the Highest CAGR During the Forecast Period
4.5 Onshore Segment is Expected to Have the Largest Market Share in 2016
5 Market Overview (Page No. - 35)
5.1 Introduction
5.2 Well Completion: Market Segmentation
5.2.1 By Application
5.2.2 By Type
5.2.3 By Region
5.3 Market Dynamics
5.3.1 Drivers
5.3.1.1 Refracking of Mature Oil & Gas Wells
5.3.1.2 Resuming Shale Operations
5.3.2 Restraints
5.3.2.1 Reduction in Exploratory Drilling
5.3.2.2 Crude Price Slump
5.3.3 Opportunities
5.3.3.1 Mergers & Acquisitions Between Oilfield Service Companies
5.3.3.2 Arctic Exploration
5.3.4 Challenges
5.3.4.1 Pricing Pressure
5.4 Supply Chain Analysis
5.4.1 Key Influencers
5.5 Porter�s Five Forces Analysis
5.5.1 Threat of New Entrants
5.5.2 Threat of Substitutes
5.5.3 Bargaining Power of Suppliers
5.5.4 Bargaining Power of Buyers
5.5.5 Intensity of Competitive Rivalry
6 Well Completion Equipment & Services Market, By Type (Page No. - 45)
6.1 Introduction
6.2 Well Completion Equipment & Services Market, By Type
6.3 Packers
6.4 Sand Control Tools
6.5 Multistage Fracturing Tools
6.6 Liner Hangers
6.7 Valves
6.8 Smart Wells
6.9 Others
7 Well Completion Equipment & Services Market, By Application (Page No. - 56)
7.1 Introduction
7.2 Well Completion Equipment & Services Market, By Application
7.3 Onshore
7.4 Offshore
8 Well Completion Equipment & Services Market, By Region (Page No. - 61)
8.1 Introduction
8.2 Regional Analysis of the Well Completion Equipment & Services Market
8.3 North America
8.3.1 U.S.
8.3.2 Canada
8.3.3 Mexico
8.4 South America
8.4.1 Argentina
8.4.2 Venezuela
8.4.3 Brazil
8.4.4 Rest of South America
8.5 Europe
8.5.1 Russia
8.5.2 Norway
8.5.3 U.K.
8.5.4 Turkey
8.5.5 Rest of Europe
8.6 Africa
8.6.1 Angola
8.6.2 Egypt
8.6.3 Nigeria
8.6.4 Libya
8.6.5 Rest of Africa
8.7 Middle East
8.7.1 Oman
8.7.2 Saudi Arabia
8.7.3 UAE
8.7.4 Qatar
8.7.5 Iraq & Kurdistan
8.7.6 Iran
8.7.7 Rest of the Middle East
8.8 Asia-Pacific
8.8.1 China
8.8.2 Australia
8.8.3 Indonesia
8.8.4 India
8.8.5 Malaysia
8.8.6 Thailand
8.8.7 Vietnam
8.8.8 Brunei
8.8.9 Rest of Asia-Pacific
9 Competitive Landscape (Page No. - 95)
9.1 Overview
9.2 Competitive Situation & Trends
9.2.1 Mergers & Acquisitions
9.2.2 New Product Development
9.2.3 Partnerships/Agreements/Collaboration
9.2.4 Expansions
9.2.5 Other Developments
10 Company Profiles (Page No. - 102)
(Company at A Glance, Recent Financials, Products & Services, Strategies & Insights, & Recent Developments)*
10.1 Introduction
10.2 Baker Hughes Inc.
10.3 FTS International
10.4 Halliburton Company
10.5 Nabors Industries Ltd.
10.6 NCS Multistage
10.7 Nine Energy Services
10.8 National Oilwell Varco, Inc.
10.9 Packers Plus Energy Services Inc.
10.10 RPC Incorporated
10.11 Schlumberger Ltd.
10.12 Superior Energy Services
10.13 Trican Well Service Ltd.
10.14 Weatherford International PLC
10.15 Welltec
*Details on Company at A Glance, Recent Financials, Products & Services, Strategies & Insights, & Recent Developments Might Not Be Captured in Case of Unlisted Companies.
11 Appendix (Page No. - 142)
11.1 Insights From Industry Experts
11.2 Discussion Guide
11.3 Knowledge Store: Marketsandmarkets� Subscription Portal
11.4 Introducing RT: Real-Time Market Intelligence
11.5 Available Customizations
11.6 Related Reports
List of Tables (69 Tables)
Table 1 Drilling Permits (Data for March), U.S.
Table 2 Well Completion Equipment and Services Market Size, By Type, 2014�2021 (USD Million)
Table 3 Packers: Well Completion Equipment and Services Market Size, By Region, 2014�2021 (USD Million)
Table 4 Sand Control Tools: Market Size, By Region, 2014�2021 (USD Million)
Table 5 Multistage Fracturing Tools: Market Size, By Region, 2014�2021 (USD Million)
Table 6 Liner Hangers: Market Size, By Region, 2014�2021 (USD Million)
Table 7 Valves: Market Size, By Region, 2014�2021 (USD Million)
Table 8 Smart Wells: Market Size, By Region, 2014�2021 (USD Million)
Table 9 Others: Market Size, By Region, 2014�2021 (USD Million)
Table 10 Well Completion Equipment and Services Market Size, By Application, 2014�2021 (USD Million)
Table 11 Onshore: Well Completion Equipment and Services Market Size, By Region, 2014�2021 (USD Million)
Table 12 Offshore: Well Completion Equipment and Services Market Size, By Region, 2014�2021 (USD Million)
Table 13 Well Completion Equipment & Services Market Size, By Region, 2014�2021 (USD Million)
Table 14 North America: Well Completion Equipment and Services Market Size, By Application, 2014�2021 (USD Million)
Table 15 North America: Market Size, By Type, 2014�2021 (USD Million)
Table 16 North America: Market Size, By Country, 2014�2021 (USD Million)
Table 17 U.S.: Well Completion Equipment & Services Market Size, By Application, 2014�2021 (USD Million)
Table 18 Canada: Market Size, By Application, 2014�2021 (USD Million)
Table 19 Mexico: Well Completion Equipment & Services Market Size, By Application, 2014�2021 (USD Million)
Table 20 South America: Well Completion Equipment & Services Market Size, By Application, 2014�2021 (USD Million)
Table 21 South America: Well Completion Equipment & Services Market Size, By Type, 2014�2021 (USD Million)
Table 22 South America: Market Size, By Country, 2014�2021 (USD Million)
Table 23 Argentina: Well Completion Equipment & Services Market Size, By Application, 2014�2021, (USD Million)
Table 24 Venezuela: Well Completion Equipment & Services Market Size, By Application, 2014�2021 (USD Million)
Table 25 Brazil: Well Completion Equipment & Services Market Size, By Application, 2014�2021 (USD Million)
Table 26 Rest of South America: Well Completion Equipment & Services Market Size, By Application, 2014�2021 (USD Million)
Table 27 Europe: Well Completion Equipment & Services Market Size, By Application, 2014�2021 (USD Million)
Table 28 Europe: Market Size, By Type, 2014�2021 (USD Million)
Table 29 Europe: Services Market Size, By Country, 2014�2021 (USD Million)
Table 30 Russia: Market Size, By Application, 2014�2021 (USD Million)
Table 31 Norway: Well Completion Equipment & Services Market Size, By Application, 2014�2021 (USD Million)
Table 32 U.K.: Well Completion Equipment & Services Market Size, By Application, 2014�2021 (USD Million)
Table 33 Turkey: Well Completion Equipment & Services Market Size, By Application, 2014�2021 (USD Million)
Table 34 Rest of Europe: Well Completions Equipment & Services Market Size, By Application, 2014�2021 (USD Million)
Table 35 Africa: Well Completion Equipment & Services Market Size, By Application, 2014�2021 (USD Million)
Table 36 Africa: Market Size, By Type, 2014�2021 (USD Million)
Table 37 Africa : Market Size, By Country, 2014�2021 (USD Million)
Table 38 Angola: Market Size, By Application, 2014�2021 (USD Million)
Table 39 Egypt: Well Completion Equipment & Services Market Size, By Application, 2014�2021 (USD Million)
Table 40 Nigeria: Well Completion Equipment & Services Market Size, By Application, 2014�2021 (USD Million)
Table 41 Libya: Well Completion Equipment & Services Market Size, By Application, 2014�2021 (USD Million)
Table 42 Rest of Africa: Well Completion Equipment & Services Market Size, By Application, 2014�2021 (USD Million)
Table 43 Middle East: Well Completion Equipment & Services Market Size, By Application, 2014�2021 (USD Million)
Table 44 Middle East: Market Size, By Type, 2014�2021 (USD Million)
Table 45 Middle East : Market Size, By Country, 2014�2021 (USD Million)
Table 46 Oman: Well Completion Equipment and Services Market Size, By Application, 2014�2021 (USD Million)
Table 47 Saudi Arabia: Well Completion Equipment & Services Market Size, By Application, 2014�2021 (USD Million)
Table 48 UAE: Well Completion Equipment & Services Market Size, By Application, 2014�2021 (USD Million)
Table 49 Qatar: Well Completion Equipment & Services Market Size, By Application, 2014�2021 (USD Million)
Table 50 Iraq & Kurdistan: Well Completion Equipment and Services Market Size, By Application, 2014�2021 (USD Million)
Table 51 Iran: Well Completion Equipment and Services Market Size, By Application, 2014�2021 (USD Million)
Table 52 Rest of the Middle East: Well Completion Equipment and Services Market Size, By Application, 2014�2021 (USD Million)
Table 53 Asia-Pacific: Well Completion Equipment and Services Market Size, By Application, 2014�2021 (USD Million)
Table 54 Asia-Pacific: Market Size, By Type, 2014�2021 (USD Million)
Table 55 Asia-Pacific: Market Size, By Country, 2014�2021 (USD Million)
Table 56 China: Well Completion Equipment and Services Market Size, By Application, 2014�2021 (USD Million)
Table 57 Australia: Well Completion Equipment and Services Market Size, By Application, 2014�2021 (USD Million)
Table 58 Indonesia: Well Completion Equipment and Services Market Size, By Application, 2014�2021 (USD Million)
Table 59 India: Well Completion Equipment and Services Market Size, By Application, 2014�2021 (USD Million)
Table 60 Malaysia: Well Completion Equipment and Services Market Size, By Application, 2014�2021 (USD Million)
Table 61 Thailand: Well Completion Equipment and Services Market Size, By Application, 2014�2021 (USD Million)
Table 62 Vietnam: Well Completion Equipment and Services Market Size, By Application, 2014�2021 (USD Million)
Table 63 Brunei: Well Completion Equipment and Services Market Size, By Application, 2014�2021 (USD Million)
Table 64 Rest of Asia-Pacific: Well Completion Equipment and Services, By Application, 2014�2021 (USD Million)
Table 65 Mergers & Acquisitions, 2015�2016
Table 66 New Product Developments & Expansions, 2015�2016
Table 67 Partnerships/Agreements/Collaborations, 2015�2016
Table 68 Expansions, 2012�2016
Table 69 Other Developments, 2013�2014
List of Figures (47 Figures)
Figure 1 Well Completion Equipment and Services Market Segmentation
Figure 2 Market: Research Design
Figure 3 Breakdown of Primary Interviews: By Company Type, Designation, & Region
Figure 4 Market Size Estimation Methodology: Bottom-Up Approach
Figure 5 Market Size Estimation Methodology: Top-Down Approach
Figure 6 Market Estimation Approach & Data Triangulation Methodology
Figure 7 Well Completion Market Share (Value), By Region, 2016�2020
Figure 8 India & Australia are Expected to Witness Higher Growth During the Forecast Period
Figure 9 Packers Segment is Expected to Account for the Maximum Share During the Forecast Period
Figure 10 Onshore Segment is Estimated to Be the Largest Application in 2016 & is Projected to Remain So By 2020
Figure 11 North America: Well Completion Equipment and Services Market Snapshot, 2016�2021
Figure 12 Top Market Developments (2012�2015)
Figure 13 Well Completion Equipment and Services Market Growth Opportunities, 2016�2021
Figure 14 Packers Segment is Expected to Grow at the Highest Rate During the Forecast Period
Figure 15 U.S. is Expected to Be the Largest Market in North America During the Forecast Period
Figure 16 Regional Hot Spots of the Well Completion Equipment and Services Market, From 2016 to 2021
Figure 17 Regional Snapshot: Onshore vs Offshore
Figure 18 Well Completion Market Segmentation: By Application, Type, & Region
Figure 19 Market Dynamics for the Well Completion Equipment and Service Market
Figure 20 Drilling Permits (Data for March), U.S.
Figure 21 Well Completion Equipment and Services Market: Supply Chain
Figure 22 Porter�s Five Forces Analysis: Well Completion Equipment and Services Market
Figure 23 Packers & Sand Control Tools are Expected to Acquire Majority of the Well Completion Equipment and Services Market Share By 2021
Figure 24 Packers Well Completion Equipment and Services Market Size, By Region, 2016�2021, (USD Million)
Figure 25 Onshore Application Segment Dominate the Global Well Completion Equipment and Services Market
Figure 26 North America is Expected to Dominate the Well Completion Equipment and Services Market in the Next 5 Years
Figure 27 Regional Snapshot: Growing Markets are Emerging as New Hotspots
Figure 28 North America: Well Completion Equipment and Services Market Overview, 2014�2021
Figure 29 Asia-Pacific: Well Completion Equipment and Services Market Overview, 2014�2021
Figure 30 Companies Adopted Mergers & Acquisitions as the Key Growth Strategy in the Past 3 Years to Dominate the Market
Figure 31 Market Evolution Framework: Partnerships/Agreements/Collaborations & New Product Developments Fueled Growth From 2011 to 2016
Figure 32 Region-Wise Revenue Mix of Top Five Players
Figure 33 Baker Hughes Inc.: Company Snapshot
Figure 34 Baker Hughes Inc.: SWOT Analysis
Figure 35 Halliburton Company: Company Snapshot
Figure 36 Halliburton Company: SWOT Analysis
Figure 37 Nabors Industries Ltd.: Company Snapshot
Figure 38 National Oilwell Varco, Inc.: Company Snapshot
Figure 39 National Oilwell Varco, Inc.: SWOT Analysis
Figure 40 RPC Incorporated: Company Snapshot
Figure 41 Schlumberger Limited: Company Snapshot
Figure 42 Schlumberger Ltd.: SWOT Analysis
Figure 43 Superior Energy Services: Company Snapshot
Figure 44 Trican Well Service Ltd.: Company Snapshot
Figure 45 Weatherford International PLC: Company Snapshot
Figure 46 Weatherford International PLC: SWOT Analysis
Figure 47 Welltec: Company Snapshot


Growth opportunities and latent adjacency in Well Completion Equipment and Services Market