Water Quality Monitoring Market by Product Type (TOC Analyzers, pH Meters, Dissolved Oxygen Analyzers, Conductivity Sensors, Turbidity Meters), Application (Laboratories, Industrial, Commercial Spaces, Government Buildings), and Region - Global Forecast to 2025


[157 slides Report] The water quality monitoring market is expected to be valued at USD 4.69 Billion by 2025, growing at a CAGR of 4.54% between 2016 and 2025. In this research report, the market has been segmented on the basis of product type, application, and region. The growing awareness of the water quality measurement due to the rising level of water pollution and increasing government funding for pollution monitoring and control are the major factors driving this market. However, high cost of environmental monitoring solutions and technical limitations associated with water monitoring products are the major restraints for this market.
Years Considered for This Report:
2015: Base Year
2016: Estimated Year
2025: Projected Year
2016–2025: Forecast Period
The objective of this report is to define, describe, and forecast the water quality monitoring market on the basis of application, product type, and geography; forecast the market size in terms of value for various segments with regard to four main regions, namely, North America, Europe, APAC, and RoW; provide detailed information regarding the major factors influencing the growth of the market (drivers, restraints, opportunities, and challenges); study the value chain and analyze the impact of Porter’s five forces on the market; and analyze the micromarkets with respect to the individual growth trends, future prospects, and contribution to the total market.
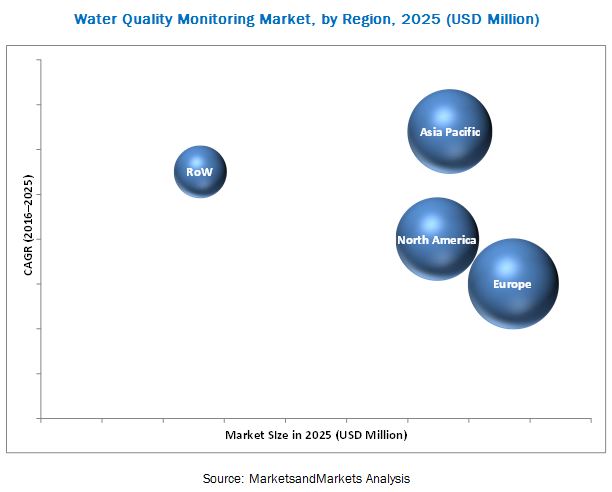
The water quality monitoring market is expected to be worth USD 4.69 Billion by 2025, growing at a CAGR of 4.54% between 2016 and 2025. Some of the key factors driving this market are increasing industrial activities that spur the demand for water monitoring products and increasing government funding for pollution monitoring and control. The key opportunities for this market are the growing popularity of the smart city concept and advancement in technologies for water quality monitoring.
TOC analyzers are expected to hold the largest share of the water quality monitoring market during the forecast period. The industrial applications of water quality monitoring products have increased substantially in the past few decades owing to increasing industrialization and urbanization in developing countries. The rising concerns regarding water contamination and water pollution, coupled with government intervention with strict regulations for water quality, have spurred the growth of the water testing and analysis industry.
Among all the major applications of the water quality monitoring market, the laboratory application is expected to hold the largest share of the market during the forecast period. The market for this application is expected to grow at the highest CAGR during the forecast period owing to increasing water pollution and water contamination as a result of rapid industrialization and growing population.
In terms of geographic regions, Europe held the largest market share in 2016. The water quality monitoring market is expected to grow exponentially in Europe. The water quality monitoring activities are conducted in this region because of the increased awareness about water pollution and contamination.
The market for water testing and analysis instruments is not flourishing due to the lack of awareness about the water quality in the rural areas of developing countries and the high cost of water testing products. These factors lead to the limited penetration of water testing products in nonindustrial sectors.
The key players in the water quality monitoring market are General Electric Company (U.S.), Horiba, Ltd. (Japan), Danaher Corporation (U.S.), Agilent Technologies (U.S.), Xylem, Inc. (U.S.), and Teledyne Technologies, Inc. (U.S.), among others.
To speak to our analyst for a discussion on the above findings, click Speak to Analyst
 Exclusive indicates content/data unique to MarketsandMarkets and not available with any competitors.
Table of Content
1 Introduction
1.1 Objectives of the Study
1.2 Market Definition
1.3 Stakeholders
1.4 Currency
2 Research Methodology
2.1 Research Design
2.1.1 Primary Research Methodology
2.1.1.1 Key Data From Primary Sources
2.2 Key Data From Secondary Sources
2.3 Market Size Estimation
2.3.1 Bottom Up Approach
2.3.2 Top Down Approach
2.4 Market Breakdown & Data Triangulation
2.5 Research Assumption
3 Executive Summary
3.1 Introduction to the Water Quality Monitoring Market
3.2 Current Scenario
3.3 Conclusion
4 Market Overview
4.1 Drivers
4.1.1 Development of Policies and Initiatives to Reduce Environmental Pollution Levels
4.1.2 Increasing Government Funding for Pollution Monitoring and Control
4.1.3 Rising Global Levels of Water Pollution
4.1.4 Growing Industrial Applications Spur the Market for Water Testing & Analysis Instruments
4.2 Restraints
4.2.1 High Cost of Environmental Monitoring Solutions
4.2.2 Technical Limitations Associated With Water Monitoring Products
4.2.3 Limited Market Penetration for Water Testing & Analysis Instruments in Non-Industrial Applications
4.3 Opportunities
4.3.1 Greenfield Opportunity
4.3.2 Brownfield Opportunity
4.4 Challenges
4.4.1 Uncertain and Inconsistent Environmental Regulations and Funding Across Emerging Countries
5 Industry Trends
5.1 Introduction
5.2 Value Chain Analysis
5.3 Supply Chain Analysis
5.4 Porter’s Five Forces Analysis
5.4.1 Threats of New Entrants
5.4.2 Threats of Substitutes
5.4.3 Bargaining Power of Buyers
5.4.4 Bargaining Power of Suppliers
5.4.5 Intensity of Competitive Rivalry
6 Market Outlook, By Product
6.1 Introduction
6.2 Water Quality Monitor Asp Analysis
6.3 Water Quality Monitoring Market, By Product Type
6.3.1 TOC Analyzer
6.3.1.1 Market for TOC Analyzers, By Application
6.3.1.2 Market for TOC Analyzers, By Region
6.3.2 Ph Meters
6.3.2.1 Market for Ph Meters, By Application
6.3.2.2 Market for Ph Meters, By Region
6.3.2.3 Market for Ph Meters in Terms of Value and Volume
6.3.3 Dissolved Oxygen Analyzers
6.3.3.1 Market for Dissolved Oxygen Analyzers, By Application
6.3.3.2 Market for Dissolved Oxygen Analyzers, By Region
6.3.3.3 Market for Dissolved Oxygen Analyzers in Terms of Value and Volume
6.3.4 Conductivity Sensor
6.3.4.1 Water Quality Monitoring Market for Conductivity Sensors, By Application
6.3.4.2 Market for Conductivity Sensors, By Region
6.3.4.3 Market for Conductivity Sensors in Terms of Value and Volume
6.3.5 Turbidity Meter
6.3.5.1 Market for Turbidity Meters, By Application
6.3.5.2 Market for Turbidity Meters, By Region
6.3.5.3 Market for Turbidity Meters in Terms of Value and Volume
6.3.6 Other Product Types
6.3.6.1 Water Quality Monitoring Market for Other Product Types, By Application
6.3.6.2 Market for Other Product Types, By Region
7 Market Outlook, By Application
7.1 Market, By Application
7.2 Laboratory
7.2.1 Market for Laboratories, By Region
7.3 Industrial
7.3.1 Market for Industrial Application, By Region
7.4 Government Building
7.4.1 Market for Government Buildings, By Region
7.5 Commercial Space
7.5.1 Market for Commercial Spaces, By Region
7.6 Other Applications
7.6.1 Water Quality Monitoring Market for Other Applications, By Region
8 Market Outlook, By Region
8.1 Water Quality Monitoring Market, By Region
8.2 North America
8.2.1 Market in North America, By Country
8.3 Europe
8.3.1 Market in Europe, By Region
8.4 Asia–Pacific
8.4.1 Market in APAC, By Region
8.5 Rest of the World (RoW)
8.5.1 Market in RoW, By Region
9 Competitive Landscape
9.1 Introduction
9.2 New Product Launches and Developments
9.3 Agreements, Collaborations, and Partnerships
9.4 Acquisitions and Contracts
9.5 Expansion and Awards
10 Company Profiles
10.1 Thermo Fisher Scientific, Inc.
10.2 Teledyne Technologies Inc.
10.3 General Electric Company
10.4 Horiba, Ltd.
10.5 Xylem Inc.
10.6 Agilent Technologies
10.7 Danaher Corporation
10.8 Libelium
10.9 Geotech Environmental Equipment, Inc.
10.10 Optiqua Technologies PTE Ltd.
List of Tables (47 Tables)
Table 3.1 Global Water Quality Monitoring Market Size, By Product , 2014 -2025 (USD Million)
Table 3.2 Global Market, By Application, 2014 -2025 (USD Million)
Table 3.3 Global Market, By Region, 2015 -2025 (USD Million)
Table 6.1 Global Market, By Product Type , 2014–2025 (USD Million)
Table 6.2 Water Quality Monitor Asp Analysis, 2014–2025
Table 6.3 Market for TOC Analyzers, By Application, 2014–2025 (USD Million)
Table 6.4 Market for TOC Analyzers, By Region, 2014–2025 (USD Million)
Table 6.5 Market for Ph Meters, By Application, 2014–2025 (USD Million)
Table 6.6 Market for Ph Meters, By Region, 2014–2025 (USD Million)
Table 6.7 Market for Ph Meters in Terms of Value and Volume, 2014–2025
Table 6.8 Market for Dissolved Oxygen Analyzers, By Application, 2014–2025 (USD Million)
Table 6.9 Market for Dissolved Oxygen Analyzers, By Region, 2014–2025 (USD Million)
Table 6.10 Market for Dissolved Oxygen Analyzers in Terms of Value and Volume, 2014–2025
Table 6.11 Market for Conductivity Sensors, By Application, 2014–2025 (USD Million)
Table 6.12 Market for Conductivity Sensors, By Region, 2014–2025 (USD Million)
Table 6.13 Market for Conductivity Sensors in Terms of Value and Volume, 2014–2025
Table 6.14 Market for Turbidity Meters, By Application, 2014–2025 (USD Million)
Table 6.15 Market for Turbidity Meters, By Region, 2014–2025 (USD Million)
Table 6.16 Market for Turbidity Meters in Terms of Value and Volume, 2014–2025
Table 6.17 Market for Other Product Types, By Application, 2014–2025 (USD Million)
Table 6.18 Market for Other Product Types, By Region, 2014–2025 (USD Million)
Table 7.1 Global Water Quality Monitoring Market, By Application, 2014 -2025 (USD Million)
Table 7.2 Market for Laboratory Application, By Region, 2014-2025 (USD Million)
Table 7.3 Market for Industrial Application, By Region, 2014-2025 (USD Million)
Table 7.4 Market for Government Building Application, By Region, 2014-2025 (USD Million)
Table 7.5 Market for Commercial Space Application, By Region, 2014-2025 (USD Million)
Table 7.6 Market for Other Applications, By Region, 2014-2025 (USD Million)
Table 8.1 Global Market, By Region, 2014 -2025 (USD Million)
Table 8.2 North America Market, By Country, 2014 -2025 (USD Million)
Table 8.3 Europe Market, By Country, 2014 -2025 (USD Million)
Table 8.4 Asia–Pacific Market, By Country, 2014 -2025 (USD Million)
Table 8.5 RoW Market, By Country, 2014 -2025 (USD Million)
Table 9.1 New Product Launches and Developments
Table 9.2 Agreements, Collaborations, and Partnerships
Table 9.3 Acquisitions and Contracts
Table 9.4 Expansion and Awards
Table 10.1 Thermo Fisher Scientific, Inc.: Recent Developments
Table 10.2 Teledyne Technologies Inc. : Recent Developments
Table 10.3 General Electric Company: Recent Developments
Table 10.4 Horiba, Ltd.: Recent Developments
Table 10.5 Xylem Inc.: Recent Developments
Table 10.6 Agilent Technologies: Recent Developments
Table 10.7 Thermo Fisher Scientific, Inc.: Recent Developments
Table 10.8 Danaher Corporation: Recent Developments
Table 10.9 Libelium: Recent Developments
Table 10.10 Geotech Environmental Equipment, Inc.: Recent Developments
Table 10.11 Optiqua Technologies PTE Ltd.: Recent Developments
List of Figures (42 Figures)
Figure 1.1 Market Covered & Scope of the Study
Figure 2.1 Breakdown of Primary Interviews
Figure 2.2 Water Quality Monitoring
Figure 2.3 Water Quality Monitoring Market
Figure 3.1 Overview of Market , By Product Type
Figure 3.2 Overview of Market With CAGR, By Application
Figure 3.3 Overview of Market With CAGR, By Region
Figure 4.1 Market Dynamics
Figure 4.2 Impact Analysis: Drivers
Figure 4.3 Impact Analysis: Restraints
Figure 4.4 Impact Analysis: Opportunities
Figure 5.1 Water Quality Monitoring Market Value Chain
Figure 5.2 Market Supply Chain
Figure 5.3 Market- Porter’s Five Forces Analysis
Figure 6.1 Water Quality Monitoring Product Types
Figure 6.2 Water Quality Monitoring Overview, By Product Types (USD Million)
Figure 6.3 Water Quality Monitor Asp Analysis, 2014–2025 (USD)
Figure 6.4 Market for PH Meters in Terms of Value and Volume
Figure 6.5 Market for Dissolved Oxygen Analyzers in Terms of Value and Volume
Figure 6.6 Market for Conductivity Sensors in Terms of Value and Volume
Figure 6.7 Market for Turbidity Meters in Terms of Value and Volume
Figure 7.1 Water Quality Monitoring, By Application, (USD Million)
Figure 7.2 Market for Laboratories, By Region (USD Million)
Figure 7.3 Market for Industrial Application, By Region (USD Million)
Figure 7.4 Market for Government Buildings, By Region (USD Million)
Figure 7.5 Market for Commercial Spaces, By Region (USD Million)
Figure 8.1 Water Quality Monitoring, By Region (USD Million)
Figure 8.2 Market in North America, By Country, (USD Million)
Figure 8.3 Market in Europe, By Country (USD Million)
Figure 8.4 Market in APAC, By Country (USD Million)
Figure 8.5 Market in RoW, By Region (USD Million)
Figure 10.1 Thermo Fisher Scientific, Inc.: Company Overview
Figure 10.2 Teledyne Technologies Inc.: Company Overview
Figure 10.3 General Electric Company: Company Overview
Figure 10.4 Horiba, Ltd.: Company Overview
Figure 10.5 Xylem Inc.: Company Overview
Figure 10.6 Agilent Technologies: Company Overview
Figure 10.7 Danaher Corporation: Company Overview
Figure 10.8 Libelium: Company Overview
Figure 10.9 Company Overview
Figure 10.10 Geotech Environmental Equipment, Inc.: Company Overview
Figure 10.11 Optiqua Technologies PTE Ltd. : Company Overview
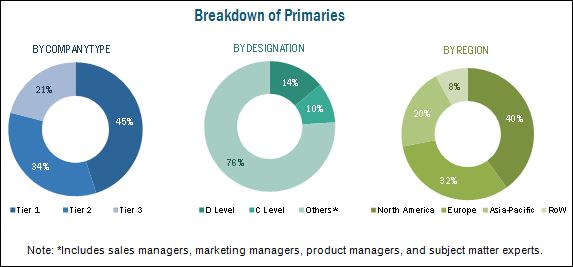
The research methodology used to estimate and forecast this market begins with capturing data on key vendor revenue through secondary sources. The vendor offerings have also been taken into consideration to determine the market segmentation. A combination of top-down and bottom-up procedures has been employed to arrive at the overall size of the water quality monitoring market from the revenues of key players in the market. After arriving at the overall market size, the total market has been split into several segments and subsegments, which have been verified through primary research by conducting extensive interviews with key experts such as CEOs, VPs, directors, and executives. Market breakdown and data triangulation procedures have been employed to complete the overall market engineering process and arrive at the exact statistics for all segments and subsegments. The breakdown of profiles of primaries is depicted in the figure below:
To know about the assumptions considered for the study, download the pdf brochure
This report provides valuable insights regarding the ecosystem of this market such as water quality testing product suppliers and manufacturers, and end consumers. The ecosystem of the market consists of companies such as Xylem, Inc. (U.S.), Optiqua Technologies Pte. Ltd. (Singapore), and Libelium (Spain) that manufacture water quality monitoring products.
Key Target Audience:
- Water quality monitoring software developers
- Water treatment stakeholders
- Environmental protection and monitoring agencies
- Manufacturers and distributors of water quality monitoring products
- Water pollution monitoring committees
- Academic and research institutes
- Pharmaceutical and biotechnology industries
- National and regional water pollution control boards and organizations
- Food & beverages industries
- Pulp & paper industries
- Chemical & petrochemical industries
- Oil & gas and power generation plants
- Wastewater treatment plants
- Water pumping plants
- Government agencies
- Market research and consulting firms
The study answers several questions for the stakeholders, primarily which market segments to focus on in the next two to nine years for prioritizing the efforts and investments.
Report Scope:
In this report, the water quality monitoring market has been segmented as follows:
Water Quality Monitoring Market, by Region:
Water Quality Monitoring Market, by Application:
-
- North America
- Europe
- APAC
- RoW
- Laboratories
- Industrial
- Government Buildings
- Commercial Spaces
- Others (agricultural, household, and general applications)
On the basis of Region, the market has been subsegmented as follows:
Water Quality Monitoring Market, by North America
Water Quality Monitoring Market, by Europe
-
- U.S.
- Canada
- Mexico
- Germany
- U.K.
- France
- Rest of Europe
-
Market, by APAC:
- China
- Japan
- India
- Rest of APAC
-
Market, by RoW:
- Latin America
- Africa
- Others (UAE, Saudi Arabia, Iraq, Syria, and Yemen, among others)
On the basis of Product Type, the water quality monitoring market has been segmented as follows:
- Market, by Product Type:
- TOC Analyzers
- pH Meters
- Dissolved Oxygen Analyzers
- Conductivity sensors
- Turbidity Meters
- Others
Available Customizations:
With the given market data, MarketsandMarkets offers customizations according the company’s specific needs. The following customization options are available for the report:
Company Information
- Detailed analysis and profiling of additional market players (up to five)


Growth opportunities and latent adjacency in Water Quality Monitoring Market
I'm a marketing consultant conducting an assessment for an early stage tech company looking to enter in this market.
I have a client interested in the size and growth of specifically the river water monitoring equipment market. I cannot tell from your TOC whether there are breakouts for sensors and equipment used specifically for monitoring rivers. What can you tell me?
We need sample brochure Water Quality Monitoring Market by Product Type (TOC Analyzers, pH Meters, Dissolved Oxygen Analyzers, Conductivity Sensors, Turbidity Meters), Application (Laboratories, Industrial, Commercial Spaces, Government Buildings), and Region.