Volumetric Display Market by Component (Projector, Motor & Position Sensor), Technology (DLP and LCOS), Display Type (Swept and Static), Application (Medical, Aerospace & Defense and Oil & Gas), Geography - Global Trend & Forecast to 2015 - 2020


Volumetric display is a graphic display device that forms a visual representation of an object in three physical dimensions, as opposed to a planar image on traditional screens that simulate depth through a number of different visual effects. Unique properties of volumetric displays include 360-degree viewing, agreement of converge and accommodation cues, and their inherent 3D format enabling new user interface techniques. A volumetric display device was first developed in 1912; it was under development till the 1980s and commercialized in the 1990s. Consistent R&D activities have resulted in technological advancements and innovation. This technology is now being commercialized in many sectors such as medical, aerospace & defense, automotive and industrial.
Volumetric displays are categorized into swept volumetric display, static volumetric display and multi-planar display. This segmentation has been done on the basis of their functionalities and applications in the market. There are four major components, which are used in volumetric displays- projectors, motor & position sensors, mirrors, and others which include rendering software and rendering electronics. These components are essentially used to develop volumetric displays.
In this market, there are many component manufacturers and system integrators. Major companies present in this market include 3DIcon Corporation (U.S.), LightSpace Technologies Inc. (U.S.), Voxon (U.S.), Holografika Kft. (Hungary), Zebra Imaging (U.S.), and many more.
Key Takeaways:
- The overall volumetric display market is expected to reach $348.2 million by 2020 at a CAGR of 33.28% between 2015 and 2020
- Analysis of the global market with a special focus on high growth applications in various verticals
- The market has been segmented based on component, technology, display type, application, and geography with detailed classification splits by revenue.
- Detailed Porter�s analysis and overview of the market
- Major market trends, drivers, opportunities, restraints, and challenges for the volumetric display market
- Illustrative segmentation, analysis, and forecast of the major geographic markets to provide an overall view of the market
- Projection of volumetric display from technical as well as market oriented perspectives
- Detailed competitive landscape with identification of the key players
A volumetric display device enables generation and scattering of visible radiation from a set of localized and specified regions within a three-dimensional space. In certain cases a volumetric system allows a controlled anisotropic propagation of radiation from each of these regions. It can be used to increase the visibility of a three-dimensional image.
Volumetric display is a 3D autostereoscopic display, which is used in sectors such as medical, aerospace & defense, automotive, and industrial. During the past few years, there has been extensive research for volumetric displays pertaining to entertainment and gaming applications which has led to much technological advancement. The medical sector is a major application area, where it is used in human body scanning, surgery, and training. The application of volumetric displays in the aerospace and defense sector is on a battlefield, for training commanders, and controlling air traffic among others.
This report comprises market trends, drivers, and challenges for the volumetric display market along with the market size projections from 2015 to 2020 on the basis of component, technology, display type, application, and geography. Company profiles consist of the company overview, financial overview, products & services, recent developments, and SWOT analysis for top five companies. Based on the geography, this report covers markets in North America, Europe, APAC, and RoW (Rest of the World).
Some of the major companies present in the market are 3DIcon Corporation (U.S.), LightSpace Technologies Inc. (U.S.), Voxon (U.S.), Holografika Kft. (Hungary), Zebra Imaging (U.S.), Holoxica (U.K.), Burton Inc. (Japan), LEIA Inc. (U.S.), Seekway Technologies (China), Alioscopy (France). and others.
Volumetric Display Market Size, 2014-2020
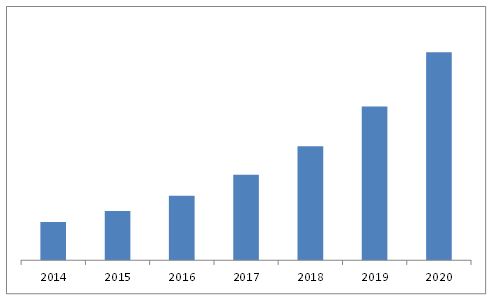
The market size for volumetric displays is expected to reach to $348.17 Million by 2020, at a CAGR of 33.28% between 2015 and 2020. The maximum application of volumetric displays is in medical and aerospace & defense sectors. The application in the medical sector dominated the volumetric display market accounting for the largest share in 2014 followed by aerospace & defense. North America led the overall market in 2014.
 Exclusive indicates content/data unique to MarketsandMarkets and not available with any competitors.
Table of Contents
1 Introduction (Page No. - 13)
1.1 Objectives of the Study
1.2 Market Definition
1.3 Study Scope
1.3.1 Markets Covered
1.3.2 Years Considered for the Study
1.4 Currency
1.5 Limitations
1.6 Stakeholders
2 Research Methodology (Page No. - 17)
2.1.1 Secondary Data
2.1.1.1 Key Data From Secondary Sources
2.1.2 Primary Data
2.1.2.1 Key Data From Primary Sources
2.1.2.2 Key Industry Insights
2.1.2.3 Breakdown of Primaries
2.2 Market Size Estimation
2.2.1 Bottom-Up Approach
2.2.2 Top-Down Approach
2.3 Market Breakdown & Data Triangulation
2.4 Research Assumptions and Limitations
2.4.1 Assumptions
2.4.2 Limitations
3 Executive Summary (Page No. - 26)
4 Premium Insights (Page No. - 31)
4.1 Attractive Opportunities for the Volumetric Display Market
4.2 Market�Major Segments
4.3 Market in the Asia-Pacific Region
4.4 North America is Expected to Emerge as the Fastest Growing Market Between 2015 and 2020
4.5 Market: Application, 2014 to 2020
4.6 Market: Developed vs Developing Nations
4.7 Market: Medical and Aerospace & Defense Sectors (2020)
5 Market Overview (Page No. - 37)
5.1 Introduction
5.2 Market Segmentation
5.2.1 By Component
5.2.2 By Technology
5.2.3 By Display Type
5.2.4 By Industry
5.2.5 By Geography
5.3 Market Dynamics
5.3.1 Drivers
5.3.1.1 Need for Advanced Medical Imaging Devices for Better Treatment Will Drive the Market
5.3.1.2 Technological Advancements in 3d Displays
5.3.2 Restraints
5.3.2.1 Requirement of Advanced Software and Electronic Components
5.3.2.2 The Cost Factor Affecting the Growth of Market
5.3.3 Opportunities
5.3.3.1 Commercialization of the Market
5.3.3.2 Potential Application of Volumetric Displays in Telemedicine and Surgery
5.3.3.3 Advancements in the Volumetric Display Technology for Applications in Consumer Service Sectors
5.3.4 Challenge
5.3.4.1 Lack of Technological Awareness
6 Industry Analysis (Page No. - 45)
6.1 Introduction
6.2 Value Chain Analysis
6.3 Supply Chain Analysis
6.3.1 Key Influencers
6.4 Industry Trends
6.5 Porter�s Five Forces Model
6.5.1 Threat of New Entrants
6.5.2 Threat 0f Substitutes
6.5.3 Bargaining Power of Buyers
6.5.4 Bargaining Power of Suppliers
6.5.5 Competitive Rivalry
6.6 Strategic Benchmarking
6.6.1 Technology Integration & Product Enhancement
7 Volumetric Display Market, By Component (Page No. - 57)
7.1 Introduction
7.2 Projector
7.3 Motor & Position Sensor
7.4 Mirror
7.5 Others
7.5.1 Rendering Software
7.5.2 Rendering Electronics
8 Volumetric Display Market, By Technology (Page No. - 61)
8.1 Introduction
8.2 Digital Light Processing (DLP) Technology
8.3 Liquid Crystal on Silicon (LCOS) Technology
9 Volumetric Display Market, By Display Type (Page No. - 65)
9.1 Introduction
9.2 Swept Volume Display
9.2.1 Oscillating
9.2.2 Rotating
9.3 Static Volume Display
9.4 Multi-Planar Volumetric Display
10 Volumetric Display Market, By Application (Page No. - 72)
10.1 Introduction
10.2 Medical
10.3 Aerospace & Defense
10.4 Automotive
10.5 Oil & Gas
10.6 Other Applications
10.6.1 Education
10.6.2 Entertainment
11 Geographic Analysis (Page No. - 91)
11.1 Introduction
11.2 North America
11.2.1 U.S.
11.2.2 Rest of North America
11.3 Europe
11.3.1 Germany
11.3.2 U.K.
11.3.3 France
11.3.4 Rest of Europe
11.4 APAC
11.4.1 China
11.4.2 Japan
11.4.3 India
11.4.4 South Korea
11.4.5 Rest of Asia-Pacific
11.5 Rest of the World (RoW)
11.5.1 Middle East & Africa
11.5.2 Latin America
12 Competitive Landscape (Page No. - 112)
12.1 Overview
12.2 Major Companies � Market, 2014
12.3 Competitive Situation and Trends
12.4 Battle for the Market Share: New Product Launches, Participating in Promotional Activities & Events, and Partnerships Were the Key Strategies Adopted By Many Players
12.4.1 New Product Launches and Developments
12.4.2 Agreements, Partnerships, Collaborations, and Joint Ventures
12.4.3 Other Developments
13 Company Profiles (Page No. - 118)
(Overview, Products and Services, Financials, Strategy & Development)*
13.1 3dicon Corp.
13.2 Holografika KFT
13.3 Lightspace Technologies.
13.4 Holoxica Limited
13.5 Zebra Imaging
13.6 Voxon
13.7 Burton Inc.
13.8 Jiangmen Seekway Technology Ltd.
13.9 Leia Inc
13.10 Alioscopy
14 Appendix (Page No. - 135)
14.1 Insights of Industry Experts
14.2 Discussion Guide
14.3 Introducing RT: Real Time Market Intelligence
14.4 Available Customizations
14.5 Related Reports
List of Tables (71 Tables)
Table 1 Medical Imaging and Healthcare Applications are Expected to Propel the Growth of the Market
Table 2 High Cost May Obstruct the Growth of the Market
Table 3 The On-Going R&D and Advancements in the Volumetric Display Technology are Expected to Increase Its Applications in the Future
Table 4 Lack of Awareness
Table 5 Some of the Prominent Companies in the Market
Table 6 Market Size , By Component, 2014 � 2020 ($Million)
Table 7 Global Market Size, By Technology, 2014-2020 ($Million)
Table 8 Digital Light Processing (DLP) Technology Market Size, By Display Type, 2014-2020 ($Million)
Table 9 Market Size for Liquid Crystal on Silicon (LCOS) Technology, By Display Type, 2014-2020 ($Million)
Table 10 Market Size , By Display Type, 2014 � 2020 ($Million)
Table 11 Swept Volumetric Display Market Size, By Technology, 2014 � 2020 ($Million)
Table 12 Swept Volumetric Display Market Size , By Application 2014 � 2020 ($Million)
Table 13 Static Volumetric Display Market Size, By Technology, 2014 � 2020 ($Million)
Table 14 Static Volumetric Display Market Size, By Application, 2014 � 2020 ($Million)
Table 15 Multi-Planar Volumetric Display Market Size, By Technology, 2014 � 2020 ($Million)
Table 16 Multi-Planar Volumetric Display Market Size, By Application, 2014� 2020 ($Million)
Table 17 Market Size, By Industry, 2014 � 2020 ($Million)
Table 18 Market in the Medical Sector, By Display Type, 2014 � 2020 ($Million)
Table 19 Market in the Medical Sector, By Geography, 2014 � 2020 ($Million)
Table 20 North America: Market in the Medical Sector, By Country, 2014 � 2020 ($Million)
Table 21 Europe: Market in the Medical Sector, By Country, 2014 � 2020 ($Million)
Table 22 APAC: Market in the Medical Sector, By Country, 2014 � 2020 ($Thousand)
Table 23 RoW: Market in the Medical Sector, By Country, 2014 � 2020 ($Thousand)
Table 24 Global Market in the Aerospace & Defense Sector, By Display Type, 2014 � 2020 ($Million)
Table 25 Global Market in the Aerospace & Defense Sector, By Geography, 2014 � 2020 ($Million)
Table 26 North America: Volumetric Display Market in the Aerospace & Defense Sector, By Country, 2014 � 2020 ($Million)
Table 27 Europe: Volumetric Display Market in the Aerospace & Defense Sector, By Country, 2014 � 2020 ($Million)
Table 28 APAC: Market in the Aerospace & Defense Sector, By Country, 2014 � 2020 ($Thousand)
Table 29 RoW: Volumetric Display Market in the Aerospace & Defense Sector, By Country, 2014 � 2020 ($Thousand)
Table 30 Global Market in the Automotive Sector, By Display Type, 2014 � 2020 ($Million)
Table 31 Global Market in the Automotive Sector, By Geography, 2014 � 2020 ($Million)
Table 32 North America Volumetric Display Market in the Automotive Sector, By Country, 2014 � 2020 ($Million)
Table 33 Europe :Market in the Automotive Sector, By Country, 2014 � 2020 ($Million)
Table 34 APAC Volumetric Display Market in the Automotive Sector, By Country, 2014 � 2020 ($Thousand)
Table 35 RoW Volumetric Display Market in the Automotive Sector, By Country, 2014 � 2020 ($Thousand)
Table 36 Global Market in the Oil & Gasoil & Gas Sector, By Display Type, 2014 � 2020 ($Million)
Table 37 Global Market in the Oil & Gas Sector, By Geography, 2014 � 2020 ($Million)
Table 38 North America: Volumetric Display Market in the Oil & Gas Sector, By Country, 2014 � 2020 ($Million)
Table 39 Europe: Market in the Oil & Gas Sector, By Country, 2014 � 2020 ($Million)
Table 40 APAC: Volumetric Display Market in the Oil & Gas Sector, By Country, 2014 � 2020 ($Thousand)
Table 41 RoW: Market in the Oil & Gas Sector, By Country, 2014 � 2020 ($Thousand)
Table 42 Global Market in the Other Sectors, By Display Type, 2014 � 2020 ($Million)
Table 43 Global Market in the Other Sectors, By Geography, 2014 � 2020 ($Million)
Table 44 North America: Volumetric Display Market in the Other Sectors, By Country, 2014 � 2020 ($Million)
Table 45 Europe: Market in the Other Sectors, By Country, 2014 � 2020 ($Million)
Table 46 APAC: Volumetric Display Market in the Other Sectors, By Country, 2014 � 2020 ($Thousand)
Table 47 RoW: Volumetric Display Market in the Other Sectors, By Country, 2014 � 2020 ($Thousand)
Table 48 North America: Volumetric Display Market Size, By Application, 2014�2020 ($Million)
Table 49 North America: Market Size, By Country, 2014 � 2020 ($Million)
Table 50 U.S.: Market Size, By Application, 2014 � 2020 ($Million)
Table 51 Rest of North America: Market Size, By Application, 2014 � 2020 ($Million)
Table 52 Europe: Market Size, By Application, 2014 � 2020 ($Million)
Table 53 Europe: Market Size, By Country, 2014 � 2020 ($Million)
Table 54 Germany: Market Size, By Application, 2014 � 2020 ($Million)
Table 55 U.K.: Market Size, By Application, 2014 � 2020 ($Million)
Table 56 France: Market Size, By Application, 2014 � 2020 ($Million)
Table 57 Rest of Europe: Market Size, By Application, 2014 � 2020 ($Million)
Table 58 APAC: Volumetric Display Market Size, By Application, 2014 � 2020 ($Million)
Table 59 APAC: Market Size, By Country, 2014 � 2020 ($Million)
Table 60 China: Market Size, By Application, 2014 � 2020 ($Million)
Table 61 Japan: Market Size, By Application, 2014 � 2020 ($Million)
Table 62 India :Market Size, By Application, 2014 � 2020 ($Thousand)
Table 63 South Korea: Market Size, By Application, 2014 � 2020 ($Million)
Table 64 Rest of Asia Pacific: Market Size, By Application, 2014 � 2020 ($Thousand)
Table 65 RoW: Market Size, By Application, 2014 � 2020 ($Thousand)
Table 66 RoW: Market Size, By Country, 2014 � 2020 ($Thousand)
Table 67 Middle East & Africa: Market Size, By Application, 2014 � 2020 ($Thousand)
Table 68 Latin America: Market Size, By Application, 2014 � 2020 ($Thousand)
Table 69 New Product Launches and Developments, 2014
Table 70 Agreements, Partnerships, Collaborations, and Joint Ventures, 2013 - 2014
Table 71 Other Developments, 2014
List of Figures (57 Figures)
Figure 1 Markets Covered
Figure 2 Research Design
Figure 3 Market Size Estimation Methodology: Bottom-Up Approach
Figure 4 Market Size Estimation Methodology: Top-Down Approach
Figure 5 Assumptions of the Research Study
Figure 6 Limitations of the Study
Figure 7 Market, 2014 to 2020
Figure 8 Volumetric Display Component Market Share, 2014
Figure 9 Market, By Technology, 2014 vs 2020
Figure 10 Market, By Application, 2014 vs 2020
Figure 11 The Application in Medical Sector is Expected to Witness the Highest Growth By 2020
Figure 12 Market Share, By Geography in 2014
Figure 13 The Application in the Medical Sector Accounted for A Large Share of the Volumetric Display Market in 2014
Figure 14 The Swept Volume Display Segment is Expected to Grow at the Highest Rate Due to the Increasing Demand in the Medical Sector
Figure 15 Application in the Medical Sector Accounted for the Largest Share in APAC, in 2014
Figure 16 In North America, the U.S. is Expected to Grow at the Highest Rate
Figure 17 The Medical Sector is Expected to Be the Largest for Volumetric Display Applications, From 2014 to 2020
Figure 18 The U.S. is Expected to Be the Largest Market By 2020
Figure 19 The Application of Volumetric Displays in the Medical Sector has A Promising Future in North America
Figure 20 Volumetric Display Market Segmentation: By Component
Figure 21 Market Segmentation: By Technology
Figure 22 Market Segmentation: By Display Type
Figure 23 Market Segmentation: By Industry
Figure 24 Market Segmentation: By Geography
Figure 25 Increased R&D and Application in the Healthcare Industry Likely to Increase the Demand for Volumetric Displays
Figure 26 Value Chain Analysis (2014): Major Value Addition is Done During Manufacturing and Assembling Phases
Figure 27 Supply Chain of Major Players in the Market
Figure 28 Key Trends in the Market
Figure 29 Porter�s Five Forces Analysis
Figure 30 The Porter�s Five Forces Analysis for the Market
Figure 31 Threat of New Entrants
Figure 32 Threat of Substitutes
Figure 33 Bargaining Power of Buyers
Figure 34 Bargaining Power of Suppliers
Figure 35 Competitive Rivalry
Figure 36 Strategic Benchmarking: Organic & Inorganic Growth Strategies for Technology Integration and Product Enhancement
Figure 37 Volumetric Display Market, By Component
Figure 38 Projectors Accounted for the Largest Share of the Volumetric Display Components Market in 2014
Figure 39 Market Segmentation, By Technology
Figure 40 Digital Light Processing Technology Accounted for the Largest Market Size in 2014
Figure 41 Market, By Display Type
Figure 42 Swept Volume Displays Accounted for the Largest Share of the Volumetric Display Market in 2014
Figure 43 Volumetric Display Market Segmentation, By Industry
Figure 44 Market Was Dominated By Applications in the Medical Sector, in 2014
Figure 45 Geographic Growth Snapshot (2015�2020)- U.S., Germany, and China are Emerging as New Hot Spots
Figure 46 Country-Wise Growth of Volumetric Display Applications in Various Sectors Between 2015 and 2020
Figure 47 The North American Market Snapshot: Demand Expected to Be Driven By the Requirement of Advanced Medical Equipment
Figure 48 Europe: Market Snapshot �Germany is Expected to Grow at A High Rate Between 2015 and 2020
Figure 49 Asia-Pacific: Market Snapshot � China is the Most Lucrative Market
Figure 50 Companies Adopted Partnerships and Agreements as Key Growth Strategies During the Last Three Years (2012�2014)
Figure 51 Battle for the Market Share: New Product Launches and Partnerships Were the Key Strategies Adopted By Most Players, 2012�2014
Figure 52 3dicon Corp.: Company Snapshot
Figure 53 3dicon Corp : SWOT Analysis
Figure 54 Holografika KFT: SWOT Analysis
Figure 55 Lightspace Technologies: SWOT Analysis
Figure 56 Zebra Imaging: SWOT Analysis
Figure 57 Voxon: SWOT Analysis


Growth opportunities and latent adjacency in Volumetric Display Market