Volt/VAr Management Market by Application (Distribution, Transmission, and Generation), Component (Hardware and Software and Services), End-User (Electric Utility and Industrial), and Region - Global Forecast to 2024


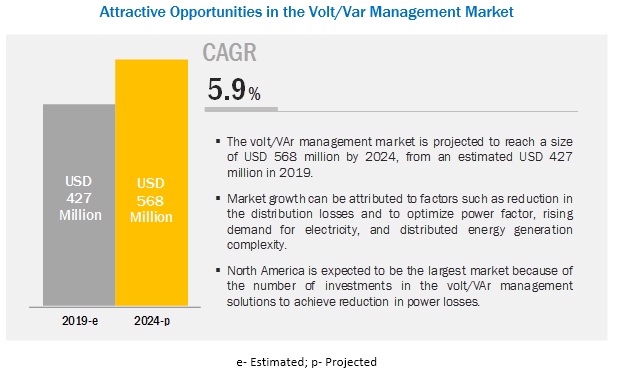
[145 Pages Report] The volt/VAr management market is projected to reach a size of USD 568 million by 2024, at a CAGR of 5.9%, from an estimated USD 427 million in 2019. The need for efficient operations to reduce distribution losses and optimize power factor, distributed energy generation complexity, and rising demand for electricity is driving the market for volt/VAr management across the globe.
By application, the distribution segment is the largest contributor to the volt/VAr management market during the forecast period.
The volt/VAr management market has been segmented based on application into generation, transmission, and distribution. The distribution segment is expected to be the largest due to the increasing number of smart grid projects and rising electricity demand from the residential sector.
Hardware to contribute to the highest revenue generation during the forecast period.
The volt/VAr management market by component is segmented into hardware, and software & services. The hardware segment is estimated to hold the largest share of the market during the forecast period. Upcoming power generation projects in the non-renewable and renewable power segments and transmission & distribution projects in economies such the US, the UK, France, Ireland, Norway, India, and China are expected to boost the demand for hardware components during the forecast period
The electric utility, by end-user, is expected to be the fastest growing market during the forecast period.
The volt/VAr management market by end-user is segmented into electric utility and industrial. The electric utility segment is projected to hold the largest market share by 2024. Increasing investments in distributed power generation for renewable sources such as solar and wind and the implementation of volt/VAr management projects for voltage & power optimization are expected to drive the electric utility segment during the forecast period.
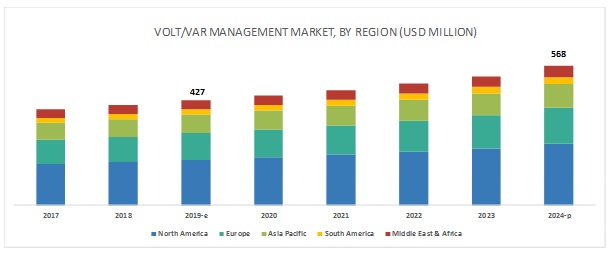
North America is expected to account for the largest market size during the forecast period.
In this report, the volt/VAr management market has been analyzed for five regions, namely, North America, Europe, South America, Asia Pacific, and the Middle East & Africa. North America is the largest market for volt/VAr management, followed by Europe. Reducing power losses would lead to an increase in investments in volt/VAr management. This would also boost the demand for volt/VAr management in North America. The US and Canada are expected to grow at a fast pace during the forecast period
The volt/VAr management market is dominated by a few major players that have an extensive regional presence. The leading players in the market are ABB (Switzerland), Eaton (Ireland), GE (US), Schneider (France), Siemens (Germany), Landis+Gyr (Switzerland), DVI (US), Open Systems International (US), Utilidata (US), and Varentec (US).
Scope of the Report
|
Report Metric |
Details |
|
Market size available for years |
2017�2024 |
|
Base year considered |
2018 |
|
Forecast period |
2019�2024 |
|
Forecast units |
Value (USD) |
|
Segments covered |
Application, component, end-user, and region |
|
Geographies covered |
Asia Pacific, Europe, North America, South America, Middle East & Africa |
|
Companies covered |
ABB (Switzerland), Eaton (Ireland), GE (US), Schneider (France), Siemens (Germany), Landis+Gyr (Switzerland), Advanced Control Systems (US), DVI (US), Open Systems International (US), Utilidata (US), Varentec (US), Beckwith Electric (US), DC Systems (US), S&C Electric Company (US) |
This research report categorizes the volt/VAr management market based on application, components, end-user, and region
Based on application, the volt/VAr management market has been segmented as follows:
- Generation
- Transmission
- Distribution
Based on the components, the volt/VAr management market has been segmented as follows:
- Hardware
- Software & services
Based on end-user, the volt/VAr management market has been segmented as follows:
- Electric utility
- Industrial
Based on the region, the volt/VAr management market has been segmented as follows:
- North America
- Europe
- Asia Pacific
- Middle East & Africa
- South America
Recent Developments
- In February 2019, Schneider Electric launched the Ecostruxure Power 2.0. The latest EcoStruxure Power architecture uses EcoStruxure Microgrid Operation to manage the Distributed Energy Resources (DER) and the protection systems for increased microgrid stability and efficiency.
- In June 2019, State Grid Corporation of China (SGCC) awarded a power transmission contract to ABB. The company will deploy high-voltage equipment such as breakers, which protect the grid from disruptive faults, and capacitor banks which is expected to improve the quality of the electricity supply, thus increasing the product lifespan and reducing losses.
Key Questions addressed by the report
- The report identifies and addresses key markets for volt/VAr management, which would help various stakeholders such as energy utility companies, government & research organizations, institutional investors, transmissions, distribution, and generation companies, vendors for volt/VAr hardware components, volt/VAr hardware manufacturing companies, and volt/VAr software development companies
- The report helps system providers understand the pulse of the market and provides insights into drivers, restraints, opportunities, and challenges.
- The report will help key players understand the strategies of their competitors better and make better strategic decisions.
- The report addresses the market share analysis of key players in the market, and with the help of this, companies can enhance their revenues in the respective market.
- The report provides insights about emerging geographies for market, and hence, the entire market ecosystem can gain a competitive advantage from such insights.
To speak to our analyst for a discussion on the above findings, click Speak to Analyst
 Exclusive indicates content/data unique to MarketsandMarkets and not available with any competitors.
Table of Contents
1 Introduction (Page No. - 17)
1.1 Objectives of the Study
1.2 Definition
1.3 Market Scope
1.3.1 Market Segmentation
1.3.2 Regional Scope
1.4 Years Considered for the Study
1.5 Currency
1.6 Limitation
1.7 Stakeholders
2 Research Methodology (Page No. - 21)
2.1 Scope
2.2 Market Size Estimation
2.2.1 Demand-Side Analysis
2.2.1.1 Assumptions
2.2.2 Supply-Side Analysis
2.2.2.1 Assumptions
2.2.2.2 Calculation
2.2.3 Forecast
2.3 Some of the Insights of Industry Experts
3 Executive Summary (Page No. - 25)
4 Premium Insights (Page No. - 29)
4.1 Attractive Opportunities in the Volt/Var Management Market During the Forecast Period
4.2 Market, By Region
4.3 Market, By Application
4.4 Market, By Component
4.5 Market, By End-User
5 Market Overview (Page No. - 32)
5.1 Introduction
5.2 Market Dynamics
5.2.1 Drivers
5.2.1.1 Rising Need to Reduce T&D Losses
5.2.1.2 Growing Investment in Distributed Generation & Increasing in Renewable Power Generation
5.2.1.3 Increasing Demand for Reliable and Secure Power Network Worldwide
5.2.1.4 Optimizing Power Factor and Low Operational Cost
5.2.2 Restraints
5.2.2.1 High Initial Cost of Installation
5.2.3 Opportunities
5.2.3.1 Modernization of Aging Power Infrastructure
5.2.4 Challenges
5.2.4.1 Low Acceptance Level of the Deployment of Volt/Var Management in Developing Countries
6 Market, By Component (Page No. - 38)
6.1 Introduction
6.2 Hardware
6.2.1 Increasing Number of Distribution Management Projects is Expected to Drive the Market
6.2.1.1 Load Tap Changer (LTC) Transformers
6.2.1.2 Voltage Regulators
6.2.1.3 Capacitor Banks
6.3 Software & Services
6.3.1 Rising Demand for Tracking Real Time Data Creates Demand for Software & Services Market
7 Market, By Application (Page No. - 42)
7.1 Introduction
7.2 Generation
7.2.1 Rising Demand for Efficient and Long- Lasting Power Infrastructure
7.3 Transmission
7.3.1 Need to Reduce Voltage Stability Problems and Optimize Power Factor Foster the Market
7.4 Distribution
7.4.1 Need to Reduce Distribution Losses is Expected to Drive the Market
8 Market, By End-User (Page No. - 47)
8.1 Introduction
8.2 Electric Utility
8.2.1 Increase in Energy Consumption and Reduction in Operational Cost are Expected to Drive the Market
8.3 Industrial
8.3.1 Need to Minimize Var Losses and Improve Power Efficiency is Expected to Boost the Market
9 Market, By Region (Page No. - 51)
9.1 Introduction
9.2 North America
9.2.1 By Application
9.2.2 By Component
9.2.3 By End-User
9.2.4 By Country
9.2.4.1 US
9.2.4.1.1 Investments in T&D Infrastructure and Grid Modernization is Likely to Drive the Market
9.2.4.2 Canada
9.2.4.2.1 Increase in the Renewable Power Generation in Canada is Likely to Drive the Market
9.2.4.3 Mexico
9.2.4.3.1 Reforms to Develop Low Carbon Power Generation and Development of Smart Grids are Expected to Drive the Market
9.3 Europe
9.3.1 By Application
9.3.2 By Component
9.3.3 By End-User
9.3.4 By Country
9.3.4.1 UK
9.3.4.1.1 Investments in T&D Network, Distribution Automation, Renewables are Expected to Drive the Market
9.3.4.2 Germany
9.3.4.2.1 Increasing Investments in the Automation of T&D Lines to Reduce T&D Losses are Likely to Drive the Demand for the Market
9.3.4.3 France
9.3.4.3.1 High Penetration of the Renewable Power Generation is Expected to Drive the Market
9.3.4.4 Russia
9.3.4.4.1 Modernization of Grids is Likely to Drive the Market
9.3.4.5 Italy
9.3.4.5.1 Investments in Advanced Control and Monitoring Systems are Expected to Boost the Demand for the Market
9.3.4.6 Spain
9.3.4.6.1 Power Generation Using Renewable Energy is Expected to Boost the Demand for the Volt/Var Management Market
9.3.4.7 Rest of Europe
9.4 Asia Pacific
9.4.1 By Application
9.4.2 By Component
9.4.3 By End-User
9.4.4 By Country
9.4.4.1 China
9.4.4.1.1 Government Initiatives to Reduce T&D Losses and Investment in Upgradation of the Aging Electrical Grid is Expected to Drive the Market
9.4.4.2 India
9.4.4.2.1 Increasing Investments in Smart Grid is Likely to Drive the Indian Market
9.4.4.3 Japan
9.4.4.3.1 Rising Investments in Electric Vehicles are Expected to Drive the Market
9.4.4.4 South Korea
9.4.4.4.1 Increasing Focus on Renewable Energy Generation and Reducing Carbon Footprint is A Major Driver for the Volt/Var Management Market
9.4.4.5 Indonesia
9.4.4.5.1 Rising Investment in Infrastructure is Expected to Drive the Market
9.4.4.6 Australia
9.4.4.6.1 Increasing Investment Renewables and Smart Grids is Expected to Drive the Market
9.4.4.7 Rest of Asia Pacific
9.5 South America
9.5.1 By Application
9.5.2 By Component
9.5.3 By End-User
9.5.4 By Country
9.5.4.1 Brazil
9.5.4.1.1 Government Regulation for Energy Efficiency and Increasing T&D Investments are Likely to Drive the Market
9.5.4.2 Argentina
9.5.4.2.1 Need for Technological Modernization in Power Generation is Expected to Boost the Demand for the Volt/Var Management Market
9.5.4.3 Rest of South America
9.6 Middle East & Africa
9.6.1 By Application
9.6.2 By Component
9.6.3 By End-User
9.6.4 By Country
9.6.4.1 South Africa
9.6.4.1.1 Focus on the Distribution Network to Tackle the Growing Electricity Demand is Expected to Foster the Demand for the South African Market
9.6.4.2 Nigeria
9.6.4.2.1 Growing Power Generation Capacity and Increasing Investment Opportunities in Transmission Network are Likely to Increase the Demand for the Market
9.6.4.3 Saudi Arabia
9.6.4.3.1 Growing Power Generation Capacity With Increasing Investments in the T&D Network is Expected to Drive the Market
9.6.4.4 UAE
9.6.4.4.1 Growing Investments in Smart Grid and T&D Infrastructure is Likely to Increase the Demand for Market in UAE
9.6.4.5 Kuwait
9.6.4.5.1 Growing Investments in Power Distribution Grid Connection are Expected to Drive the Market
9.6.4.6 Rest of Middle East & Africa
10 Competitive Landscape (Page No. - 105)
10.1 Introduction
10.2 Market Share Analysis
10.3 Competitive Scenario
10.3.1 New Product Launches
10.3.2 Contracts & Agreements
10.3.3 Partnerships
10.4 Competitive Leadership Mapping
10.4.1 Visionary Leaders
10.4.2 Innovators
10.4.3 Dynamic
10.4.4 Emerging
11 Company Profile (Page No. - 111)
(Business Overview, Products Offered, Recent Developments, MnM View)*
11.1 ABB
11.2 Eaton
11.3 GE
11.4 Schneider
11.5 Siemens
11.6 Landis+Gyr
11.7 Advanced Control Systems
11.8 DVI
11.9 Open Systems International
11.10 Utilidata
11.11 Varentec
11.12 Beckwith Electric
11.13 DC Systems
11.14 S&C Electric Company
*Details on Business Overview, Products Offered, Recent Developments, MnM View Might Not Be Captured in Case of Unlisted Companies.
12 Appendix (Page No. - 138)
12.1 Insights of Industry Experts
12.2 Discussion Guide
12.3 Knowledge Store: Marketsandmarkets� Subscription Portal
12.4 Available Customizations
12.5 Related Reports
12.6 Author Details
List of Tables (112 Tables)
Table 1 Investments in T&D and Distribution Automation are the Determining Factors for the Global Volt/Var Management Market
Table 2 Volt/Var Management Market Snapshot
Table 3 Volt/Var Management Market Size, By Component, 2017�2024 (USD Million)
Table 4 Hardware: Market Size, By Region, 2017�2024 (USD Million)
Table 5 Software & Services: Market Size, By Region, 2017�2024 (USD Thousand)
Table 6 Volt/Var Management Market Size, By Application, 2017�2024 (USD Million)
Table 7 Generation: Market Size, By Region, 2017�2024 (USD Thousand)
Table 8 Transmission: Market Size, By Region, 2017�2024 (USD Thousand)
Table 9 Distribution: Market Size, By Region, 2017�2024 (USD Thousand)
Table 10 Volt/Var Management Market Size, By End-User, 2017�2024 (USD Million)
Table 11 Electric Utility: Market Size, By Region, 2017�2024 (USD Million)
Table 12 Industrial: Market Size, By Region, 2017�2024 (USD Thousand)
Table 13 Volt/Var Management Market Size, By Region, 2017�2024 (USD Million)
Table 14 North America: Market Size, By Application, 2017�2024 (USD Million)
Table 15 North America: Market Size, By Component, 2017�2024 (USD Million)
Table 16 North America: Market Size, By End-User, 2017�2024 (USD Million)
Table 17 North America: Market Size, By Country, 2017�2024 (USD Million)
Table 18 US: Market Size, By Application, 2017�2024 (USD Thousand)
Table 19 US: Market Size, By Component, 2017�2024 (USD Million)
Table 20 US: Market Size, By End-User, 2017�2024 (USD Million)
Table 21 Canada: Market Size, By Application, 2017�2024 (USD Thousand)
Table 22 Canada: Market Size, By Component, 2017�2024 (USD Million)
Table 23 Canada: Market Size, By End-User, 2017�2024 (USD Million)
Table 24 Mexico: Market Size, By Application, 2017�2024 (USD Thousand)
Table 25 Mexico: Market Size, By Component, 2017�2024 (USD Thousand)
Table 26 Mexico: Market Size, By End-User, 2017�2024 (USD Thousand)
Table 27 Europe: Market Size, By Application, 2017�2024 (USD Million)
Table 28 Europe: Market Size, By Component, 2017�2024 (USD Million)
Table 29 Europe: Market Size, By End-User, 2017�2024 (USD Million)
Table 30 Europe: Market Size, By Country, 2017�2024 (USD Million)
Table 31 UK: Market Size, By Application, 2017�2024 (USD Thousand)
Table 32 UK: Market Size, By Component, 2017�2024 (USD Thousand)
Table 33 UK: Market Size, By End-User, 2017�2024 (USD Thousand)
Table 34 Germany: Market Size, By Application, 2017�2024 (USD Thousand)
Table 35 Germany: Market Size, By Component, 2017�2024 (USD Thousand)
Table 36 Germany: Market Size, By End-User, 2017�2024 (USD Thousand)
Table 37 France: Market Size, By Application, 2017�2024 (USD Thousand)
Table 38 France: Market Size, By Component, 2017�2024 (USD Thousand)
Table 39 France: Market Size, By End-User, 2017�2024 (USD Thousand)
Table 40 Russia: Market Size, By Application, 2017�2024 (USD Thousand)
Table 41 Russia: Market Size, By Component, 2017�2024 (USD Thousand)
Table 42 Russia: Market Size, By End-User, 2017�2024 (USD Thousand)
Table 43 Italy: Market Size, By Application, 2017�2024 (USD Thousand)
Table 44 Italy: Market Size, By Component, 2017�2024 (USD Thousand)
Table 45 Italy: Market Size, By End-User, 2017�2024 (USD Thousand)
Table 46 Spain: Market Size, By Application, 2017�2024 (USD Thousand)
Table 47 Spain: Market Size, By Component, 2017�2024 (USD Thousand)
Table 48 Spain: Market Size, By End-User, 2017�2024 (USD Thousand)
Table 49 Rest of Europe: Market Size, By Application, 2017�2024 (USD Thousand)
Table 50 Rest of Europe: Market Size, By Component, 2017�2024 (USD Thousand)
Table 51 Rest of Europe: Market Size, By End-User, 2017�2024 (USD Thousand)
Table 52 Asia Pacific: Market Size, By Application, 2017�2024 (USD Thousand)
Table 53 Asia Pacific: Market Size, By Component, 2017�2024 (USD Thousand)
Table 54 Asia Pacific: Market Size, By End-User, 2017�2024 (USD Thousand)
Table 55 Asia Pacific: Market Size, By Country, 2017�2024 (USD Thousand)
Table 56 China: Market Size, By Application, 2017�2024 (USD Thousand)
Table 57 China: Market Size, By Component, 2017�2024 (USD Thousand)
Table 58 China: Market Size, By End-User, 2017�2024 (USD Thousand)
Table 59 India: Market Size, By Application, 2017�2024 (USD Thousand)
Table 60 India: Market Size, By Component, 2017�2024 (USD Thousand)
Table 61 India: Market Size, By End-User, 2017�2024 (USD Thousand)
Table 62 Japan: Market Size, By Application, 2017�2024 (USD Thousand)
Table 63 Japan: Market Size, By Component, 2017�2024 (USD Thousand)
Table 64 Japan: Market Size, By End-User, 2017�2024 (USD Thousand)
Table 65 South Korea: Market Size, By Application, 2017�2024 (USD Thousand)
Table 66 South Korea: Market Size, By Component, 2017�2024 (USD Thousand)
Table 67 South Korea: Market Size, By End-User, 2017�2024 (USD Thousand)
Table 68 Indonesia: Market Size, By Application, 2017�2024 (USD Thousand)
Table 69 Indonesia: Market Size, By Component, 2017�2024 (USD Thousand)
Table 70 Indonesia: Market Size, By End-User, 2017�2024 (USD Thousand)
Table 71 Australia: Market Size, By Application, 2017�2024 (USD Thousand)
Table 72 Australia: Market Size, By Component, 2017�2024 (USD Thousand)
Table 73 Australia: Market Size, By End-User, 2017�2024 (USD Thousand)
Table 74 Rest of Asia Pacific: Market Size, By Application, 2017�2024 (USD Thousand)
Table 75 Rest of Asia Pacific: Market Size, By Component, 2017�2024 (USD Thousand)
Table 76 Rest of Asia Pacific: Market Size, By End-User, 2017�2024 (USD Thousand)
Table 77 South America: Market Size, By Application, 2017�2024 (USD Thousand)
Table 78 South America: Market Size, By Component, 2017�2024 (USD Thousand)
Table 79 South America: Market Size, By End-User, 2017�2024 (USD Thousand)
Table 80 South America: Market Size, By Country, 2017�2024 (USD Million)
Table 81 Brazil: Market Size, By Application, 2017�2024 (USD Thousand)
Table 82 Brazil: Market Size, By Component, 2017�2024 (USD Thousand)
Table 83 Brazil: Market Size, By End-User, 2017�2024 (USD Thousand)
Table 84 Argentina: Market Size, By Application, 2017�2024 (USD Thousand)
Table 85 Argentina: Market Size, By Component, 2017�2024 (USD Thousand)
Table 86 Argentina: Market Size, By End-User, 2017�2024 (USD Thousand)
Table 87 Rest of South America: Market Size, By Application, 2017�2024 (USD Thousand)
Table 88 Rest of South America: Market Size, By Component, 2017�2024 (USD Thousand)
Table 89 Rest of South America: Market Size, By End-User, 2017�2024 (USD Thousand)
Table 90 Middle East & Africa: Market Size, By Application, 2017�2024 (USD Million)
Table 91 Middle East & Africa: Market Size, By Component, 2017�2024 (USD Thousand)
Table 92 Middle East & Africa: Market Size, By End-User, 2017�2024 (USD Million)
Table 93 Middle East & Africa: Market Size, By Country, 2017�2024 (USD Thousand)
Table 94 South Africa: Market Size, By Application, 2017�2024 (USD Thousand)
Table 95 South Africa: Market Size, By Component, 2017�2024 (USD Thousand)
Table 96 South Africa: Market Size, By End-User, 2017�2024 (USD Thousand)
Table 97 Nigeria: Market Size, By Application, 2017�2024 (USD Thousand)
Table 98 Nigeria: Market Size, By Component, 2017�2024 (USD Thousand)
Table 99 Nigeria: Market Size, By End-User, 2017�2024 (USD Thousand)
Table 100 Saudi Arabia: Market Size, By Application, 2017�2024 (USD Thousand)
Table 101 Saudi Arabia: Market Size, By Component, 2017�2024 (USD Thousand)
Table 102 Saudi Arabia: Market Size, By End-User, 2017�2024 (USD Thousand)
Table 103 UAE: Market Size, By Application, 2017�2024 (USD Thousand)
Table 104 UAE: Market Size, By Component, 2017�2024 (USD Thousand)
Table 105 UAE: Market Size, By End-User, 2017�2024 (USD Thousand)
Table 106 Kuwait: Market Size, By Application, 2017�2024 (USD Thousand)
Table 107 Kuwait: Market Size, By Component, 2017�2024 (USD Thousand)
Table 108 Kuwait: Market Size, By End-User, 2017�2024 (USD Thousand)
Table 109 Rest of Middle East & Africa: Market Size, By Application, 2017�2024 (USD Thousand)
Table 110 Rest of Middle East & Africa: Market Size, By Component, 2017�2024 (USD Thousand)
Table 111 Rest of Middle East & Africa: Market Size, By End-User, 2017�2024 (USD Thousand)
Table 112 Developments By Key Players in the Market, January 2016�April 2019
List of Figures (28 Figures)
Figure 1 Distribution Segment is Expected to Lead the Volt/Var Management Market, By Application, During the Forecast Period
Figure 2 Hardware Segment is Expected to Lead the Market, By Component, During the Forecast Period
Figure 3 Electric Utility Segment is Expected to Lead the Market, By End-User, During the Forecast Period
Figure 4 North America is Expected to Dominate the Market in Terms of Cagr During the Forecast Period
Figure 5 Reduction in Distribution Losses, Rising Demand for Electricity, and Optimizing Power Factor are Driving the Market, 2019�2024
Figure 6 The Market in North America is Expected to Grow at the Highest Cagr During the Forecast Period
Figure 7 Distribution Segment Dominated the Market, By Application, in 2018
Figure 8 Hardware Segment Dominated the Market, By Component, in 2018
Figure 9 Electric Utility Segment Dominated the Market, By End-User, in 2018
Figure 10 Volt/Var Management Market: Drivers, Restraints, Opportunities, and Challenges
Figure 11 Capital Cost of Distribution Generation Technologies, 2015�2040
Figure 12 Renewable Energy Generation (Twh)
Figure 13 Hardware Segment Accounted for the Largest Market Share in 2018
Figure 14 Distribution Segment Accounted for the Largest Market Share in 2018
Figure 15 Electric Utility Segment Accounted for the Largest Market Share in 2018
Figure 16 Regional Snapshot: North American Market is Expected to Grow at the Highest Cagr During the Forecast Period
Figure 17 Volt/Var Management Market Share (Value), By Region, 2018
Figure 18 North America: Regional Snapshot
Figure 19 Europe: Regional Snapshot
Figure 20 Key Developments in the Market During January 2016�June 2019
Figure 21 Market Share Analysis, 2018
Figure 22 Volt/Var Management Market (Global) Competitive Leadership Mapping, 2018
Figure 23 ABB: Company Snapshot
Figure 24 Eaton: Company Snapshot
Figure 25 GE: Company Snapshot
Figure 26 Schneider: Company Snapshot
Figure 27 Siemens: Company Snapshot
Figure 28 Landis+Gyr: Company Snapshot
This study involves major activities in estimating the current size of the volt/VAr management market. Exhaustive secondary research was done to collect information on the market, the peer market, and the parent market. The next step was to validate these findings, assumptions, and market sizing with industry experts across the value chain through primary research. Both top-down and bottom-up approaches were used to estimate the total market size. After that, the market breakdown and data triangulation were done to estimate the market size of the segments and sub-segments.
Secondary Research
This research study involved the use of extensive secondary sources, directories, and databases, such as Hoover�s, Bloomberg BusinessWeek, Factiva, and OneSource, to identify and collect information useful for a technical, market-oriented, and commercial study of the volt/VAr management market. The other secondary sources included annual reports, press releases & investor presentations of companies, white papers, certified publications, articles by recognized authors, manufacturer associations, trade directories, and databases.
Primary Research
The volt/VAr management market comprises several stakeholders such as energy utility companies, government & research organizations, institutional investors, investors/shareholders, transmission, distribution, & generation companies, vendors of volt/VAr hardware components, volt/VAr hardware manufacturing companies, volt/VAr software development companies.
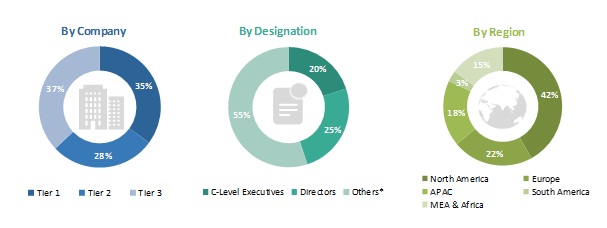
The demand side of this market is characterized by its end-user such as electric utility, industrial (cement, steel, metallurgy, and others). Various primary sources from both the supply and demand sides of the market were interviewed to obtain qualitative and quantitative information. The breakdown of the primary respondents is as follows:
To know about the assumptions considered for the study, download the pdf brochure
Market Size Estimation
Both top-down and bottom-up approaches have been used to estimate and validate the size of the volt/VAr management market and its dependent submarkets. These methods were also used extensively to estimate the size of various subsegments in the market. The research methodology used to estimate the market size includes the following:
- The key players in the industry and market have been identified through extensive secondary research, and their market share in the respective regions have been determined through both primary and secondary research.
- The industry�s supply chain and market size, in terms of value, has been determined through primary and secondary research processes.
- All percentage shares, splits, and breakdowns have been determined using secondary sources and verified through primary sources.
Data Triangulation
After arriving at the overall market size-using the market size estimation processes as explained above-the market was split into several segments and sub-segments. To complete the overall market engineering process and arrive at the exact statistics of each market segment and sub-segment, the data triangulation, and market breakdown procedures were employed, wherever applicable. The data was triangulated by studying various factors and trends from both, the demand and supply sides, in the oil & gas, power generation, water & wastewater, chemicals, food & beverage, pharmaceuticals, and paper & pulp industries.
Report Objectives
- To define, describe, and forecast the volt/VAr management market by application, component, end-user, and region
- To provide detailed information on the major factors influencing the growth of the volt/VAr management market (drivers, restraints, opportunities, and industry-specific challenges)
- To strategically analyze the volt/VAr management market with respect to individual growth trends, prospects, and contribution of each segment to the market
- To analyze the market opportunities for stakeholders and details of the competitive landscape for market leaders
- To forecast the growth of the volt/VAr management market with respect to the regions (Asia Pacific, Europe, North America, South America, and the Middle East & Africa )
- To strategically profile key players and comprehensively analyze their market rankings and core competencies
- To track and analyze the competitive developments such as contracts & agreements, expansions, new product developments, mergers & acquisitions, and partnerships in the volt/VAr management market.
Available Customizations:
With the given market data, MarketsandMarkets offers customizations as per the client�s specific needs. The following customization options are available for this report:
Regional Analysis
- Further breakdown of the region or country-specific analysis
Company Information
- Detailed analysis and profiling of additional market players (up to 5)


Growth opportunities and latent adjacency in Volt/VAr Management Market