Unified Endpoint Management Market by Type (Solutions and Services), Organization Size (Large Enterprises and SMEs), Vertical (BFSI, Telecommunication & IT, Consumer Goods & Retail, Healthcare, Manufacturing), and Region - Global Forecast to 2022


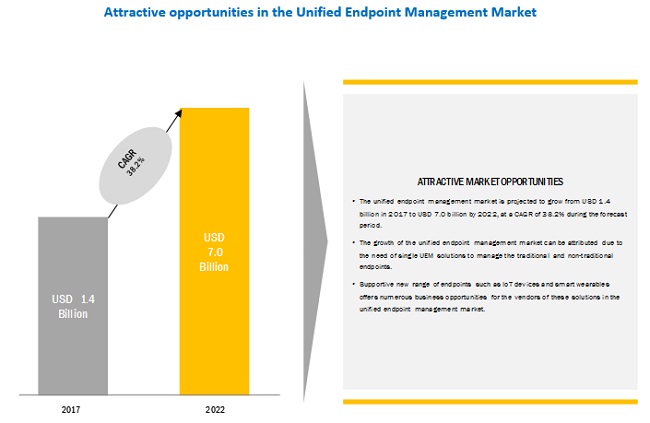
[129 Pages Report] MarketsandMarkets forecasts the unified endpoint management market to grow from USD 1.4 billion in 2017 to USD 7.0 billion by 2022, at a Compound Annual Growth Rate (CAGR) of 38.2% during the forecast period. The unified endpoint management Market has witnessed substantial growth, owing to increased importance of data security in enterprises and need for a single UEM solution to manage traditional and non-traditional endpoints.
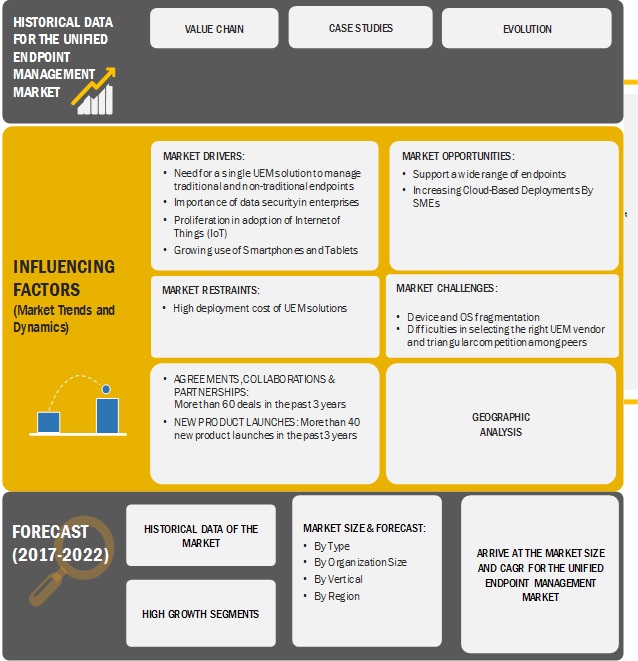
Market Dynamics
Need for a single UEM solution to manage traditional and non-traditional endpoints
Enterprises need to manage both, traditional and non-traditional endpoints. Traditional endpoints include PCs, laptops, smartphones, and tablets, whereas, non-traditional endpoints include ATMs, kiosks, smart vending machines, POS devices, smart wearables, and IoT devices. The management of several endpoints becomes a critical challenge for IT departments. The rising trend of Bring Your Own Device (BYOD) in workplaces has propelled organizations to access, manage, and safeguard critical data accessed by employees through mobile devices. Presently, more than 60% of the enterprise workforce uses a minimum of two computing devices, such as smartphones, tablets, and laptops. The IT department of organizations needs to support multiple operating environments, configurations, applications, and services, which might serve to be a challenging task. Several enterprises are focused on the adoption of different point solutions such as Mobile Device Management (MDM), endpoint protection, and access management to manage, monitor, and secure all endpoints in organizations. The implementation of UEM solution helps reduce the cost of ownership of separate endpoints and endpoint management tools. Thus, organizations are demanding a single unified endpoint management solution that is capable of managing, securing, and controlling all endpoints in an efficient manner.
Unified Endpoint Management Market: Research Design
Based on type, the services segment of the unified endpoint management market is expected to grow at a higher CAGR during the forecast period.
Based on type, the services segment of the unified endpoint management market is projected to grow at a higher CAGR as compared to the solutions segment during the forecast period. The need for appropriate training & support services, post the deployment of UEM solutions to ensure the effective management of endpoints, is projected to drive the growth of the services segment. The UEM services encompass deployment of UEM solutions, guidance provided to IT workforce regarding effective implementation of UEM solutions, and remote and on-premises support offered to companies. Managed UEM services help organizations reduce security risks and enhance the protection of business data.
Based on organization size, the Small & Medium-sized Enterprises (SMEs) segment of the unified endpoint management market is expected to grow at a higher CAGR during the forecast period.
Based on organization size, the Small & Medium-sized Enterprises (SMEs) segment of the unified endpoint management market is projected to grow at a higher CAGR as compared to the large enterprises segment during the forecast period. This growth can be attributed to the increasing adoption of UEM solutions by SMEs to reduce operational cost and enhance enterprise security.
Based on vertical, the BFSI segment is estimated to lead the unified endpoint management market in 2017.
Based on vertical, the BFSI segment is estimated to lead the unified endpoint management market in 2017. BFSI companies are incorporating technologies, such as mobile banking, and enabling payments via smartphones to provide enhanced services to customers. The rising trend of Bring Your Own Device (BYOD) in the BFSI sector has contributed to the increased adoption of unified endpoint management solutions. Several companies in the BFSI sector are increasingly focused on enhancing workplace mobility, thereby improving employee productivity and satisfaction. For instance, ABANCA, one of the largest banks based in Galicia (Spain) required a flexible, extensible platform that enables its IT department to manage Corporate-Owned Personally-Enabled (COPE) devices. The company needed solutions that were compatible with Samsung Knox, which is an enterprise mobile security solution pre-installed in most smartphones, tablets, and wearables developed by Samsung. The company selected BlackBerry UEM solutions that provide comprehensive device, application, and content management with integrated security and connectivity. BlackBerry UEM allowed ABANCA to securely manage and ensure data security for various devices.
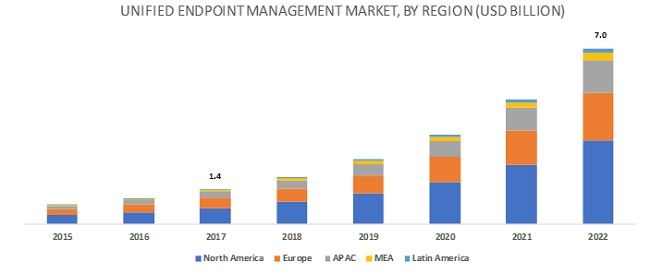
North America is estimated to lead the unified endpoint management market in 2017.
North America is estimated to lead the unified endpoint management market in 2017. The growth of the unified endpoint management market in North America is primarily driven by the presence of key players, such as IBM (US), Microsoft (US), Citrix Systems (US), VMware (US), BlackBerry (Canada), and MobileIron (US) in this region. The need to safeguard data stored in the cloud and transferred over networks is projected to drive the growth of the unified endpoint management market in North America.
Key Market Players
VMware (US), Microsoft (US), IBM (US), MobileIron (US), BlackBerry (Canada), Citrix Systems (US), Ivanti (US), Sophos (UK), SOTI (Canada), Jamf (US), Symantec (US), CA Technologies (US), Cisco Systems (US), and Zoho (US).
VMware (US), a key player in the unified endpoint management market, has adopted both, organic and inorganic growth strategies to strengthen its foothold in the unified endpoint management market. VMware launched VMware Workspace ONE powered by AirWatch. Workspace ONE is a single solution that unifies the management of endpoints and enhances end user experience across all endpoint platforms, including Windows, macOS, Chrome OS, iOS, and Android.
Scope of the Report
|
Report Metrics |
Details |
|
Market size available for years |
2015-2022 |
|
Base year considered |
2016 |
|
Forecast period |
2017-2022 |
|
Forecast units |
Billion (USD) |
|
Segments covered |
Type (Solutions, Services), Organization Size (Large Enterprises, SMEs), Vertical and Region |
|
Geographies covered |
North America, Europe, APAC, MEA, and Latin America |
|
Companies covered |
VMware (US), Microsoft (US), IBM (US), MobileIron (US), BlackBerry (Canada), Citrix Systems (US), Ivanti (US), Sophos (UK), SOTI, (Canada), Jamf (US), Symantec (US), CA Technologies (US), Cisco Systems (US), and Zoho (US). |
The research report categorizes the unified endpoint management market to forecast the revenues and analyze trends in each of the following subsegments:
By Type
- Solutions
- Services
By Organization Size
- Large Enterprises
- SMEs
By Vertical
- Banking, Financial Services & Insurance (BFSI)
- Telecommunication & IT
- Consumer Goods & Retail
- Government & Defense
- Healthcare
- Manufacturing
- Transportation & Logistics
- Automotive
- Others (Education and Energy & Utility)
By Region
- North America
- Europe
- Asia Pacific
- Middle East & Africa
- Latin America
Recent Developments
- In October 2017, IBM enhanced features of its Unified Endpoint Management (UEM) offering. These new features include OS Patch Management for Windows and Mac, App Updates Management for Windows and Mac, and Real-time OS Patch and App Updates Management. The updated features will enable administrators to manage Windows and Mac laptops and desktops in an efficient and streamlined manner.
- In August 2017, VMware launched VMware Workspace ONE powered by AirWatch. Workspace ONE is a single solution that unifies the management of endpoints and enhances end user experience across all endpoint platforms, including Windows, macOS, Chrome OS, iOS, and Android.
- In August 2017, VMware partnered with Google to enable unified endpoint management of all Chrome OS devices in enterprises. This partnership accelerated the adoption of Chromebooks by enhancing existing application accessibility of devices through VMware Workspace ONE.
- In September 2017, Microsoft introduced new features in Microsoft Intune to expand its Unified Endpoint Management (UEM) capabilities. These features include conditional access enhancements across all platforms, integration with Jamf for macOS device compliance, and a new co-management capability with System Center Configuration Manager (ConfigMgr) for modern Windows 10 management.
- In September 2017, MobileIron enhanced its cloud security solution, MobileIron Access, by adding new features that include Access Risk Discovery, MobileIron Access for Mac and PC, and MobileIron Access Authentication Analytics.
Critical questions the report answers:
- Where will all these developments take the industry in the long term?
- What are the upcoming trends for the unified endpoint management market?
- Which segment provides the most opportunity for growth?
- Who are the leading vendors operating in this market?
- What are the opportunities for new market entrants?
To speak to our analyst for a discussion on the above findings, click Speak to Analyst
 Exclusive indicates content/data unique to MarketsandMarkets and not available with any competitors.
Table of Contents
1 Introduction
1.1 Objective of Report
1.2 Market Definition
1.3 Market Scope
1.3.1 Markets Covered
1.3.2 Years Considered in the Report
1.4 Currency
1.5 Limitations
1.6 Stakeholders
2 Research Methodology
2.1 Research Data
2.1.1 Secondary Data
2.1.1.1 Key Data From Secondary Sources
2.1.2 Primary Data
2.1.2.1 Key Data From Primary Sources
2.1.2.2 Key Industry Insights
2.1.2.3 Breakdown of Primary Interviews
2.2 Market Size Estimation
2.2.1 Bottom-Up Approach
2.2.2 Top-Down Approach
2.3 Market Breakdown and Data Triangulation
2.4 Research Assumption and Limitation
2.4.1 Assumptions
2.4.2 Limitations
3 Executive Summary
4 Premium Insights
4.1 Attractive Opportunities in the Unified Endpoint Management Market
4.2 Top 3 Verticals in the North America Market
4.3 Asia Pacific Market By Organization Size
4.4 Unified Endpoint Management Market, By Region
5 Market Overview and Industry Trends
5.1 Introduction
5.2 Market Dynamics
5.2.1 Drivers
5.2.2 Restraints
5.2.3 Opportunities
5.2.4 Challenges
5.3 Case Studies
6 Unified Endpoint Management Market, By Type
6.1 Introduction
6.2 Solutions
6.2.1. Market Estimates and Forecasts, 2015 - 2022 (USD Million)
6.2.2. Market Estimates and Forecasts, By Region, 2015 - 2022 (USD Million)
6.3 Services
6.3.1. Market Estimates and Forecasts, 2015 - 2022 (USD Billion)
6.3.2. Market Estimates and Forecasts, By Region, 2015 - 2022 (USD Billion)
7 Unified Endpoint Management Market, By Organization Size
7.1 Introduction
7.2 Large Enterprises
7.2.1. Market Estimates and Forecasts, 2015 - 2022 (USD Million)
7.2.2. Market Estimates and Forecasts, By Region, 2015 - 2022 (USD Million)
7.3 Small & Medium-Sized Enterprises (SMES)
7.3.1. Market Estimates and Forecasts, 2015 - 2022 (USD Million)
7.3.2. Market Estimates and Forecasts, By Region, 2015 - 2022 (USD Million)
8 Digital Transformation Market, By Vertical
8.1 Introduction
8.2 BFSI
8.2.1. Market Estimates and Forecasts, 2015 - 2022 (USD Million)
8.2.2. Market Estimates and Forecasts, By Region, 2015 - 2022 (USD Million)
8.3 Telecommunication & It
8.3.1. Market Estimates and Forecasts, 2015 - 2022 (USD Million)
8.3.2. Market Estimates and Forecasts, By Region, 2015 - 2022 (USD Million)
8.4 Consumer Goods & Retail
8.4.1. Market Estimates and Forecasts, 2015 - 2022 (USD Million)
8.4.2. Market Estimates and Forecasts, By Region2015 - 2022 (USD Million)
8.5 Government & Defense
8.5.1. Market Estimates and Forecasts, 2015 - 2022 (USD Million)
8.5.2. Market Estimates and Forecasts, By Region, 2015 - 2022 (USD Million)
8.6 Healthcare
8.6.1. Market Estimates and Forecasts, 2015 - 2022 (USD Million)
8.6.2. Market Estimates and Forecasts, By Region, 2015 - 2022 (USD Million)
8.7 Manufacturing
8.7.1. Market Estimates and Forecasts, 2015 - 2022 (USD Million)
8.7.2. Market Estimates and Forecasts, By Region, 2015 - 2022 (USD Million)
8.8 Transportation & Logistics
8.8.1. Market Estimates and Forecasts, 2015 - 2022 (USD Million)
8.8.2. Market Estimates and Forecasts, By Region, 2015 - 2022 (USD Million)
8.9 Automotive
8.9.1. Market Estimates and Forecasts, 2015 - 2022 (USD Million)
8.9.2. Market Estimates and Forecasts, By Region, 2015 - 2022 (USD Million)
8.10 Others
8.10.1. Market Estimates and Forecasts, 2015 - 2022 (USD Million)
8.10.2. Market Estimates and Forecasts, By Region, 2015 - 2022 (USD Million)
9 Adjacent Market Overview
9.1 Mobile UC&C Market Analysis, By Solution
9.1.1 Conferencing Market
9.1.1.1 Market Estimates and Forecasts, 2013-2019 (USD Million)
9.1.2.2 Market Estimates and Forecasts, By Region, 2013-2019 (USD Million)
9.1.2 Unified Messaging Market
9.1.2. 1 Market Estimates and Forecasts, 2013-2019 (USD Million)
9.1.2. 2 Market Estimates and Forecasts, By Region, 2013-2019 (USD Million)
9.1.3 Voice Solution Market
9.1.3.1 Market Estimates and Forecasts, 2013-2019 (USD Million)
9.1.3. 2 Market Estimates and Forecasts, By Region, 2013-2019 (USD Million)
9.1.4 Content and Collaboration Market
9.1.4.1 Market Estimates and Forecasts, 2013-2019 (USD Million)
9.1.4. 2 Market Estimates and Forecasts, By Region, 2013-2019 (USD Million)
9.2 Mobile UC&C Market Analysis, By Service
9.2.1 Implementation and Integration Market
9.2.1.1 Market Estimates and Forecasts, 2013-2019 (USD Million)
9.2.1.2 Market Estimates and Forecasts, By Region, 2013-2019 (USD Million)
9.2.2 Training and Support Market
9.2.2.1 Market Estimates and Forecasts, 2013-2019 (USD Million)
9.2.2.2 Market Estimates and Forecasts, By Region, 2013-2019 (USD Million)
9.2.3 Consulting Market
9.2.3.1 Market Estimates and Forecasts, 2013-2019 (USD Million)
9.2.3.2 Market Estimates and Forecasts, By Region, 2013-2019 (USD Million)
9.2.4 Managed Services Market
9.2.4.1 Market Estimates and Forecasts, 2013-2019 (USD Million)
9.2.4.2 Market Estimates and Forecasts, By Region, 2013-2019 (USD Million)
9.3 Mobile UC&C Market Analysis, By Deployment
9.3.1 Cloud Market
9.3.1.1 Market Estimates and Forecasts, 2013-2019 (USD Million)
9.3.1.2 Market Estimates and Forecasts, By Region, 2013-2019 (USD Million)
9.3.2 On-Premises Market
9.3.2. 1 Market Estimates and Forecasts, 2013-2019 (USD Million)
9.3.2.2 Market Estimates and Forecasts, By Region, 2013-2019 (USD Million)
9.4 Mobile UC&C Market Analysis, By User
9.4.1 Smb Market
9.4.1.1 Market Estimates and Forecasts, 2013-2019 (USD Million)
9.4.1.2 Market Estimates and Forecasts, By Region, 2013-2019 (USD Million)
9.4.2 Enterprise Market
9.4.2.1 Market Estimates and Forecasts, 2013-2019 (USD Million)
9.4.2.2 Market Estimates and Forecasts, By Region, 2013-2019 (USD Million)
9.5 Mobile UC&C Market Analysis, By Industry Vertical
9.5.1 BFSI
9.5.1.1 Market Estimates and Forecasts, 2013-2019 (USD Million)
9.5.1.2 Market Estimates and Forecasts, By Region, 2013-2019 (USD Million)
9.5.2 Healthcare
9.5.2.1 Market Estimates and Forecasts, 2013-2019 (USD Million)
9.5.2.2 Market Estimates and Forecasts, By Region, 2013-2019 (USD Million)
9.5.3 Public Sector
9.5.3.1 Market Estimates and Forecasts, 2013-2019 (USD Million)
9.5.3.2 Market Estimates and Forecasts, By Region, 2013-2019 (USD Million)
9.5.4 Telecom and IT
9.5.4.1 Market Estimates and Forecasts, 2013-2019 (USD Million)
9. 5.4.2 Market Estimates and Forecasts, By Region, 2013-2019 (USD Million)
9.5.5 Retail
9.5.5.1 Market Estimates and Forecasts, 2013-2019 (USD Million)
9.5.5.2 Market Estimates and Forecasts, By Region, 2013-2019 (USD Million)
9.5.6 Media and Entertainment
9.5.6.1 Market Estimates and Forecasts, 2013-2019 (USD Million)
9.5.6.2 Market Estimates and Forecasts, By Region, 2013-2019 (USD Million)
9.5.7 Transportation and Logistics
9.5.7.1 Market Estimates and Forecasts, 2013-2019 (USD Million)
9.5.7.2 Market Estimates and Forecasts, By Region, 2013-2019 (USD Million)
9.5.8 Others
9.5.8.1 Market Estimates and Forecasts, 2013-2019 (USD Million)
9.5.8.2 Market Estimates and Forecasts, By Region, 2013-2019 (USD Million)
10 Unified Endpoint Management Market, By Region
10.1 Introduction
10.2 North America
10.2.1. Market Estimates and Forecasts By Type, 2015�2022 (USD Million)
10.2.2. Market Estimates and Forecasts By Organization Size, 2015�2022 (USD Million)
10.2.3. Market Estimates and Forecasts By Vertical, 2015 - 2022 (USD Million)
10.2.4. Market Estimates and Forecasts, for BFSI, By Organization Size, 2015-2022 (USD Million)
10.2.5. Market Estimates and Forecasts, for Telecommunication & It, By Organization Size, 2015-2022 (USD Million)
10.2.6. Market Estimates and Forecasts, for Consumer Goods & Retail, By Organization Size, 2015-2022 (USD Million)
10.2.7. Market Estimates and Forecasts, for Government & Defense, By Organization Size, 2015-2022 (USD Million)
10.2.8. Market Estimates and Forecasts, for Healthcare, By Organization Size, 2015-2022 (USD Million)
10.2.9. Market Estimates and Forecasts, for Manufacturing, By Organization Size, 2015-2022 (USD Million)
10.3 Europe
10.3.1. Market Estimates and Forecasts By Type, 2015�2022 (USD Million)
10.3.2. Market Estimates and Forecasts By Organization Size, 2015�2022 (USD Million)
10.3.3. Market Estimates and Forecasts By Vertical, 2015 - 2022 (USD Million)
10.3.4. Market Estimates and Forecasts, for BFSI, By Organization Size, 2015-2022 (USD Million)
10.3.5. Market Estimates and Forecasts, for Telecommunication & It, By Organization Size, 2015-2022 (USD Million)
10.3.6. Market Estimates and Forecasts, for Consumer Goods & Retail, By Organization Size, 2015-2022 (USD Million)
10.3.7. Market Estimates and Forecasts, for Government & Defense, By Organization Size, 2015-2022 (USD Million)
10.3.8. Market Estimates and Forecasts, for Healthcare, By Organization Size, 2015-2022 (USD Million)
10.3.9. Market Estimates and Forecasts, for Manufacturing, By Organization Size, 2015-2022 (USD Million)
10.4 Asia Pacific
10.4.1. Market Estimates and Forecasts By Type, 2015�2022 (USD Million)
10.4.2. Market Estimates and Forecasts By Organization Size, 2015�2022 (USD Million)
10.4.3. Market Estimates and Forecasts By Vertical, 2015 - 2022 (USD Million)
10.4.4. Market Estimates and Forecasts, for BFSI, By Organization Size, 2015-2022 (USD Million)
10.4.5. Market Estimates and Forecasts, for Telecommunication & It, By Organization Size, 2015-2022 (USD Million)
10.4.6. Market Estimates and Forecasts, for Consumer Goods & Retail, By Organization Size, 2015-2022 (USD Million)
10.4.7. Market Estimates and Forecasts, for Government & Defense, By Organization Size, 2015-2022 (USD Million)
10.4.8. Market Estimates and Forecasts, for Healthcare, By Organization Size, 2015-2022 (USD Million)
10.4.9. Market Estimates and Forecasts, for Manufacturing, By Organization Size, 2015-2022 (USD Million)
10.5 Middle East and Africa
10.5.1. Market Estimates and Forecasts By Type, 2015�2022 (USD Million)
10.5.2. Market Estimates and Forecasts By Organization Size, 2015�2022 (USD Million)
10.5.3. Market Estimates and Forecasts By Vertical, 2015 - 2022 (USD Million)
10.5.4. Market Estimates and Forecasts, for BFSI, By Organization Size, 2015-2022 (USD Million)
10.5.5. Market Estimates and Forecasts, for Telecommunication & It, By Organization Size, 2015-2022 (USD Million)
10.5.6. Market Estimates and Forecasts, for Consumer Goods & Retail, By Organization Size, 2015-2022 (USD Million)
10.5.7. Market Estimates and Forecasts, for Government & Defense, By Organization Size, 2015-2022 (USD Million)
10.5.8. Market Estimates and Forecasts, for Healthcare, By Organization Size, 2015-2022 (USD Million)
10.5.9. Market Estimates and Forecasts, for Manufacturing, By Organization Size, 2015-2022 (USD Million)
10.6 Latin America
10.6.1. Market Estimates and Forecasts By Type, 2015�2022 (USD Million)
10.6.2. Market Estimates and Forecasts By Organization Size, 2015�2022 (USD Million)
10.6.3. Market Estimates and Forecasts By Vertical, 2015 - 2022 (USD Million)
10.6.4. Market Estimates and Forecasts, for BFSI, By Organization Size, 2015-2022 (USD Million)
10.6.5. Market Estimates and Forecasts, for Telecommunication & It, By Organization Size, 2015-2022 (USD Million)
10.6.6. Market Estimates and Forecasts, for Consumer Goods & Retail, By Organization Size, 2015-2022 (USD Million)
10.6.7. Market Estimates and Forecasts, for Government & Defense, By Organization Size, 2015-2022 (USD Million)
10.6.8. Market Estimates and Forecasts, for Healthcare, By Organization Size, 2015-2022 (USD Million)
10.6.9. Market Estimates and Forecasts, for Manufacturing, By Organization Size, 2015-2022 (USD Million)
11 Competitive Landscape
11.1 Competitive Leadership Mapping
11.1.1 Visionary Leaders
11.1.2 Innovators
11.1.3 Dynamic Differentiators
11.1.4 Emerging Companies
11.2 Strength of Product Portfolio
11.3 Business Strategy Excellence
11.4 Market Ranking for the Digital Transformation Market, 2018
12 Company Profile
12.1 Overview
12.2 VMware
12.2.1. Business Overview
12.2.2. Company Snapshot
12.2.3. Financial Overview
(Operating Income & R&D Expenditure, Business & Geographical Revenue Mix)
12.2.4. Products Offered
12.2.5. Recent Development
12.2.5.1. New Product Launched/Product Updates
12.2.5.2. Merger & Acquisition/Joint Venture/ Partnership
12.2.6. SWOT Analysis
12.2.7. MnM View
12.3 Microsoft
12.3.1. Business Overview
12.3.2. Company Snapshot
12.3.3. Financial Overview
(Operating Income & R&D Expenditure, Business & Geographical Revenue Mix)
12.3.4. Products Offered
12.3.5. Recent Development
12.3.5.1. New Product Launched/Product Updates
12.3.5.2. Merger & Acquisition/Joint Venture/ Partnership
12.3.6. SWOT Analysis
12.3.7. MnM View
12.4 IBM
12.4.1. Business Overview
12.4.2. Company Snapshot
12.4.3. Financial Overview
(Operating Income & R&D Expenditure, Business & Geographical Revenue Mix)
12.4.4. Products Offered
12.4.5. Recent Development
12.4.5.1. New Product Launched/Product Updates
12.4.5.2. Merger & Acquisition/Joint Venture/ Partnership
12.4.6. SWOT Analysis
12.4.7. MnM View
12.5 Mobileiron
12.5.1. Business Overview
12.5.2. Company Snapshot
12.5.3. Financial Overview
(Operating Income & R&D Expenditure, Business & Geographical Revenue Mix)
12.5.4. Products Offered
12.5.5. Recent Development
12.5.5.1. New Product Launched/Product Updates
12.5.5.2. Merger & Acquisition/Joint Venture/ Partnership
12.5.6. SWOT Analysis
12.5.7. MnM View
12.6 Blackberry
12.7 Citrix Systems
12.8 Ivanti
12.9 Sophos
12.10 Soti
12.11 Jamf
12.12 Symantec
12.13 Zoho Corporation
12.14 Cisco Systems
12.15 CA Technologies
*Financials Would be Provided on a Best Efforts Basis for Private Companies
13 Appendix
13.1 Insights of Industry Experts
13.2 Discussion Guide
13.2 Available Customizations
13.3 Related Reports
List of Tables (90 Tables)
Table 1 Unified Endpoint Management Market Size, By Type, 2015-2022 (USD Million)
Table 2 Solutions: Market Size By Region, 2015-2022 (USD Million)
Table 3 Services: Market Size By Region, 2015�2022 (USD Million)
Table 4 Market Size By Organization Size, 2015-2022 (USD Million)
Table 5 Large Enterprises: Market Size By Region, 2015-2022 (USD Million)
Table 6 Small & Medium-Sized Enterprises (SMES): Market Size By Region, 2015-2022 (USD Million)
Table 7 Unified Endpoint Management Market Size, By Vertical, 2015-2022 (USD Million)
Table 8 BFSI: Market Size By Region, 2015-2022 (USD Million)
Table 9 Telecommunication & IT: Market Size By Region, 2015-2022 (USD Million)
Table 10 Consumer Goods & Retail: Market Size By Region, 2015-2022 (USD Million)
Table 11 Government & Defense: Market Size By Region, 2015-2022 (USD Million)
Table 12 Healthcare: Market Size, By Region, 2015-2022 (USD Million)
Table 13 Manufacturing: Market Size By Region, 2015-2022 (USD Million)
Table 14 Transportation & Logistics: Market Size By Region, 2015-2022 (USD Million)
Table 15 Automotive: Market Size By Region, 2015-2022 (USD Million)
Table 16 Other Verticals: Market Size By Region, 2015-2022 (USD Million)
Table 17 Conferencing Market Size, By Region,2012-2019 ($Million)
Table 18 Unified Messaging Market Size, By Region, 2012-2019 ($Million)
Table 19 Voice Solution Market Size, By Region,2012-2019 ($Million)
Table 20 Content and Collaboration Market Size, By Region, 2012-2019 ($Million)
Table 21 Implementation and Integration Market Size, By Region, 2012-2019 ($Million)
Table 22 Training and Support Market Size, By Region, 2012-2019 ($Million)
Table 23 Consulting Market Growth, By Region, By Region, 2012-2019 ($Million)
Table 24 Managed Services Market Size, By Region, 2012-2019 ($Million)
Table 25 Cloud Market Size, By User Type, 2012-2019 ($Million)
Table 26 On-Premises Market Size, By User Type, 2012-2019 ($Million)
Table 27 Global Mobile UC&C Market Size, By User Type, 2012-2019 ($Million)
Table 28 SMB Market Size, By Region, 2012-2019 ($Million)
Table 29 Enterprise Market Size, By Region, 2012-2019 ($Million)
Table 30 Global Mobile UC&C Market Size, By Industry Vertical, 2012-2019 ($Million)
Table 31 BFSI Market Size, By Region, 2012-2019 ($Million)
Table 32 Healthcare Market Size, By Region, 2012-2019 ($Million)
Table 33 Public Sector Market Size, By Region, 2012-2019 ($Million)
Table 34 Telecom and IT Market Size, By Region, 2012-2019 ($Million)
Table 35 Retail Market Size, By Region, 2012-2019 ($Million)
Table 36 Media and Entertainment Market Size, By Region, 2012-2019 ($Million)
Table 37 Transportation and Logistics Market Size, By Region, 2012-2019 ($Million)
Table 38 Others Market Size, By Region, 2012-2019 ($Million)
Table 39 Unified Endpoint Management Market Size, By Region, 2015-2022 (USD Million)
Table 40 North America Market Size By Type, 2015-2022 (USD Million)
Table 41 North America Market Size By Organization Size, 2015-2022 (USD Million)
Table 42 North America Market Size By Vertical, 2015-2022 (USD Million)
Table 43 North America Market for BFSI, By Organization Size, 2015-2022 (USD Million)
Table 44 North America Market for Telecommunication & It, By Organization Size, 2015-2022 (USD Million)
Table 45 North America Market for Consumer Goods & Retail, By Organization Size, 2015-2022 (USD Million)
Table 46 North America Market for Government & Defense, By Organization Size, 2015-2022 (USD Million)
Table 47 North America Market for Healthcare, By Organization Size, 2015-2022 (USD Million)
Table 48 North America Market for Manufacturing, By Organization Size, 2015-2022 (USD Million)
Table 49 Europe Unified Endpoint Management Market Size, By Type, 2015-2022 (USD Million)
Table 50 Europe Market Size By Organization Size, 2015-2022 (USD Million)
Table 51 Europe Market Size By Vertical, 2015-2022 (USD Million)
Table 52 Europe Market for BFSI, By Organization Size, 2015-2022 (USD Million)
Table 53 Europe Market for Telecommunication & It, By Organization Size, 2015-2022 (USD Million)
Table 54 Europe Market for Consumer Goods & Retail, By Organization Size, 2015-2022 (USD Million)
Table 55 Europe Market for Government & Defense, By Organization Size, 2015-2022 (USD Million)
Table 56 Europe Market for Healthcare, By Organization Size, 2015-2022 (USD Million)
Table 57 Europe Market for Manufacturing, By Organization Size, 2015-2022 (USD Million)
Table 58 Asia Pacific Unified Endpoint Management Market Size, By Type, 2015-2022 (USD Million)
Table 59 Asia Pacific Market Size By Organization Size, 2015-2022 (USD Million)
Table 60 Asia Pacific Market Size By Vertical, 2015-2022 (USD Million)
Table 61 Asia Pacific Market for BFSI, By Organization Size, 2015-2022 (USD Million)
Table 62 Asia Pacific Market for Telecommunication & It, By Organization Size, 2015-2022 (USD Million)
Table 63 Asia Pacific Market for Consumer Goods & Retail, By Organization Size, 2015-2022 (USD Million)
Table 64 Asia Pacific Market for Government & Defense, By Organization Size, 2015-2022 (USD Million)
Table 65 Asia Pacific Market for Healthcare, By Organization Size, 2015-2022 (USD Million)
Table 66 Asia Pacific Market for Manufacturing, By Organization Size, 2015-2022 (USD Million)
Table 67 Middle East & Africa Unified Endpoint Management Market Size, By Type, 2015-2022 (USD Million)
Table 68 Middle East & Africa Market Size By Organization Size, 2015-2022 (USD Million)
Table 69 Middle East & Africa Market Size By Vertical, 2015-2022 (USD Million)
Table 70 Middle East & Africa Market for BFSI, By Organization Size, 2015-2022 (USD Million)
Table 71 Middle East & Africa Market for Telecommunication & It, By Organization Size, 2015-2022 (USD Million)
Table 72 Middle East & Africa Market for Consumer Goods & Retail, By Organization Size, 2015-2022 (USD Million)
Table 73 Middle East & Africa Market for Government & Defense, By Organization Size, 2015-2022 (USD Million)
Table 74 Middle East & Africa Market for Healthcare, By Organization Size, 2015-2022 (USD Million)
Table 75 Middle East & Africa Market for Manufacturing, By Organization Size, 2015-2022 (USD Million)
Table 76 Latin America Unified Endpoint Management Market Size, By Type, 2015-2022 (USD Million)
Table 77 Latin America Market Size, By Organization Size, 2015-2022 (USD Million)
Table 78 Latin America Market Size, By Vertical, 2015-2022 (USD Million)
Table 79 Latin America Market for BFSI, By Organization Size, 2015-2022 (USD Million)
Table 80 Latin America Market for Telecommunication & It, By Organization Size, 2015-2022 (USD Million)
Table 81 Latin America Market for Consumer Goods & Retail, By Organization Size, 2015-2022 (USD Million)
Table 82 Latin America Market for Government & Defense, By Organization Size, 2015-2022 (USD Million)
Table 83 Latin America Market for Healthcare, By Organization Size, 2015-2022 (USD Million)
Table 84 Latin America Market for Manufacturing, By Organization Size, 2015-2022 (USD Million)
Table 85 Market Evaluation Framework
Table 86 New Product Launches/Product Enhancements, November 2016 - January 2018
Table 87 Expansions, September 2017
Table 88 Acquisitions, February 2014-July 2017
Table 89 Agreements, Collaborations & Partnerships, January 2015-January 2018
Table 90 Market Ranking for Key Players in the Unified Endpoint Management Market, 2017
List of Figures (48 Figures)
Figure 1 Unified Endpoint Management Market: Research Design
Figure 2 Data Triangulation
Figure 3 Market Size Estimation Methodology: Bottom-Up Approach
Figure 4 Market Size Estimation Methodology: Top-Down Approach
Figure 5 Assumptions
Figure 6 The Solutions Segment is Estimated to Account for the Largest Market Share in Market in 2017
Figure 7 Based on Organization Size, the SMES Segment is Projected to Grow at a Higher CAGR as Compared to the Large Enterprises Segment During the Forecast Period
Figure 8 The Healthcare Vertical Segment is Expected to Grow at the Highest CAGR During the Forecast Period
Figure 9 The Unified Endpoint Management Market in Asia Pacific is Projected to Grow at the Highest CAGR During the Forecast Period
Figure 10 The Demand for UEM Solutions to Manage Traditional and Non-Traditional Endpoints is Expected to Drive the Growth of the Market
Figure 11 Among Top 3 Verticals, the Consumer Goods & Retail Segment is Projected to Grow at the Highest CAGR From 2017 to 2022
Figure 12 The Large Enterprises Segment is Estimated to Account for the Largest Market Share in the Asia Pacific
Figure 13 North America is Estimated to Account for the Largest Share of the Market in 2017
Figure 14 Market Evolution
Figure 15 Market Drivers, Restraints, Opportunities, and Challenges
Figure 16 The Solutions Segment is Estimated to Account for the Largest Market Share in the Market in 2017
Figure 17 The Large Enterprises Segment is Estimated to Account for the Largest Market Share of the Market in 2017
Figure 18 Unified Endpoint Management Market, By Vertical, 2017-2022 (USD Million)
Figure 19 Conferencing and Voice Solution Lead the Solutions Market
Figure 20 Managed Services are Expected to Grow Rapidly in the Years to Come
Figure 21 SMB are Expected to Dominate Cloud-Based Mobile UC&C Market
Figure 22 Enterprise are Expected to Dominate On-Premises-Based Mobile UC&C Market
Figure 23 Enterprise Continue to Dominate Mobile UC&C Market
Figure 24 Cloud to Become Mainstream Among SMB in the Years to Come
Figure 25 On-Premises Adoption among Enterprise to Increase Two Fold in the Years to Come
Figure 26 Telecom and IT Continues to Dominate the Mobile UC&C Market
Figure 27 North America Region is Estimated to Account for the Largest Market Share of the Market in 2017
Figure 28 Regional Snapshot: Market in Asia Pacific is Projected to Grow at the Highest CAGR During the Forecast Period
Figure 29 North America Market Snapshot
Figure 30 Asia Pacific Market Snapshot
Figure 31 Companies Adopted New Product Launches and Partnerships & Collaborations as Key Growth Strategies Between February 2014 and January 2018
Figure 32 Unified Endpoint Management Market (Global) Competitive Leadership Mapping, 2017
Figure 33 Market Ranking, 2017
Figure 34 VMware: Company Snapshot
Figure 35 VMware: SWOT Analysis
Figure 36 Microsoft: Company Snapshot
Figure 37 Microsoft: SWOT Analysis
Figure 38 IBM: Company Snapshot
Figure 39 IBM: SWOT Analysis
Figure 40 Mobileiron: Company Snapshot
Figure 41 Mobileiron: SWOT Analysis
Figure 42 Blackberry: Company Snapshot
Figure 43 Blackberry: SWOT Analysis
Figure 44 Citrix Systems: Company Snapshot
Figure 45 Sophos: Company Snapshot
Figure 46 Symantec: Company Snapshot
Figure 47 Cisco Systems: Company Snapshot
Figure 48 CA Technologies: Company Snapshot


Growth opportunities and latent adjacency in Unified Endpoint Management Market