Thrust Vector Control Market by Technology (Gimbal Nozzle, Flex Nozzle, Thrusters, Rotating Nozzle), Application (Launch Vehicles, Missiles, Satellites & Fighter Aircraft), System (Actuation, Injection & Thruster), and Region - Global Forecast to 2022


[147 Pages Report] The thrust vector control market is projected to grow from USD 8.39 Billion in 2017 to USD 13.77 Billion by 2022, at a CAGR of 10.41% during the forecast period. The base year considered for the study is 2016, and the forecast period is from 2017 to 2022.
The thrust vector control market is projected to grow from USD 8.39 Billion in 2017 to USD 13.77 Billion by 2022, at a CAGR of 10.41% during the forecast period. Rise in the implementation of thrust vector control in fighter aircraft to gain superiority over enemy aircraft during aerial combats, increased investment in space exploration programs, and increased adoption of thrust vector control in next-generation guided missile systems are the primary drivers for the growth of the market. The market has been segmented based on technology, application, system, end user, and region.
Based on technology, the thrust vector control market has been segmented into gimbal nozzle, flex nozzle, thrusters, rotating nozzle, and others (injection, jet vanes, tabs). The flex nozzle segment is estimated to lead the market during the forecast period. The growth of this segment is due to the increased implementation of flex nozzles in satellite launchers and missiles because of movable seals and high actuation power.
Based on application, the thrust vector control market has been segmented into launch vehicles, missiles, satellites, and fighter aircraft. The fighter aircraft segment is projected to witness the highest growth during the forecast period. The rise in acquisition of fight aircraft with super maneuverability features by countries such as China and India is expected to drive the market during the forecast period.
Based on end user, the thrust vector market has been segmented into defense and space agencies. The defense segment is projected to lead the market during the forecast period. This is due to increased need for highly maneuverable fighter aircraft to gain an advantage over aerial opponents.
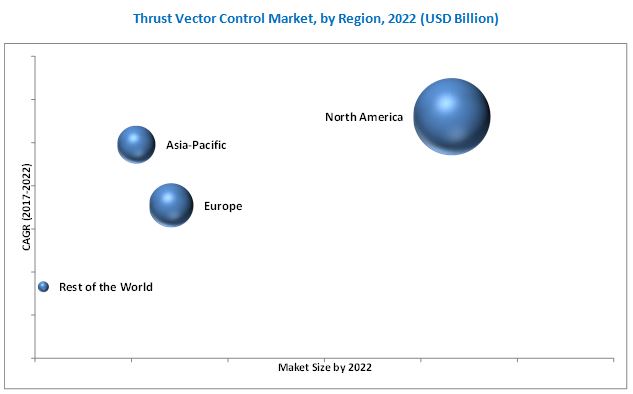
The geographical analysis of the thrust vector control market covers regions, such as North America, Europe, Asia-Pacific, and Rest of the World. North America is estimated to lead the global thrust vector control market in 2017, owing to increasing spending on space exploration programs in the region, as well as heavy investments done by the U.S. in missile research and highly maneuverable aircraft in defense.
Advancements in thrust vector control technology require high R&D and are complex in nature. This, coupled with the increasing use of reusable launch vehicles and boosters, is expected to restrain the growth of the market.
Products offered by various companies operating in the thrust vector control market have been listed in this report. Major players in the market include Honeywell International, Inc. (U.S.), Moog, Inc. (U.S.), Woodward, Inc. (U.S.), Jansen Aircraft Systems Control, Inc. (U.S.), BAE Systems (U.K.), Wickman Spacecraft & Propulsion Company (U.S.), Parker Hannifin, Inc. (U.S.), Sierra Nevada Corporation (U.S.), Dynetics, Inc. (U.S.), and SABCA (Belgium).
To speak to our analyst for a discussion on the above findings, click Speak to Analyst
 Exclusive indicates content/data unique to MarketsandMarkets and not available with any competitors.
Table of Contents
1 Introduction (Page No. - 15)
1.1 Objectives of the Study
1.2 Market Definition
1.3 Study Scope
1.3.1 Markets Covered
1.3.2 Regional Scope
1.3.3 Years Considered for the Study
1.4 Currency & Pricing
1.5 Limitations
1.6 Market Stakeholders
2 Research Methodology (Page No. - 19)
2.1 Research Data
2.1.1 Secondary Data
2.1.1.1 Key Data From Secondary Sources
2.1.2 Primary Data
2.1.2.1 Key Data From Primary Sources
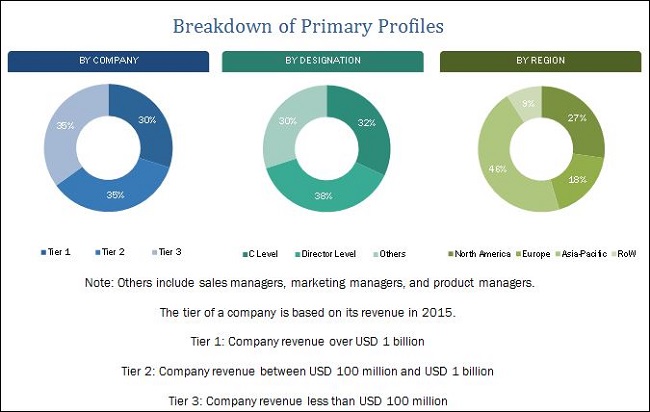
2.1.2.2 Breakdown of Primaries
2.2 Factor Analysis
2.2.1 Introduction
2.2.2 Demand-Side Analysis
2.2.2.1 Increasing Need for Highly Maneuverable Fighter Aircraft
2.2.2.2 Increase in Space Research Programs
2.2.3 Supply-Side Indicators
2.2.3.1 Increase in Budget Allocated for Missile Programs
2.2.3.2 Increasing Use of Satellites to Provide Information and Early Warnings
2.3 Market Size Estimation
2.3.1 Bottom-Up Approach
2.3.2 Top-Down Approach
2.4 Market Breakdown & Data Triangulation
2.5 Research Assumptions
3 Executive Summary (Page No. - 30)
4 Premium Insights (Page No. - 35)
4.1 Attractive Market Opportunities in the Thrust Vector Control Market
4.2 Market, By Technology
4.3 Market, By Application
4.4 Market, By System
4.5 Market, By End User
4.6 Market Road Map
4.7 Market, By Region
5 Market Overview (Page No. - 39)
5.1 Introduction
5.2 Market Segmentation
5.3 Market Dynamics
5.3.1 Drivers
5.3.1.1 Increased Need for Super-Maneuverable Fighter Aircraft
5.3.1.2 Increase in Number of Launch Vehicles and Satellite Launches
5.3.1.3 Increase in Development Programs and Production of Missiles Across the World
5.3.2 Restraints
5.3.2.1 High Complexity in Thrust Vector Control Technology
5.3.2.2 Emerging Trend of Reusable Launch Vehicles and Boosters
5.3.3 Opportunities
5.3.3.1 Ucav System Envisioned as Future Force for Suppression of Enemy Air Defenses
5.3.4 Challenges
5.3.4.1 Limitations Associated With Use of Gimbal Nozzle & Secondary Injection
6 Industry Trends (Page No. - 47)
6.1 Introduction
6.2 Technology Trends
6.2.1 Electromechanical Actuation
6.2.2 Secondary Fluidic Injection
6.2.3 Exhaust Flow Deflection
6.2.4 Ionic Thruster Thrust Vectoring
6.3 Innovations and Patent Registrations (2011-2013)
6.4 Key Trend Analysis
7 Thrust Vector Control Market, By Technology (Page No. - 53)
7.1 Introduction
7.2 Gimbal Nozzle
7.3 Flex Nozzle
7.4 Thrusters
7.5 Rotating Nozzle
7.6 Others
8 Thrust Vector Control Market, By Application (Page No. - 58)
8.1 Introduction
8.2 Launch Vehicles
8.3 Satellites
8.4 Fighter Aircraft
8.5 Missiles
9 Thrust Vector Control Market, By System (Page No. - 63)
9.1 Introduction
9.2 Thrust Vector Actuation System
9.3 Thrust Vector Injection System
9.4 Thrust Vector Thruster System
10 Thrust Vector Control Market, By End User (Page No. - 67)
10.1 Introduction
10.2 Defense
10.3 Space Agencies
11 Thrust Vector Control Market, By Region (Page No. - 71)
11.1 Introduction
11.2 North America
11.2.1 By End User
11.2.2 By Technology
11.2.3 By Application
11.2.4 By System
11.2.5 By Country
11.2.5.1 U.S.
11.2.5.1.1 By End User
11.2.5.1.2 By Technology
11.2.5.1.3 By Application
11.2.5.1.4 By System
11.2.5.2 Canada
11.2.5.2.1 By End User
11.2.5.2.2 By Technology
11.2.5.2.3 By Application
11.2.5.2.4 By System
11.3 Europe
11.3.1 By End User
11.3.2 By Technology
11.3.3 By Application
11.3.4 By System
11.3.4.1 European Union
11.3.4.1.1 By End User
11.3.4.1.2 By Technology
11.3.4.1.3 By Application
11.3.4.1.4 By System
11.3.4.2 Russia
11.3.4.2.1 By End User
11.3.4.2.2 By Technology
11.3.4.2.3 By Application
11.3.4.2.4 By System
11.4 Asia-Pacific
11.4.1 By End User
11.4.2 By Technology
11.4.3 By Application
11.4.4 By System
11.4.5 By Country
11.4.5.1 China
11.4.5.1.1 By End User
11.4.5.1.2 By Technology
11.4.5.1.3 By Application
11.4.5.1.4 By System
11.4.5.2 India
11.4.5.2.1 By End User
11.4.5.2.2 By Technology
11.4.5.2.3 By Application
11.4.5.2.4 By System
11.4.5.3 Japan
11.4.5.3.1 By End User
11.4.5.3.2 By Technology
11.4.5.3.3 By Application
11.4.5.3.4 By System
11.4.5.4 Rest of Asia-Pacific
11.4.5.4.1 By End User
11.4.5.4.2 By Technology
11.4.5.4.3 By Application
11.4.5.4.4 By System
11.5 Rest of the World (RoW)
11.5.1 By End User
11.5.2 By Technology
11.5.3 By Application
11.5.4 By System
11.5.5 By Country
11.5.5.1 Israel
11.5.5.1.1 By End User
11.5.5.1.2 By Technology
11.5.5.1.3 By Application
11.5.5.1.4 By System
11.5.5.2 South Africa
11.5.5.2.1 By End User
11.5.5.2.2 By Technology
11.5.5.2.3 By Application
11.5.5.2.4 By System
12 Competitive Landscape (Page No. - 106)
12.1 Introduction
12.1.1 Vanguards
12.1.2 Innovator
12.1.3 Dynamic
12.1.4 Emerging
12.2 Competitive Benchmarking
12.2.1 Product Offerings
12.2.2 Business Strategies
13 Company Profiles (Page No. - 110)
(Overview, Products & Services, Strategies & Insights, Developments and MnM View)*
13.1 Moog Inc.
13.2 Woodward, Inc.
13.3 Honeywell International Inc.
13.4 United Technologies Corporation
13.5 BAE Systems PLC
13.6 Orbital ATK
13.7 Parker-Hannifin Corporation
13.8 S.A.B.C.A. (Sociétés Anonyme Belge De Constructions Aéronautiques)
13.9 Dynetics, Inc.
13.10 Sierra Nevada Corporation
13.11 Almatech Sa
13.12 Wickman Spacecraft & Propulsion Company
13.13 Jansen’s Aircraft Systems Controls Inc.
*Details on Overview, Products & Services, Strategies & Insights, Developments and MnM View Might Not Be Captured in Case of Unlisted Companies.
14 Appendix (Page No. - 140)
14.1 Discussion Guide
14.2 Knowledge Store: Marketsandmarkets’ Subscription Portal
14.3 Introducing RT: Real-Time Market Intelligence
14.4 Available Customizations
14.5 Author Details
List of Tables (83 Tables)
Table 1 List of Fighter Aircraft With Thrust Vector Control
Table 2 Number of Active Conflicts and Casualties Due to Missile Attacks Across the Globe Between 2008 and 2014
Table 3 Evolution of Thrust Vector Control Technology
Table 4 Innovations and Patent Registrations
Table 5 Key Trend Analysis, 2016
Table 6 Thrust Vector Control Market, By Technology, 2015-2022 (USD Million)
Table 7 Gimbal Nozzle Segment, By Region, 2015–2022 (USD Million)
Table 8 Flex Nozzle Segment, By Region, 2015–2022 (USD Million)
Table 9 Thrusters Segment, By Region, 2015–2022 (USD Million)
Table 10 Rotating Nozzle Segment, By Region, 2015–2022 (USD Million)
Table 11 Others Segment, By Region, 2015–2022 (USD Million)
Table 12 Market, By Application, 2015-2022 (USD Million)
Table 13 Launch Vehicles Segment, By Region, 2015–2022 (USD Million)
Table 14 Satellites Segment, By Region, 2015–2022 (USD Million)
Table 15 Fighter Aircraft Segment, By Region, 2015–2022 (USD Million)
Table 16 Missiles Segment, By Region, 2015–2022 (USD Million)
Table 17 Thrust Vector Control Market, By System, 2015-2022 (USD Million)
Table 18 Thrust Vector Actuation System Segment, By Region, 2015–2022 (USD Million)
Table 19 Thrust Vector Injection System Segment, By Region, 2015–2022 (USD Million)
Table 20 Thrust Vector Thruster System Segment, By Region, 2015–2022 (USD Million)
Table 21 Market, By End User, 2015-2022 (USD Million)
Table 22 Defense Segment, By Region, 2015–2022 (USD Million)
Table 23 Space Agencies Segment, By Region, 2015–2022 (USD Million)
Table 24 Market Size, By Region, 2015-2022 (USD Million)
Table 25 North America: Thrust Vector Control Market Size, By End User, 2015-2022 (USD Million)
Table 26 North America: Thrust Vector Control Market Size, By Technology, 2015-2022 (USD Million)
Table 27 North America: Thrust Vector Control Market Size, By Application, 2015-2022 (USD Million)
Table 28 North America: Thrust Vector Control Market Size, By System/Type, 2015-2022 (USD Million)
Table 29 North America: Thrust Vector Control Market Size, By Country, 2015-2022 (USD Million)
Table 30 U.S.: Thrust Vector Control Market Size, By End User, 2015-2022 (USD Million)
Table 31 U.S.: Thrust Vector Control Market Size, By Technology, 2015-2022 (USD Million)
Table 32 U.S.: Thrust Vector Control Markett Size, By Application, 2015-2022 (USD Million)
Table 33 U.S.: Thrust Vector Control Market Size, By System, 2015-2022 (USD Million)
Table 34 Canada: Thrust Vector Control Market Size, By End User, 2015-2022 (USD Million)
Table 35 Canada: Market Size, By Technology, 2015-2022 (USD Million)
Table 36 Canada: Market Size, By Application, 2015-2022 (USD Million)
Table 37 Canada: Market Size, By System/Type, 2015-2022 (USD Million)
Table 38 Europe: Market Size, By End User, 2015-2022 (USD Million)
Table 39 Europe: Market Size, By Technology, 2015-2022 (USD Million)
Table 40 Europe: Market Size, By Application, 2015-2022 (USD Million)
Table 41 Europe: Market Size, By System, 2015-2022 (USD Million)
Table 42 European Union: Market Size, By End User, 2015-2022 (USD Million)
Table 43 European Union: Market Size, By Technology, 2015-2022 (USD Million)
Table 44 European Union: Market Size, By Application, 2015-2022 (USD Million)
Table 45 European Union: Market Size, By System, 2015-2022 (USD Million)
Table 46 Russia: Market Size, By End User, 2015-2022 (USD Million)
Table 47 Russia: Market Size, By Technology, 2015-2022 (USD Million)
Table 48 Russia: Market Size, By Application, 2015-2022 (USD Million)
Table 49 Russia: Market Size, By System/Type, 2015-2022 (USD Million)
Table 50 Asia-Pacific: Thrust Vector Control Market Size, By End User, 2015-2022 (USD Million)
Table 51 Asia-Pacific: Market Size, By Technology, 2015-2022 (USD Million)
Table 52 Asia-Pacific: Market Size, By Type, 2015-2022 (USD Million)
Table 53 Asia-Pacific: Market Size, By Type, 2015-2022 (USD Million)
Table 54 Asia-Pacific: Market Size, By Country, 2015-2022 (USD Million)
Table 55 China: Thrust Vector Control Market Size, By End User, 2015-2022 (USD Million)
Table 56 China: Market Size, By Technology, 2015-2022 (USD Million)
Table 57 China: Market Size, By Application, 2015-2022 (USD Million)
Table 58 China: Market Size, By System, 2015-2022 (USD Million)
Table 59 India: Market Size, By End User, 2015-2022 (USD Million)
Table 60 India: Market Size, By Technology, 2015-2022 (USD Million)
Table 61 India: Market Size, By Application, 2015-2022 (USD Million)
Table 62 India: Market Size, By System, 2015-2022 (USD Million)
Table 63 Japan: Market Size, By End User, 2015-2022 (USD Million)
Table 64 Japan: Market Size, By Technology, 2015-2022 (USD Million)
Table 65 Japan: Market Size, By Application, 2015-2022 (USD Million)
Table 66 Japan: Market Size, By System, 2015-2022 (USD Million)
Table 67 Rest of Asia-Pacific: Thrust Vector Control Market Size, By End User, 2015-2022 (USD Million)
Table 68 Rest of Asia-Pacific: Market Size, By Technology, 2015-2022 (USD Million)
Table 69 Rest of Asia-Pacific: Market Size, By Application, 2015-2022 (USD Million)
Table 70 Rest of Asia-Pacific: Market Size, By System, 2015-2022 (USD Million)
Table 71 RoW: Market Size, By End User, 2015-2022 (USD Million)
Table 72 RoW: Market Size, By Technology, 2015-2022 (USD Million)
Table 73 RoW: Market Size, By Application, 2015-2022 (USD Million)
Table 74 RoW: Thrust Vector Control Market Size, By Type, 2015-2022 (USD Million)
Table 75 RoW :Market Size, By Country, 2015-2022 (USD Million)
Table 76 Israel: Market Size, By End User, 2015-2022 (USD Million)
Table 77 Israel: Market Size, By Technology, 2015-2022 (USD Million)
Table 78 Israel: Market Size, By Application, 2015-2022 (USD Million)
Table 79 Israel: Market Size, By System/Type, 2015-2022 (USD Million)
Table 80 South Africa: Market Size, By End User, 2015-2022 (USD Million)
Table 81 South Africa: Market Size, By Technology, 2015-2022 (USD Million)
Table 82 South Africa: Market Size, By Application, 2015-2022 (USD Million)
Table 83 South Africa: Market Size, By System, 2015-2022 (USD Million)
List of Figures (43 Figures)
Figure 1 Thrust Vector Control Market: Markets Covered
Figure 2 Years Considered for the Study
Figure 3 Research Process Flow
Figure 4 Market: Research Design
Figure 5 Breakdown of Primary Interviews: By Company Type, Designation, & Region
Figure 6 Market Size Estimation Methodology: Bottom-Up Approach
Figure 7 Market Size Estimation Methodology: Top-Down Approach
Figure 8 Data Triangulation
Figure 9 Assumptions of the Research Study
Figure 10 Market, By Technology, 2017 & 2022 (USD Million)
Figure 11 Fighter Aircraft Application Segment is Projected to Lead the Market During the Forecast Period
Figure 12 Based on System, Thrust Vector Actuation System Segment is Projected to Lead the Market During the Forecast Period
Figure 13 Based on End User, Defense Segment is Projected to Lead the Market During the Forecast Period
Figure 14 North America Thrust Vector Control Market is Projected to Grow at the Highest CAGR During the Forecast Period
Figure 15 Increased Adoption of Super-Maneuvering Fighter Aircraft is A Major Factor Driving the Market
Figure 16 Based on Technology, the Rotating Nozzle Segment is Expected to Lead the Market During the Forecast Period
Figure 17 The Fighter Aircraft Application Segment is Projected to Lead the Market From 2017 to 2022
Figure 18 Based on System, the Thrust Vector Actuation System Segment is Projected to Lead the Market During the Forecast Period
Figure 19 Based on End User, the Defense Segment is Projected to Lead the Market From 2017 to 2022
Figure 20 Market Road Map
Figure 21 Market in North America is Projected to Grow at the Highest CAGR During the Forecast Period
Figure 22 Market Segmentation
Figure 23 Drivers, Restraints, Opportunities, and Challenges of the Market
Figure 24 Number of Active Satellites Expected to Increase By 48% By 2022
Figure 25 Number of Active Satellites in 2015 Based on Application
Figure 26 Rotating Nozzle Segment is Projected to Grow at the Highest CAGR During the Forecast Period
Figure 27 Fighter Aircraft Segment is Projected to Grow at the Highest CAGR During the Forecast Period
Figure 28 Thrust Vector Actuation System Will Continue to Account for Highest Market Share During the Forecast Period
Figure 29 Defense Segment Projected to Grow at the Highest CAGR During the Forecast Period
Figure 30 Market: Regional Snapshot (2016)
Figure 31 North America Thrust Vector Control Market Snapshot
Figure 32 Europe Thrust Vector Control Market Snapshot
Figure 33 Asia-Pacific Thrust Vector Control Market Snapshot
Figure 34 Dive Chart
Figure 35 Moog, Inc.: Company Snapshot
Figure 36 Woodward, Inc.: Company Snapshot
Figure 37 Honeywell International Inc.: Company Snapshot
Figure 38 United Technologies Corporation: Company Snapshot
Figure 39 BAE Systems PLC: Company Snapshot
Figure 40 Orbital ATK: Company Snapshot
Figure 41 Parker-Hannifin Corporation: Company Snapshot
Figure 42 S.A.B.C.A.: Company Snapshot
Figure 43 Dynetics, Inc.: Company Snapshot
Objectives of the Study:
The report analyzes the thrust vector control market based on technology (gimbal nozzle, flex nozzle, thrusters, rotating nozzles, others), application (launch vehicles, missiles, satellites, fighter aircraft), system (actuation, injection, thruster), end user (space agencies, defense). These segments and subsegments were mapped across major regions, namely, North America, Europe, Asia-Pacific, and Rest of the World (RoW).
The report provides an in-depth market intelligence regarding market dynamics and major factors, such as drivers, restraints, opportunities, and industry-specific challenges influencing the growth of the thrust vector control market, along with an analysis of micromarkets with respect to individual growth trends, growth prospects, and their contribution to the overall market. The report also covers competitive developments, such as contracts, new product launches, agreements, and research & development activities in the thrust vector control market.
Research Methodology:
The market size estimation for various segments and subsegments of the thrust vector control market was arrived at by referring to varied secondary sources, such as OMICS International, Bloomberg Businessweek, European Defence Agency, through corroboration with primaries, and further market triangulation with the help of statistical techniques using econometric tools. All percentage shares, splits, and breakdowns were determined using secondary sources and verified through primary sources. All possible parameters that affect the market were accounted for, viewed in extensive detail, verified through primary research, and analyzed to acquire the final quantitative and qualitative data. This data is consolidated with detailed inputs and analysis from MarketsandMarkets, and presented in this report.
To know about the assumptions considered for the study, download the pdf brochure
The ecosystem of the thrust vector control market comprises raw material suppliers, manufacturers, distributors, and end users. Key players operating in the market include Honeywell International, Inc. (U.S.), Moog, Inc. (U.S.), Woodward, Inc. (U.S.), Jansen Aircraft Systems Control, Inc. (U.S.), BAE Systems (U.K.), Wickman Spacecraft & Propulsion Company (U.S.), Parker Hannifin, Inc. (U.S.), Sierra Nevada Corporation (U.S.), Dynetics, Inc. (U.S.), and SABCA (Belgium). These players have adopted strategies, such as contracts, new product developments, and agreements to strengthen their position in the market.
Target Audience:
- Thrust Vector Manufacturers
- Thrust Vector Suppliers
- Thrust Vector Technology Support Providers
- Thrust Vector Software Providers
- Armed Forces
- Defense Regulatory Bodies
- Software/Hardware/Solution Providers
Scope of the Report:
This research report categorizes the thrust vector control market into the following segments and subsegments:
-
Thrust Vector Control Market, By Technology
- Gimbal Nozzle
- Flex Nozzle
- Thrusters
- Rotating Nozzle
- Others (Injection, Jet Vanes, Tabs)
-
Thrust Vector Control Market, By Application
- Launch Vehicles
- Missiles
- Satellites
- Fighter Aircraft
-
Thrust Vector Control Market, By System
- Thrust Vector Actuation System
- Thrust Vector Injection System
- Thrust Vector Thruster System
-
Thrust Vector Control Market, By End User
- Space Agencies
- Defense
-
Thrust Vector Control Market, By Region
- North America
- Europe
- Asia-Pacific
- Rest of the World
Customizations Available for the Report:
Along with the given market data, MarketsandMarkets offers customizations as per the specific needs of the company. The following customization options are available for the report:
- Company Information
- Detailed analysis and profiles of additional market players (up to five)
- Geographic analysis: Further breakdown of the market at country-level


Growth opportunities and latent adjacency in Thrust Vector Control Market