
Telecom Cloud Market Size, Share, Growth & Latest Trends

Telecom Cloud Market by Network Function Virtualization (NFV) Software (Virtualized Network Function/Cloud-Native Network Function, NFV Infrastructure), by Cloud Service (SaaS, PaaS, IaaS), by Cloud Deployment (Public, Private, Hybrid) - Global Forecast to 2030


OVERVIEW
Source: Secondary Research, Interviews with Experts, MarketsandMarkets Analysis
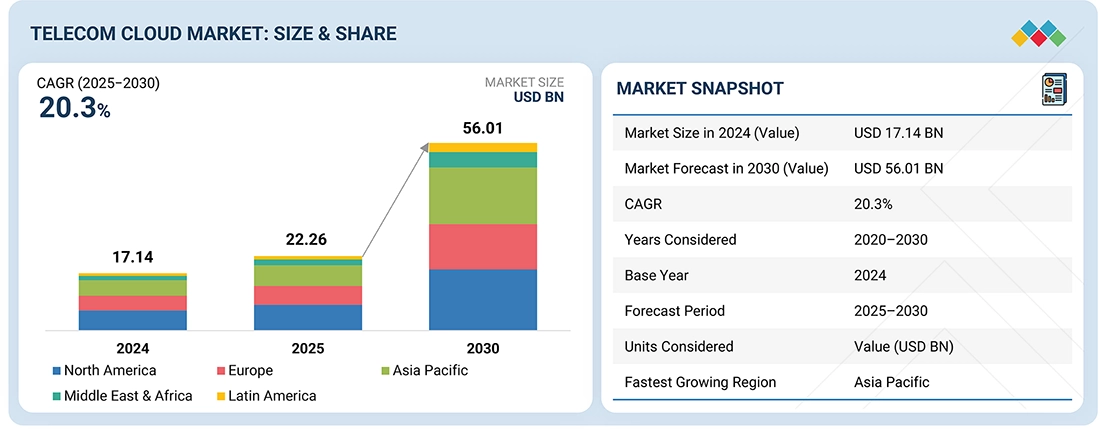
The telecom cloud market is projected to grow from USD 22.26 billion in 2025 to USD 56.01 billion by 2030 at a compound annual growth rate (CAGR) of 20.3% from 2025 to 2030. The market is experiencing strong growth as operators increasingly shift toward cloud-native infrastructures to support evolving network demands, including 5G, edge computing, and AI-driven services. Key drivers fueling this transformation include the need for reduced operational and capital expenditure, scalable network architectures, and enhanced service agility. The rise of virtualized network functions (VNFs) and software-defined networking (SDN) enables dynamic resource provisioning and efficient workload management, helping operators meet rising data traffic and low-latency application requirements. Recent developments, such as hyperscale’s partnerships with telecom operators and Open RAN initiatives, are reshaping the market landscape. Demand for customized enterprise connectivity solutions and rapid digital transformation across industries further accelerates telecom cloud adoption. Technological advancements in container orchestration, AI-powered automation, and network slicing enable flexible, programmable, and resilient telecom networks. As regulatory frameworks mature and cloud infrastructure expands across regions, the telecom cloud market is positioned for sustained growth, becoming a cornerstone of next-generation, intelligent telecommunications.
KEY TAKEAWAYS
- The North American Telecom Cloud market accounted for a 32.6% revenue share in 2030.
- By component, the services segment is expected to register the highest CAGR of 21.8%.
- By Deployment Mode, Hybrid segment accounted for a 32.9% revenue share in 2030.
- AWS, Google, and Microsoft are identified as star players in the telecom cloud market due to hyperscale global infrastructure, strong 5G and edge partnerships with telcos, mature cloud-native network-function platforms, robust security, and extensive ecosystems for OSS/BSS, analytics, and AI.
- Robin.io, Inmanta, and UK Cloud Communications, among others, have distinguished themselves among startups and SMEs by delivering Kubernetes-native CNF orchestration and lifecycle automation, model-driven network orchestration and policy automation, and secure cloud-native managed communications/CPaaS for telcos.
The telecom cloud market is transforming global communications infrastructure by enabling telecom operators to virtualize, scale, and optimize network operations through cloud-native technologies. These solutions support critical functions such as core network deployment, radio access management, and edge service delivery, replacing legacy hardware with flexible, software-defined architectures. Powered by VMware Cloud Foundation, AWS Wavelength, and Microsoft Azure for Operators, the telecom cloud leverages network function virtualization (NFV), software-defined networking (SDN), edge computing, and AI-driven automation. These components enable real-time orchestration, dynamic resource allocation, and improved service agility across multi-vendor, hybrid environments. Market growth is driven by the widespread deployment of 5G, increasing demand for low-latency applications, and the rising need for cost-efficient, scalable network infrastructure. The telecommunications, manufacturing, and autonomous mobility industries are adopting telecom cloud solutions to support real-time data processing, ultra-reliable connectivity, and next-generation use cases. As telecom operators accelerate digital transformation, the telecom cloud is emerging as foundational infrastructure for multi-access edge computing, Open RAN, and cloud-native 5G cores. These platforms enhance operational flexibility, ensure compliance with data sovereignty requirements, and enable AI-powered network optimization, positioning the telecom cloud market as a central pillar in the future of digital communications.
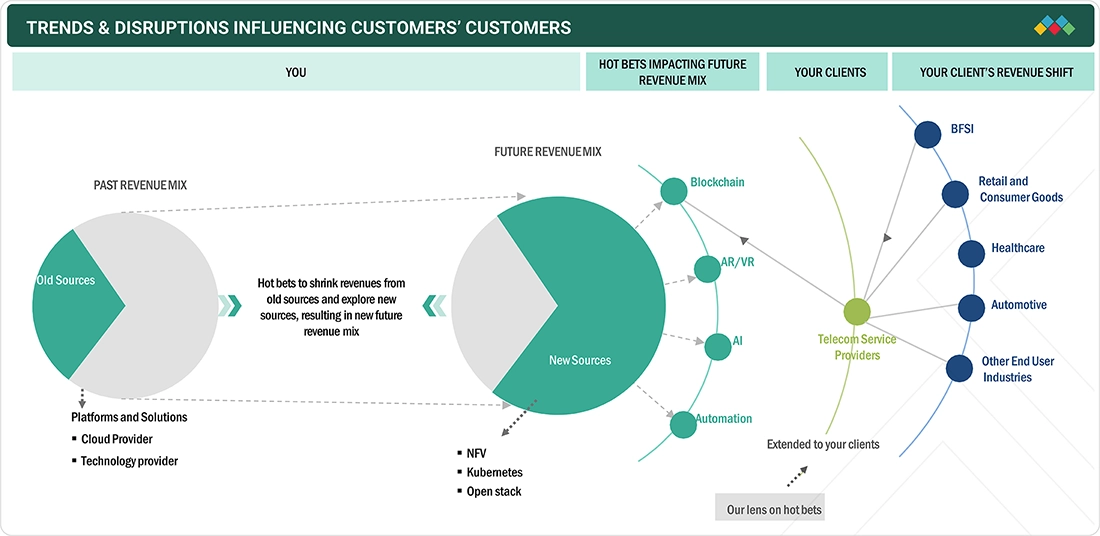
TRENDS & DISRUPTIONS IMPACTING CUSTOMERS' CUSTOMERS
Trends and disruptions in the telecom cloud market are driving digital transformation for customers’ customers by reshaping revenue models and service delivery. The move from legacy network services to offerings such as Network-as-a-Service (NaaS), sovereign and hybrid cloud models, and data monetization is enabling telecom operators to accelerate 5G deployment, adopt virtualization, leverage edge computing, and scale resources on demand. These developments create faster, more reliable connectivity and improve digital service quality, while allowing networks to respond quickly to changing demand. By using advanced data analytics and cloud-native platforms, operators can deliver personalized, seamless experiences and maintain robust connectivity across devices. Simplifying OSS/BSS management and proactively enhancing customer experience further reduce service disruptions and strengthen network resilience. Altogether, these trends lay the foundation for agile innovation and optimization, generating value throughout the telecommunications value chain.
Source: Secondary Research, Interviews with Experts, MarketsandMarkets Analysis
MARKET DYNAMICS
Level
-
Emergence of 5G standard and increasing use of IoT use cases

-
Growth in 5G paving eMBB, mMTC, and URLLC

Level
-
Portability and interoperability issues

-
Cyberattacks can damage systems

Level
-
Demand for Open RAN and private 5G network

-
Demand for SDN and NFV-based cloud-native solutions

Level
-
Complexities related to operating environment

-
Issues with government regulations

Source: Secondary Research, Interviews with Experts, MarketsandMarkets Analysis
Driver: Emergence of 5G standard and increasing use of IoT use cases
The introduction of 5G standards and the rapid expansion of IoT use cases are driving unprecedented demand for telecom cloud solutions. As 5G networks deliver enhanced mobile broadband, massive machine-type communications, and ultra-reliable low-latency connections, operators require a flexible, scalable infrastructure to manage complex service requirements and dynamic traffic patterns. Cloud-native platforms enable the deployment of virtualized network functions and multi-access edge computing nodes that bring compute resources closer to devices, ensuring performance and reliability for mission-critical IoT applications in manufacturing, smart cities, and autonomous systems. The integration of 5G network slicing with the varying connectivity requirements of IoT necessitates advanced orchestration and automation capabilities that are best supported by well-established telecom cloud environments. By leveraging on-demand resource provisioning, containerized microservices, and advanced analytics, operators can optimize network utilization, accelerate new service rollouts, and contain capital and operational expenses. Investing in telecom cloud platforms is crucial for leveraging the opportunities presented by 5G-enabled Internet of Things (IoT) technologies. By embracing these advanced platforms, telecom companies can differentiate their service offerings, creating unique and innovative solutions that stand out in the market. This strategic move not only enhances their capability to tap into new revenue streams but also positions them to achieve a significant competitive advantage in the fast-paced and ever-evolving digital landscape.
Restraint: Portability and interoperability issues
Portability and interoperability present significant restraints on the telecom cloud market’s growth by complicating multi-vendor and multi-cloud deployments. Proprietary interfaces and inconsistent implementation of open standards across virtualization, orchestration, and container platforms hinder seamless workload migration and service portability. As operators distribute network functions across public clouds, private clouds, and edge nodes, mismatches in API conventions, data models, and management tools drive complex integration and elevate operational risk. This fragmentation can lead to vendor lock-in, limiting strategic flexibility and inflating both migration costs and time to market for new services. Inconsistent interoperability poses significant challenges to achieving reliable end-to-end service assurance. The presence of various monitoring and orchestration frameworks creates difficulties in delivering cohesive policy enforcement, security measures, and performance guarantees. To effectively tackle these complex issues, it is essential to invest in the development of standardized interfaces and cross-domain orchestration solutions. Furthermore, active participation in industry consortia is crucial for Open RAN and Kubernetes Network Function standards. Such collaborative efforts will help ensure that telecom cloud environments can attain the necessary agility, scalability, and resilience required for sustained growth in the future.
Opportunity: Demand for SDN and NFV-based cloud-native solutions
The growing demand for software-defined networking (SDN) and network function virtualization (NFV) cloud native solutions represents a significant growth opportunity in the telecom cloud market. Traditional hardware-centric networks struggle to keep pace with dynamic traffic patterns and emerging use cases, whereas SDN and NFV architectures enable programmable, on-demand services. Cloud-native architectures utilize containerization and microservices to streamline deployment processes, automate lifecycle management, and facilitate rapid scaling. These approaches optimize resource utilization and enhance system resilience, enabling teams to deliver updates and new features with greater agility while maintaining robust operational efficiency. This shift reduces dependency on proprietary appliances, lowers capital and operational expenditures, and accelerates service innovation by providing operators with the flexibility to operate virtual network functions such as virtual routers, firewalls, and load balancers in minutes. In addition, SDN and NFV-driven automation enhances network visibility and resilience through centralized orchestration and real-time analytics, improving fault management and performance optimization. As 5G, IoT, and edge computing applications proliferate, cloud native SDN and NFV solutions will be critical for delivering tailored, high-performance connectivity while streamlining infrastructure management.
Challenge: Risk of information loss
The risk of information loss remains a critical challenge hindering the growth of the telecom cloud market. As telecom operators increasingly shift core network functions and sensitive subscriber data to cloud environments, the potential exposure to data breaches, service outages, and unauthorized access grows significantly. Cloud-based infrastructure, while offering scalability and flexibility, introduces vulnerabilities related to multi-tenancy, cross-border data transfer, and inconsistent security practices across public and private clouds. Disruptions in service or accidental misconfigurations can lead to loss of mission-critical data, negatively impacting service reliability and regulatory compliance. Furthermore, the telecommunications sector deals with enormous quantities of real-time data, which renders it a prime target for cybercriminals. To effectively combat these threats, it is crucial to implement robust measures that ensure end-to-end data integrity, comprehensive encryption protocols, and stringent access control mechanisms. As the market continues to expand, it is imperative for telecom cloud vendors and service providers to channel their investments into the development of sophisticated cybersecurity frameworks, resilient disaster recovery strategies, and adherence to industry-specific data governance standards. These measures not only address the escalating demand for enhanced security but also ensure the availability and reliability of cloud-native telecom infrastructure, thus fostering greater trust among users and stakeholders alike.
Telecom Cloud Market: COMMERCIAL USE CASES ACROSS INDUSTRIES
| COMPANY | USE CASE DESCRIPTION | BENEFITS |
|---|---|---|
 |
TELUS collaborated with Google Cloud and Onix to transform how it captures and manages data, significantly improving data-driven decisions toward its generative AI and analytics capabilities. | The transformation empowered TELUS's data scientists with tools to enhance customer journeys, leading to improved customer experiences and operational efficiency. |
 |
O2 Telefónica migrated its 5G core network to the cloud using AWS and Nokia technologies, enabling a resilient and scalable architecture for its 5G services. | The cloud-native approach allowed for faster updates, improved performance, and enhanced data security, resulting in a better customer experience and operational agility. |
 |
TPG Telecom partnered with Ericsson to launch Australia's first cloud-native 5G standalone network, simplifying and streamlining its network operations. | The transformation led to faster time-to-market for new offerings, improved network efficiency, and enhanced service delivery to customers. |
 |
stc group co-created a dynamic hybrid cloud foundation with IBM, automating operations and cloudifying applications to accelerate digital transformation across the enterprise. | The initiative resulted in a 30% reduction in capital expenditures, a 30–35% decrease in container costs, and improved disaster recovery capabilities, enhancing overall operational efficiency. |
Logos and trademarks shown above are the property of their respective owners. Their use here is for informational and illustrative purposes only.
MARKET ECOSYSTEM
The telecom cloud market ecosystem is composed of several key constituents that collectively enable end-to-end digital transformation. Hardware infrastructure providers deliver the physical network and computing resources necessary for cloud deployment. Virtualization and cloud infrastructure platforms provide scalable, flexible environments for running applications and services. Network function providers offer virtualized and containerized network functions, while OSS/BSS and service management solutions ensure smooth operations and service delivery. AI, analytics, and automation solutions enhance network intelligence and decision-making. Edge computing and content delivery optimize latency and performance, while security and compliance providers safeguard data and operations. System integrators and consulting firms enable integration and strategic guidance across the ecosystem.
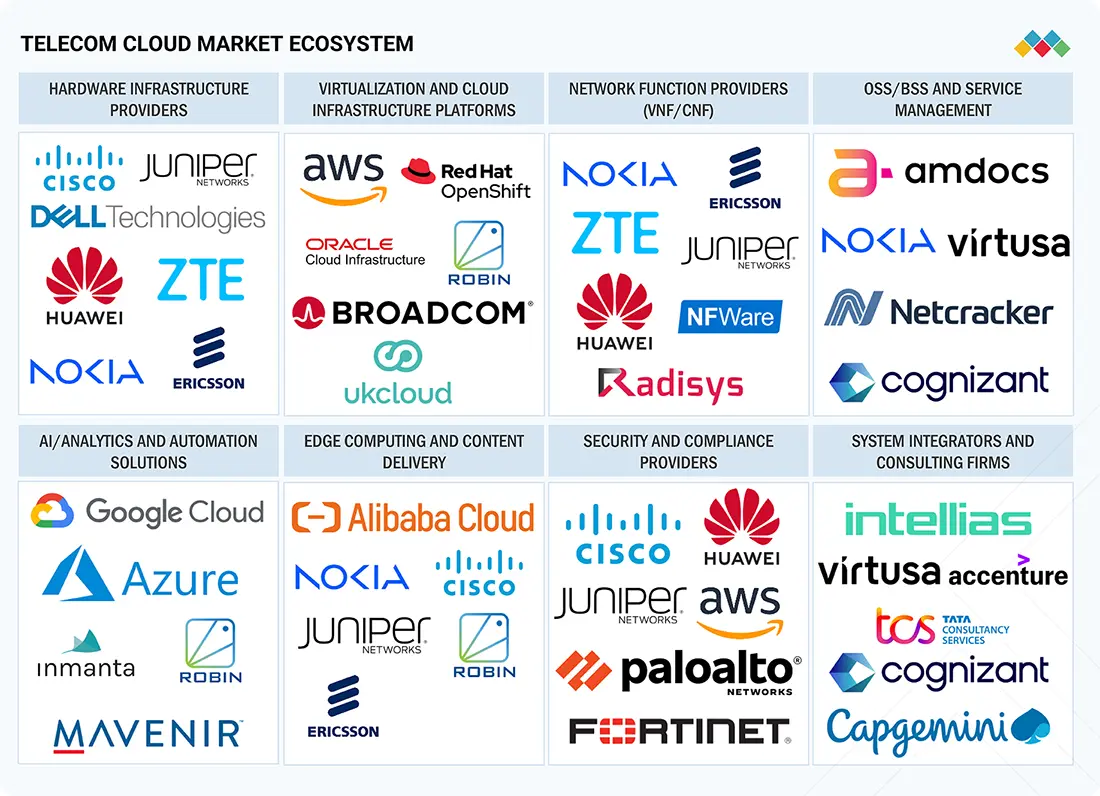
Logos and trademarks shown above are the property of their respective owners. Their use here is for informational and illustrative purposes only.
MARKET SEGMENTS
Source: Secondary Research, Interviews with Experts, MarketsandMarkets Analysis
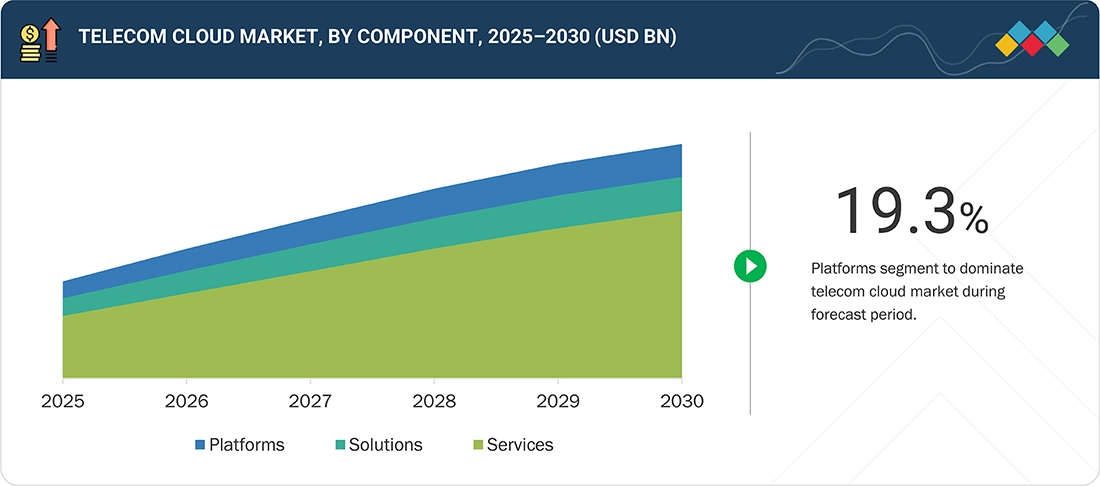
Telecom Cloud Market, By Component
The platform component segment of the telecom cloud market, which includes cloud infrastructure and virtualization platforms, is expected to capture the largest market share over the forecast period. These platforms enable network transformation by supporting cloud-native deployments, 5G, edge computing, and network function virtualization (NFV), addressing telecom operators’ needs for scalability, low latency, and cost efficiency. They provide the essential infrastructure for virtualized core and RAN workloads while ensuring interoperability across multi-vendor environments. Strategic collaborations, such as Broadcom-VMware with Deutsche Telekom and AWS with Nokia, drive adoption by delivering tailored and secure solutions. Furthermore, regulatory requirements for data sovereignty and the growing adoption of Open RAN architectures reinforce demand for flexible, robust platforms, cementing their leading position in the telecom cloud market.
Telecom Cloud Market, By Deployment Model
The private cloud deployment model is projected to exhibit the highest CAGR in the telecom cloud market during the forecast period, driven by its ability to meet the stringent security, compliance, and data sovereignty requirements that are essential for telecom operators. Private cloud environments offer dedicated infrastructure that ensures enhanced control over data and network functions, which is particularly critical for handling sensitive 5G and IoT workloads. These environments support ultra-low latency performance, making them ideal for mission-critical applications such as network slicing, mobile edge computing, and autonomous service delivery. The rising emphasis on regulatory compliance, such as the enforcement of the EU’s AI Act for telecommunications and other national data protection mandates, further propels the adoption of private cloud models that facilitate localized data processing and storage. Moreover, private cloud deployments allow telecom providers to mitigate cybersecurity risks while maintaining operational independence and infrastructure transparency. Strategic partnerships, such as Broadcom and VMware’s collaboration with Bouygues Telecom, underscore the role of advanced virtualization and automation capabilities in optimizing private cloud solutions. As telecom operators seek to balance scalability with security and regulatory adherence, the private cloud model stands out as a highly viable and future-ready deployment strategy, fueling its accelerated growth in the telecom cloud ecosystem.
Telecom Cloud Market, By Cloud Service Model
The Software-as-a-Service (SaaS) segment is expected to capture the largest market share within the cloud service model category of the telecom cloud market during the forecast period. This growth is driven by the model's ability to deliver scalable, cost-efficient, and quickly deployable applications that meet the evolving operational needs of telecom providers. SaaS offerings such as customer relationship management systems, billing platforms, service orchestration tools, and AI-powered network management solutions allow operators to enhance service delivery, optimize customer experiences, and streamline internal processes without requiring heavy infrastructure investments. The widespread rollout of 5G and the expansion of IoT use cases are accelerating demand for SaaS-based platforms that offer real-time analytics, flexible orchestration, and intelligent automation. Strategic partnerships, including the integration of IBM’s watsonx Orchestrate with Oracle Cloud Infrastructure, demonstrate the growing focus on embedding advanced AI capabilities into telecom SaaS offerings. Additionally, SaaS platforms simplify compliance with regulatory frameworks such as the EU’s AI Act through built-in security measures, regular updates, and centralized data management. As telecom operators prioritize agility, innovation, and operational efficiency, the SaaS model stands out as the most adaptable and broadly adopted solution in the telecom cloud ecosystem.
Telecom Cloud Market, By NFV Software
Network Functions Virtualization Infrastructure (NFVI) is projected to achieve a higher growth rate within the telecom cloud market under the Network Functions Virtualization (NFV) software segment due to increasing adoption of virtualized network functions by telecom operators. NFVI provides the essential hardware and software environment required to deploy, manage, and orchestrate NFV applications, enabling operators to replace traditional physical network appliances with scalable, cloud-native solutions. The shift toward 5G, edge computing, and Open RAN architectures is driving demand for flexible, high-performance infrastructure that supports low-latency and high-throughput requirements. Additionally, NFVI enhances cost efficiency, simplifies network management, and ensures interoperability across multi-vendor ecosystems, making it a key growth driver in NFV deployment strategies.
REGION
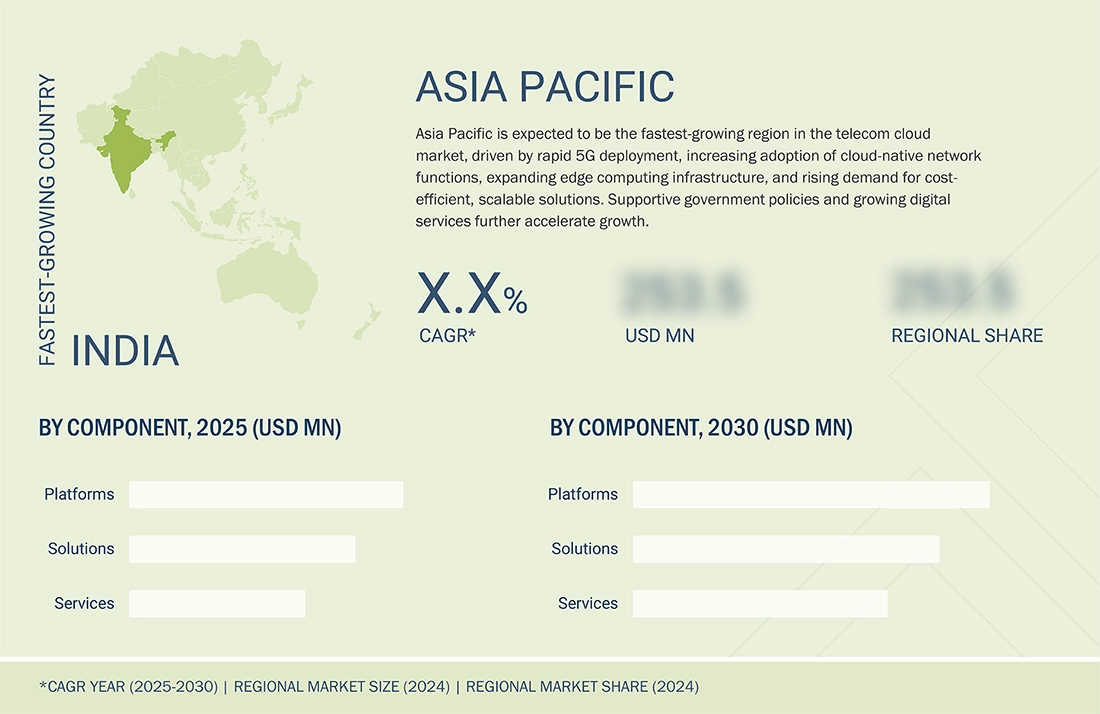
Asia Pacific to be fastest-growing region in global telecom cloud market during forecast period
Asia Pacific is projected to register the highest CAGR in the telecom cloud market during the forecast period from 2025 to 2030, driven by rapid advancements in digital infrastructure, large-scale 5G deployments, and supportive government initiatives across key economies such as China, India, South Korea, and Southeast Asian nations. The region is undergoing a robust transition toward network virtualization, as telecom operators accelerate the adoption of cloud-native 5G cores, multi-access edge computing, and AI-enabled automation to meet growing connectivity and performance demands. A notable example highlighting this trend is NTT Communications' collaboration with Oracle Cloud Infrastructure, focused on enhancing regional cloud capabilities with AI-powered network management tools. This development reflects the region’s increasing focus on intelligent, region-specific cloud platforms to support next-generation use cases such as network optimization, autonomous network operations, and highly personalized service delivery. Furthermore, hyperscale cloud providers are rapidly expanding their presence across Asia Pacific, establishing new data centers and forging partnerships with regional telecom carriers. Simultaneously, the adoption of Open RAN and virtualized RAN technologies is gaining traction, helping reduce vendor dependency and enabling agile network rollouts. With the increase in mobile data usage and rising demand for low-latency digital services, these advancements position the Asia Pacific region as a leader in telecom cloud adoption, supported by a vibrant and innovation-driven ecosystem.
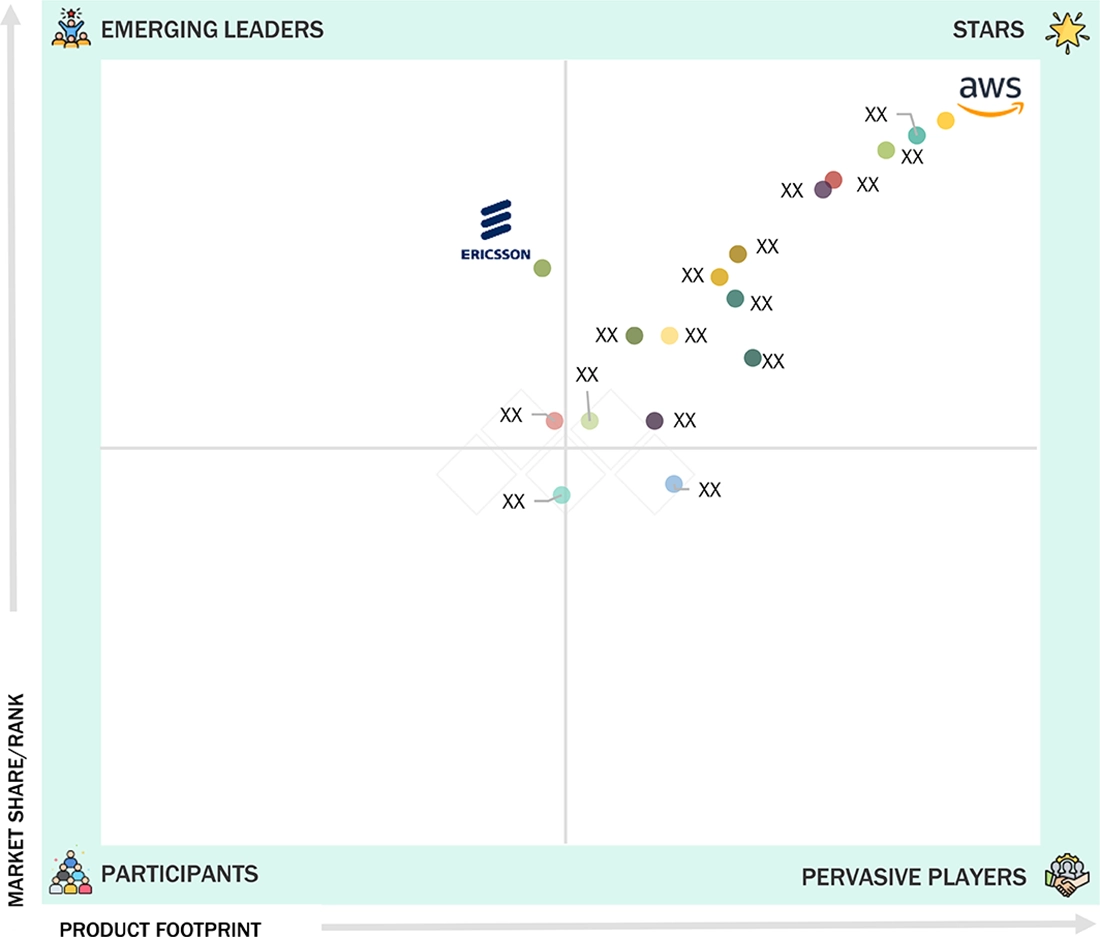
Telecom Cloud Market: COMPANY EVALUATION MATRIX
In the telecom cloud market matrix, AWS (Star) leads with a strong market share and extensive product footprint, scalable, secure cloud infrastructure, partnering with telecom operators, and enabling 5G, edge computing, and NFV deployments. Ericsson (Emerging Leader) is gaining visibility by providing end-to-end cloud solutions, supporting 5G and virtualized network functions, forming strategic partnerships with operators, and delivering scalable, interoperable, and secure network infrastructure.
Source: Secondary Research, Interviews with Experts, MarketsandMarkets Analysis
KEY MARKET PLAYERS
MARKET SCOPE
| REPORT METRIC | DETAILS |
|---|---|
| Market Size in 2025 (Value) | USD 22.26 Billion |
| Market Forecast in 2030 (Value) | USD 56.01 Billion |
| Growth Rate | CAGR of 20.3% from 2025-2030 |
| Years Considered | 2020-2030 |
| Base Year | 2024 |
| Forecast Period | 2025-2030 |
| Units Considered | Value (USD Million/Billion) |
| Report Coverage | Revenue Forecast, Company Ranking, Competitive Landscape, Growth Factors, and Trends. |
| Segments Covered |
|
| Regions Covered | North America, Europe, Asia Pacific, South America, Middle East & Africa |
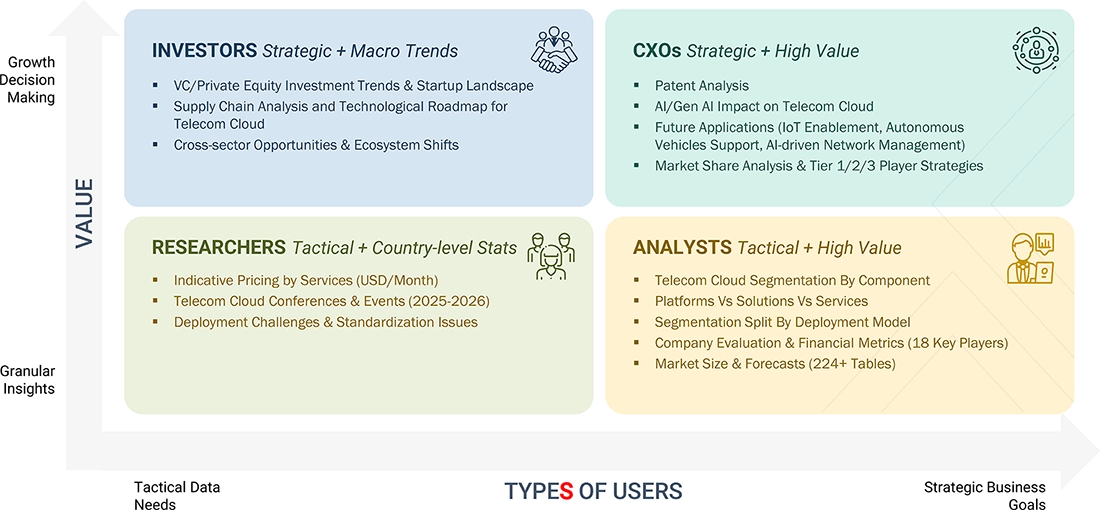
WHAT IS IN IT FOR YOU: Telecom Cloud Market REPORT CONTENT GUIDE
DELIVERED CUSTOMIZATIONS
We have successfully delivered the following deep-dive customizations:
| CLIENT REQUEST | CUSTOMIZATION DELIVERED | VALUE ADDS |
|---|---|---|
| Leading Telecom operator from Middle East |
|
|
RECENT DEVELOPMENTS
- May 2025 : Bouygues Telecom renewed its partnership with Broadcom to accelerate its IT transformation and scale up its private cloud. Bouygues will leverage Broadcom’s VMware Telco Cloud Platform and virtualization stack to consolidate legacy systems and deploy a modern, cloud-native infrastructure. The collaboration includes enhanced orchestration, automated lifecycle management for network functions, and integrated security controls. By adopting Broadcom’s carrier-grade virtualization solutions, Bouygues Telecom aims to improve network reliability, reduce total cost of ownership, and rapidly introduce new services such as edge computing and IoT connectivity.
- May 2025 : IBM and Oracle expanded their partnership to advance agentic AI and hybrid cloud solutions tailored for telecom operators. The joint initiative integrates IBM Cloud Pak platforms with Oracle Cloud Infrastructure, combining IBM’s AI and automation toolkits with Oracle’s high-performance compute and network services. This collaboration enables carriers to build cloud-native network functions, orchestrate AI-driven workflows, and maintain data sovereignty across hybrid deployments. Telecom providers benefit from unified management, end-to-end security, and accelerated development of intelligent network services that drive operational efficiency and enhanced subscriber experiences.
- April 2025 : Deutsche Telekom deepened its strategic partnership with Google Cloud through 2030 to drive enterprise cloudification and AI initiatives. Under the extended agreement, Deutsche Telekom will migrate critical SAP, AI, IT, and network functions to Google Distributed Cloud and Anthos, fostering a hybrid, multi-cloud telecom environment. This collaboration enables real-time data analytics, automated network management, and rapid rollout of new digital services. Leveraging Google Cloud’s secure infrastructure and AI-first capabilities, Deutsche Telekom aims to enhance customer experiences, accelerate innovation cycles, and optimize operational costs across its service portfolio.
- March 2025 : Ericsson and Econet strengthened their alliance with a core network upgrade deal unveiled at Mobile World Congress Barcelona. Ericsson will deploy its cloud-native 5G core solutions alongside Econet’s existing network, enabling seamless evolution to standalone 5G services. The deal includes advanced orchestration, AI-based network optimization, and integrated security features. This partnership positions Econet to deliver ultra-low-latency applications, high-capacity mobile broadband, and differentiated enterprise services, while Ericsson reinforces its leadership in scalable, software-defined telecom architectures.
- September 2024 : Vodafone Qatar signed a five-year partnership with Microsoft to accelerate its digital and cloud transformation. This collaboration integrates Vodafone Qatar’s telecom infrastructure with Microsoft Azure’s cloud services and generative AI capabilities. The agreement empowers the operator to deploy scalable, secure network workloads, streamline customer engagement through AI-driven insights, and support next-generation services such as private 5G and IoT. By leveraging Azure’s global footprint and advanced analytics, Vodafone Qatar will enhance operational efficiency, reduce time-to-market for new offerings, and deliver personalized experiences across its consumer and enterprise segments.
Table of Contents
 Exclusive indicates content/data unique to MarketsandMarkets and not available with any competitors.
Methodology
This research study involved extensive secondary sources, directories, and databases, such as Dun & Bradstreet (D&B) Hoovers and Bloomberg BusinessWeek, to identify and collect valuable information for a technical, market-oriented, and commercial study of the telecom cloud market. The primary sources have been mainly industry experts from the core and related industries, and preferred suppliers, manufacturers, distributors, service providers, technology developers, alliances, and organizations related to all segments of the value chain of this market. In-depth interviews were conducted with primary respondents, including key industry participants, subject matter experts, C-level executives of key market players, and industry consultants, to obtain and verify critical qualitative and quantitative information.
Secondary Research
In the secondary research process, various secondary sources were referred to identify and collect information for the study. The secondary sources included annual reports, press releases, investor presentations of companies, white papers, certified publications, and articles from recognized associations and government publishing sources. Several journals and associations were also referenced, including the Journal of Telecommunications and Information Technology, the Journal of Telecommunications and the Digital Economy, and the Journal of Cloud Computing: Advances, Systems, and Applications. Secondary research was used to obtain key information about industry insights, the market’s monetary chain, the overall pool of key players, market classification and segmentation according to industry trends to the bottom-most level, regional markets, and key developments from the market and technology-oriented perspectives.
Primary Research
In the primary research process, various primary sources from the supply and demand sides were interviewed to obtain qualitative and quantitative information for the report. The primary sources from the supply side included industry experts, such as Chief Executive Officers (CEOs), Chief Technology Officers (CTOs), Chief Operating Officers (COOs), Vice Presidents (VPs), marketing directors, technology and innovation directors, and related key executives from various key companies and organizations operating in the telecom cloud market. The primary sources from the demand side included telecom cloud end users, consultants/specialists, Chief Information Officers (CIOs), and subject-matter experts from enterprises and government associations.

Note: *Others include sales managers, marketing managers, and product managers.
Tier 1 companies’ revenue is more than USD 1 billion; Tier 2 companies’ revenue ranges between USD 500
million to 1 billion; and Tier 3 companies’ revenue ranges between USD 100 million and USD 500 million.
To know about the assumptions considered for the study, download the pdf brochure
Market Size Estimation
Multiple approaches were adopted to estimate and forecast the size of the telecom cloud market. The first approach involves estimating market size by summing up the revenue generated by companies through the sale of telecom cloud solutions.
The top-down and bottom-up approaches were used to estimate and validate the total size of the telecom cloud market. These methods were extensively used to estimate the size of various segments in the market. The research methodology used to estimate the market size includes the following:
- Key players in the market have been identified through extensive secondary research.
- In terms of value, the industry’s supply chain and market size have been determined through primary and secondary research processes.
- All percentage shares, splits, and breakups have been determined using secondary sources and verified through primary sources.
Telecom Cloud Market : Top-Down and Bottom-Up Approach

Data Triangulation
After determining the overall market size, the telecom cloud market was divided into several segments and subsegments. A data triangulation procedure was used to complete the overall market engineering process and determine the exact statistics for all segments and subsegments, wherever applicable. The data was triangulated by studying various factors and trends from the demand and supply sides. Along with data triangulation and market breakdown, the market size was validated by the top-down and bottom-up approaches.
Market Definition
Telecom cloud is a next-generation network architecture that combines software-defined networking, network functions virtualization, and cloud-native technology into a distributed computing network. Since the network and the computing resources are distributed across sites and clouds, automation and orchestration are required. It refers to the transformation of communications service providers (CSPs) using traditional infrastructure networks of vertically integrated proprietary hardware to digital service providers (DSPs) using cloud-based technologies.
A telecom cloud focuses on creating a common virtualized infrastructure to manage various network functions required to deliver communications services. It is a software-defined infrastructure that enables telcos to rapidly extend services, respond to a surge of innovations, and process and store data remotely in data centers. It is a keystone of the telecom industry's shift to digital service providers from CSPs.
Stakeholders
- Cloud Service Providers (CSPs)
- Networking Companies
- Third-party Providers
- Consultants/Consultancies/Advisory Firms
- Support and Maintenance Service Providers
- Telecom Service Providers
- Information Technology (IT) Infrastructure Providers
- System Integrators (SIs)
- Support Service Providers
- Governments And Standardization Bodies
- Data Center Providers
- Regional Associations
- Independent Software Vendors
- Value-added Resellers and Distributors
Report Objectives
- To determine and forecast the global telecom cloud market based on component (platform, solutions, services), deployment model (public cloud, private cloud, hybrid cloud), cloud service model (infrastructure as a service, platform as a service, software as a service), and NFV Software (VNFs/CNFs, NFVI) from 2025 to 2030, and analyze the various macroeconomic and microeconomic factors that affect the market growth
- To forecast the size of the market segments concerning five central regions: North America, Europe, Asia Pacific (APAC), Latin America, and the Middle East & Africa (MEA)
- To provide detailed information about the major factors (drivers, restraints, opportunities, and challenges) influencing the growth of the telecom cloud market
- Analyze each submarket concerning individual growth trends, prospects, and contributions to the overall telecom cloud market
- To analyze the opportunities in the market for stakeholders by identifying the high-growth segments of the telecom cloud market
- To profile the key market players, provide a comparative analysis based on business overviews, regional presence, product offerings, business strategies, and key financials, and illustrate the market’s competitive landscape.
- Track and analyze competitive developments in the market, such as mergers and acquisitions, product developments, partnerships and collaborations, and research and development (R&D) activities
Available Customizations
With the given market data, MarketsandMarkets offers customizations based on the company’s specific needs. The following customization options are available for the report:
Geographic Analysis as per Feasibility
- Analysis for additional countries (up to five)
Company Information
- Detailed analysis and profiling of additional market players (up to 5)
Key Questions Addressed by the Report
What is telecom cloud?
Telecom cloud is a next-generation network architecture that combines software-defined networking, network functions virtualization, and cloud-native technology into a distributed computing network. Since the network and the computing resources are distributed across sites and clouds, automation and orchestration are required. It refers to the transformation of communications service providers (CSPs) using traditional infrastructure networks of vertically integrated proprietary hardware to digital service providers (DSPs) using cloud-based technologies.
A telecom cloud creates a common virtualized infrastructure to manage various network functions required to deliver communications services. It is a software-defined infrastructure that enables telcos to rapidly extend services, respond to a surge of innovations, and process and store data remotely in data centers. It is a keystone of the telecom industry’s shift to digital service providers from CSPs.
What is the market size of the telecom cloud market?
The telecom cloud market is estimated at USD 22,261.8 million in 2025 and is expected to reach USD 56,005.8 million by 2030 at a compound annual growth rate (CAGR) of 20.3% from 2025 to 2030.
What are the major market drivers?
The telecom cloud market is primarily driven by the emergence of 5G standards and massive IoT deployments, which have dramatically increased demand for telecom cloud solutions by enabling advanced use cases such as enhanced Mobile Broadband (eMBB), massive Machine-Type Communications (mMTC), and Ultra-Reliable Low-Latency Communications (URLLC). As operators transition to cloud-native environments, they gain scalable architectures that enhance application deployment, orchestration, and lifecycle management. This shift drives growth in virtualized network functions and edge computing, supporting real-time analytics and AI-driven automation. In addition, telecom cloud adoption significantly reduces capital expenditures and operating expenses by replacing dedicated hardware with on-demand resources, fostering cost efficiency and operational agility.
Who are the key players operating in the telecom cloud market?
The key market players include AWS (US), Microsoft (US), IBM (US), Broadcom (US), Oracle (US), Intellias (Ukraine), Nokia (Finland), Ericsson (Sweden), Huawei (China), ZTE (China), Juniper (US), Cisco (US), Amdocs (US), Virtusa (US), Mavenir (US), ACL Digital (US), Alibaba Cloud (China), Robin.IO (US), NFWare (US), Telenity (Turkey), Inmanta (Belgium), and UK Cloud Communications (UK).
What are the key technological trends in the telecom cloud market?
Key technological trends are driving unprecedented agility, efficiency, and scalability across modern networks. Cloud native architectures built on microservices and container platforms, such as Kubernetes, enable rapid scaling, automated rollouts, and simplified upgrades for core and RAN functions. Edge computing deployments bring compute and storage closer to end users, cutting latency for mission-critical services such as autonomous vehicles, gaming, and augmented reality. Network function virtualization and software-defined networking decouple software from hardware, allowing operators to dynamically provision services, optimize traffic flows, and accelerate innovation.
Open RAN and disaggregation foster multi-vendor ecosystems by defining open interfaces and modular components, reducing costs and eliminating vendor lock-in. Artificial intelligence and automation power intent-based orchestration, fault detection, performance tuning, and capacity planning, minimizing manual intervention. Multi-cloud and hybrid cloud strategies balance cost, performance, and data sovereignty by spanning public, private, and on-premises environments under unified orchestration. Finally, network slicing creates virtual, isolated partitions to deliver tailored service-level agreements for diverse use cases, from massive IoT to ultra-low-latency applications, establishing the telecom cloud as the backbone of 5G and emerging digital services.
Need a Tailored Report?
Customize this report to your needs
Get 10% FREE Customization
Customize This ReportPersonalize This Research
- Triangulate with your Own Data
- Get Data as per your Format and Definition
- Gain a Deeper Dive on a Specific Application, Geography, Customer or Competitor
- Any level of Personalization
Let Us Help You
- What are the Known and Unknown Adjacencies Impacting the Telecom Cloud Market
- What will your New Revenue Sources be?
- Who will be your Top Customer; what will make them switch?
- Defend your Market Share or Win Competitors
- Get a Scorecard for Target Partners

Custom Market Research Services
We Will Customise The Research For You, In Case The Report Listed Above Does Not Meet With Your Requirements
Get 10% Free CustomisationTESTIMONIALS
Growth opportunities and latent adjacency in Telecom Cloud Market

Still Researching the
Telecom Cloud Ecosystem?
See the competitors, opportunity evaluation, and growth signals shaping it - Instantly!
Generate 15+ consulting-grade strategic intelligence outputs - from competitor analysis to board-ready strategy decks, tailored to your Telecom Cloud growth question.


YANG
Oct, 2017
Interested in cloud networking.
Guang
May, 2019
Interested in 5G cloud.