Synthetic Quartz Market by Type (Synthetic Quartz Crystal, Synthetic Quartz Glass), Application (Electronics & Electrical, Automotive, Construction), Region (North America, Europe, Asia Pacific, Middle East & Africa, South America) - Global Forecast to 2022


[121 Pages Report] Synthetic Quartz Market size was valued at USD 68.6 Million in 2016, and is projected to reach USD 95.0 Million by 2022, at a CAGR of 5.6% from 2017 to 2022. The market for synthetic quartz is largely driven by the growth of the electronics industry. In addition, the growing demand for smartphones and connected devices, increasing adoption of 4G and LTE networks, and rising demand for advanced electronic devices and equipment from the healthcare industry are fueling the market growth.
The objectives of this study are:
- To define, describe, and forecast the synthetic quartz market based on type, application, and region
- To strategically analyze micromarkets (further segments and subsegments of the synthetic quartz market included in the report) with respect to individual growth trends, prospects, and contribution to the total market
- To analyze opportunities in the synthetic quartz market for the stakeholders and draw a competitive landscape for market leaders
- To forecast size of the synthetic quartz market, in terms of value and volume with respect to five main regions, namely, North America, Europe, Asia Pacific, Middle East & Africa, and South America, along with their key countries
- To strategically profile key players operating in the synthetic quartz market and comprehensively analyze their core competencies
- To analyze competitive developments such as expansions, mergers & acquisitions, new product launches, and research & development (R&D) activities in the synthetic quartz market
Years considered for the study are:
- Base Year � 2016
- Estimated Year � 2017
- Projected Year � 2022
- Forecast Period � 2017 to 2022
For company profiles, 2016 was considered as the base year. In cases, wherein information was unavailable for the base year, the years prior to it were considered.
Research Methodology
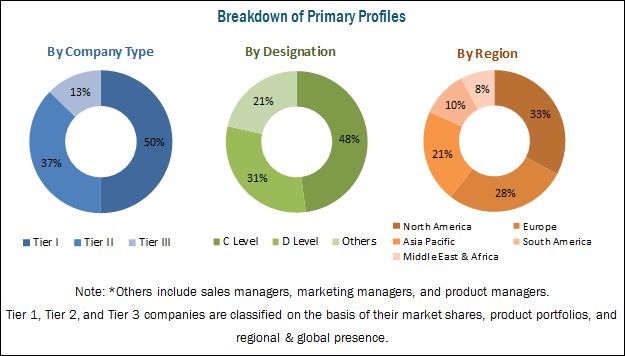
This study aims to estimate the size of the synthetic quartz market for 2017 and projects the demand for synthetic quartz till 2022. It also provides a detailed qualitative and quantitative analysis of the synthetic quartz market. Various secondary sources that include directories, industry journals, and various associations, such as, United States Geological Survey (USGS), and Institute of Electrical and Electronics Engineers (IEEE), were used to identify and collect information useful for this extensive commercial study of the synthetic quartz market. Primary sources such as experts from related industries and suppliers were interviewed to obtain and verify critical information as well as to assess prospects of the synthetic quartz market. The breakdown of profiles of primaries is covered in the figure below:
To know about the assumptions considered for the study, download the pdf brochure
The value chain of the synthetic quartz market includes raw material suppliers and service providers. The leading players operating in the synthetic quartz market include NIHON DEMPA KOGYO (Japan), Shin-Etsu (Japan), Seiko Epson (Japan), Murata Manufacturing (Japan), Kyocera (Japan), and TXC Corporation (Taiwan).
Key Target Audience
- Manufacturers, Dealers, and Suppliers of Synthetic Quartz
- Government Bodies
- End Users
- Feedstock Suppliers
- Industrial Associations
- Investment Banks
- Consulting Companies/Consultants in the Chemicals & Materials Sector
Scope of the Report: This research report categorizes the synthetic quartz market based on type, application, and region. The report forecasts revenue and analyzes trends in each of these submarkets.
Synthetic quartz Market, by Type:
- Synthetic Quartz Crystal
- Synthetic Quartz Glass
- Others
Synthetic quartz Market, by Application:
- Electronics & Electrical
- Automotive
- Construction
- Others
Synthetic quartz Market, by Region:
- Europe
- North America
- Asia Pacific
- Middle East & Africa
- South America
Available Customizations
Along with the market data, MarketsandMarkets offers customizations according to the specific needs of companies. The following customization options are available for the report:
- Application Analysis
- Further breakdown of the type and application segments into various subsegments
The synthetic quartz market is estimated at USD 72.4 Million in 2017 and is projected to reach USD 95.0 Million by 2022, at a CAGR of 5.6% from 2017 to 2022. Technological advancements in the consumer electronics industry across the globe, along with increased adoption of wireless technologies in automotive, defense, and several other industries are expected to fuel the growth of the synthetic quartz market during the forecast period.
Based on type, the synthetic quartz market has been segmented into synthetic quartz crystal, synthetic quartz glass, and others. The synthetic quartz crystal segment is projected to grow at the highest CAGR during the forecast period. Synthetic quartz crystals are mostly used in the electronics & electrical, and automotive industries, as these crystals are the ideal material for making frequency-controlled oscillators. Most wireless devices in the electronics and automotive industry use synthetic quartz crystal oscillators to generate a stable frequency. Moreover, synthetic quartz crystals are also used to manufacture synthetic rubies, emeralds, and sapphires for jewelry purposes.
Based on application, the synthetic quartz market has been classified into electronics & electrical, automotive, construction, and others. The electronics & electrical segment is projected to grow at the highest CAGR owing to high demand for consumer electronics devices from China, South Korea, India, and other emerging countries of the Asia Pacific region during the forecast period. Asia Pacific is also the largest producer and consumer of smartphones, laptops, TVs, and other consumer electronic devices in the world. This, coupled with the increasing demand for consumer electronics in the region, is expected to boost the Asia Pacific synthetic quartz market in the coming years.
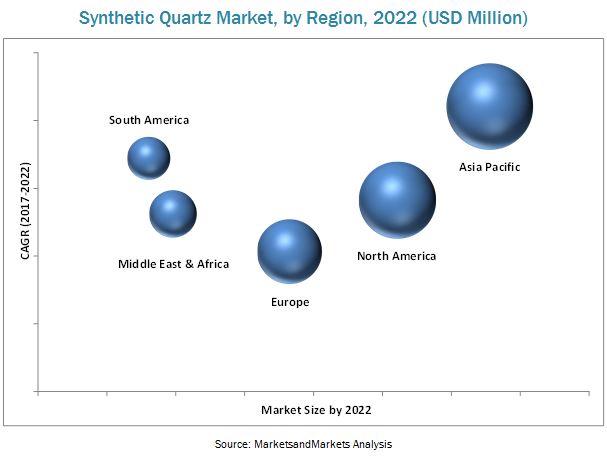
The synthetic quartz market in Asia Pacific is projected to grow at the highest CAGR during the forecast period, in terms of value. Rapid industrialization in the Asia Pacific region and increased demand for synthetic quartz from electronics and automotive industries are driving the growth of the synthetic quartz market in this region.
The key factors contributing to the increased demand for synthetic quartz across the globe include a rise in the adoption of wireless technologies for process optimization in most of the industries and the worldwide increase in disposable income of consumers that have resulted in the procurement of high-quality and advanced consumer electronics devices.
NIHON DEMPA KOGYO (Japan), Shin-Etsu (Japan), Seiko Epson (Japan), Murata Manufacturing (Japan), Kyocera (Japan), and TXC Corporation (Taiwan) are the key players operating in the synthetic quartz market.
To speak to our analyst for a discussion on the above findings, click Speak to Analyst
 Exclusive indicates content/data unique to MarketsandMarkets and not available with any competitors.
Table of Contents
1 Introduction (Page No. - 13)
1.1 Objectives of the Study
1.2 Market Definition
1.3 Market Scope
1.3.1 Years Considered for the Study
1.4 Currency
1.5 Limitations
1.6 Stakeholders
2 Research Methodology (Page No. - 16)
2.1 Research Data
2.1.1 Secondary Data
2.1.1.1 Key Data From Secondary Sources
2.1.2 Primary Data
2.1.2.1 Key Data From Primary Sources
2.1.2.2 Key Industry Insights
2.1.2.3 Breakdown of Primaries
2.2 Market Size Estimation
2.3 Data Triangulation
2.4 Research Assumptions
3 Executive Summary (Page No. - 24)
4 Premium Insights (Page No. - 27)
4.1 Synthetic Quartz Market, 2017 vs 2022
4.2 Synthetic Quartz Market, By Type
4.3 Synthetic Quartz Market, By Application
4.4 Synthetic Quartz Market, By Region
4.5 Asia Pacific Synthetic Quartz Market, 2017
5 Market Overview (Page No. - 30)
5.1 Introduction
5.2 Market Dynamics
5.2.1 Drivers
5.2.1.1 Growing Demand for Smartphones and Connected Devices
5.2.1.2 Increasing Adoption of 4G and LTE Networks
5.2.1.3 Rising Demand for Advanced Electronic Devices and Equipment From the Healthcare Industry
5.2.2 Restraints
5.2.2.1 Replacement of Synthetic Quartz Oscillators By High-End Silicon Oscillators
5.2.3 Opportunities
5.2.3.1 Increasing Adoption of Advanced Automotive Electronics
5.2.4 Challenges
5.2.4.1 Stability and Quality Issues in Low-Cost Synthetic Quartz
5.3 Porter�s Five Forces Analysis
5.3.1 Threat of New Entrants
5.3.2 Threat of Substitutes
5.3.3 Bargaining Power of Suppliers
5.3.4 Bargaining Power of Buyers
5.3.5 Intensity of Competitive Rivalry
6 Synthetic Quartz Market, By Type (Page No. - 37)
6.1 Introduction
6.2 Synthetic Quartz Crystal
6.3 Synthetic Quartz Glass
6.4 Others
7 Synthetic Quartz Market, By Application (Page No. - 42)
7.1 Introduction
7.2 Electronics & Electrical
7.3 Automotive
7.4 Construction
7.5 Others
8 Synthetic Quartz Market, By Region (Page No. - 48)
8.1 Introduction
8.2 North America
8.2.1 US
8.2.2 Canada
8.2.3 Mexico
8.3 Europe
8.3.1 Germany
8.3.2 France
8.3.3 UK
8.3.4 Italy
8.3.5 Russia
8.3.6 Rest of Europe
8.4 Asia Pacific
8.4.1 China
8.4.2 Japan
8.4.3 South Korea
8.4.4 Taiwan
8.4.5 India
8.4.6 Rest of Asia Pacific
8.5 the Middle East & Africa
8.5.1 the UAE
8.5.2 Saudi Arabia
8.5.3 Iran
8.5.4 Qatar
8.5.5 Kuwait
8.5.6 South Africa
8.5.7 Rest of Middle East & Africa
8.6 South America
8.6.1 Brazil
8.6.2 Argentina
8.6.3 Chile
8.6.4 Rest of South America
9 Company Landscape (Page No. - 86)
9.1 Market Ranking
10 Company Profiles (Page No. - 87)
Business Overview, Products Offered, Strength Of Product Portfolio, Business Strategy Excellence, Recent Developments
10.1 Murata Manufacturing
10.2 TXC Corporation
10.3 Shin-Etsu Chemical
10.4 Nihon Dempa Kogyo
10.5 Coorstek
10.6 Seiko Epson
10.7 Asahi Glass
10.8 Siward Crystal Technology
10.9 Kyocera
10.10 Heraeus Holding
10.11 Tydex
10.12 Other Key Players in the Synthetic Quartz Market
10.12.1 Universal Quartz
10.12.2 Yuzhnouralsk Plant �Kristall�
10.12.3 Suntsu Frequency Control
10.12.4 Daishinku Corporation (KDS)
10.12.5 Tosoh Corporation
10.12.6 Impex Hightech
10.12.7 IQD Frequency Products
10.12.8 Donghai County Jinglei Quartz Products Co. Ltd.
10.12.9 Shushen Industries Corporation
10.12.10 Hubei Feilihua Quartz Glass Co.
10.12.11 HTL Industries Sdn Bhd
10.12.12 WUXI Labcells Technology Co., Ltd.
10.12.13 Quality Quartz Engineering
10.12.14 SGX Minerals
10.12.15 TXC Corporation
*Details Might Not Be Captured in Case of Unlisted Companies.
11 Appendix (Page No. - 115)
11.1 Discussion Guide
11.2 Knowledge Store: Marketsandmarkets Subscription Portal
11.3 Introducing RT: Real-Time Market Intelligence
11.4 Available Customizations
11.5 Related Reports
11.6 Author Details
List of Tables (103 Tables)
Table 1 Synthetic Quartz Market, By Type, 2015-2022 (USD Million)
Table 2 By Market, By Type, 2015-2022 (Tons)
Table 3 Synthetic Quartz Crystal Market, By Region, 2015-2022 (USD Million)
Table 4 Synthetic Quartz Crystal Market, By Region, 2015-2022 (Tons)
Table 5 Synthetic Quartz Glass Market, By Region, 2015-2022 (USD Million)
Table 6 Synthetic Quartz Glass Market, By Region, 2015-2022 (Tons)
Table 7 Other Synthetic Quartz Market, By Region, 2015-2022 (USD Million)
Table 8 Other Synthetic Quartz Market, By Region, 2015-2022 (Tons)
Table 9 Synthetic Quartz Market, By Application, 2015-2022 (USD Million)
Table 10 By Market, By Application, 2015-2022 (Tons)
Table 11 By Market for Electronics & Electrical Application, By Region, 2015-2022 (USD Million)
Table 12 By Market for Electronics & Electrical Application, By Region, 2015-2022 (Tons)
Table 13 By Market for Automotive Application, By Region, 2015-2022 (USD Million)
Table 14 By Market for Automotive Application, By Region, 2015-2022 (Tons)
Table 15 By Market for Construction Application, By Region, 2015-2022 (USD Million)
Table 16 By Market for Construction Application, By Region, 2015-2022 (Tons)
Table 17 By Market for Other Applications, By Region, 2015-2022 (USD Million)
Table 18 By Market for Other Applications, By Region, 2015-2022 (Tons)
Table 19 By Market, By Region, 2015-2022 (USD Million)
Table 20 By Market, By Region, 2015-2022 (Tons)
Table 21 North America: Synthetic Quartz Market, By Country, 2015-2022 (USD Million)
Table 22 North America: Synthetic Quartz Market, By Country, 2015-2022 (Tons)
Table 23 North America: By Market, By Type, 2015-2022 (USD Million)
Table 24 North America: By Market, By Type, 2015-2022 (Tons)
Table 25 North America: By Market, By Application, 2015-2022 (USD Million)
Table 26 North America: By Market, By Application, 2015-2022 (Tons)
Table 27 US: Synthetic Quartz Market, By Application, 2015-2022 (USD Million)
Table 28 US: By Market, By Application, 2015-2022 (Tons)
Table 29 Canada: Synthetic Quartz Market, By Application, 2015-2022 (USD Million)
Table 30 Canada: By Market, By Application, 2015-2022 (Tons)
Table 31 Mexico: Synthetic Quartz Market, By Application, 2015-2022 (USD Million)
Table 32 Mexico: By Market, By Application, 2015-2022 (Tons)
Table 33 Europe: Synthetic Quartz Market, By Country, 2015-2022 (USD Million)
Table 34 Europe: By Market, By Country, 2015-2022 (Tons)
Table 35 Europe: By Market, By Type, 2015-2022 (USD Million)
Table 36 Europe: By Market, By Type, 2015-2022 (Tons)
Table 37 Europe: By Market, By Application, 2015-2022 (USD Million)
Table 38 Europe: By Market, By Application, 2015-2022 (Tons)
Table 39 Germany: Synthetic Quartz Market, By Application, 2015-2022 (USD Million)
Table 40 Germany: By Market, By Application, 2015-2022 (Tons)
Table 41 France: Synthetic Quartz Market, By Application, 2015-2022 (USD Million)
Table 42 France: By Market, By Application, 2015-2022 (Tons)
Table 43 UK: Synthetic Quartz Market, By Application, 2015-2022 (USD Million)
Table 44 UK: By Market, By Application, 2015-2022 (Tons)
Table 45 Italy: Synthetic Quartz Market, By Application, 2015-2022 (USD Million)
Table 46 Italy: By Market, By Application, 2015-2022 (Tons)
Table 47 Russia: Synthetic Quartz Market, By Application, 2015-2022 (USD Million)
Table 48 Russia: By Market, By Application, 2015-2022 (Tons)
Table 49 Rest of Europe: Synthetic Quartz Market, By Application, 2015-2022 (USD Million)
Table 50 Rest of Europe: By Market, By Application, 2015-2022 (Tons)
Table 51 Asia Pacific: Synthetic Quartz Market, By Country, 2015-2022 (USD Million)
Table 52 Asia Pacific: By Market, By Country, 2015-2022 (Tons)
Table 53 Asia Pacific: By Market, By Type, 2015-2022 (USD Million)
Table 54 Asia Pacific: By Market, By Type, 2015-2022 (Tons)
Table 55 Asia Pacific: By Market, By Application, 2015-2022 (USD Million)
Table 56 Asia Pacific: By Market, By Application, 2015-2022 (Tons)
Table 57 China: Synthetic Quartz Market, By Application, 2015-2022 (USD Million)
Table 58 China: By Market, By Application, 2015-2022 (Tons)
Table 59 Japan: Synthetic Quartz Market, By Application, 2015-2022 (USD Million)
Table 60 Japan: By Market, By Application, 2015-2022 (Tons)
Table 61 South Korea: Synthetic Quartz Market, By Application, 2015-2022 (USD Million)
Table 62 South Korea: By Market, By Application, 2015-2022 (Tons)
Table 63 Taiwan: Synthetic Quartz Market, By Application, 2015-2022 (USD Million)
Table 64 Taiwan: By Market, By Application, 2015-2022 (Tons)
Table 65 India: Synthetic Quartz Market, By Application, 2015-2022 (USD Million)
Table 66 India: By Market, By Application, 2015-2022 (Tons)
Table 67 Rest of Asia Pacific: By Market, By Application, 2015-2022 (USD Million)
Table 68 Rest of Asia Pacific: By Market, By Application, 2015-2022 (Tons)
Table 69 The Middle East & Africa: Synthetic Quartz Market, By Country, 2015-2022 (USD Million)
Table 70 The Middle East & Africa: By Market, By Country, 2015-2022 (Tons)
Table 71 The Middle East & Africa: By Market, By Type, 2015-2022 (USD Million)
Table 72 Middle East & Africa: By Market, By Type, 2015-2022 (Tons)
Table 73 The Middle East & Africa: By Market, By Application, 2015-2022 (USD Million)
Table 74 The Middle East & Africa: By Market, By Application, 2015-2022 (Tons)
Table 75 The UAE: By Market, By Application, 2015-2022 (USD Million)
Table 76 The UAE: By Market, By Application, 2015-2022 (Tons)
Table 77 Saudi Arabia: By Market, By Application, 2015-2022 (USD Million)
Table 78 Saudi Arabia: By Market, By Application, 2015-2022 (Tons)
Table 79 Iran: By Market, By Application, 2015-2022 (USD Million)
Table 80 Iran: By Market, By Application, 2015-2022 (Tons)
Table 81 Qatar: By Market, By Application, 2015-2022 (USD Million)
Table 82 Qatar: By Market, By Application, 2015-2022 (Tons)
Table 83 Kuwait: By Market, By Application, 2015-2022 (USD Million)
Table 84 Kuwait: By Market, By Application, 2015-2022 (Tons)
Table 85 South Africa: By Market, By Application, 2015-2022 (USD Million)
Table 86 South Africa: By Market, By Application, 2015-2022 (Tons)
Table 87 Rest of Middle East & Africa: By Market, By Application, 2015-2022 (USD Million)
Table 88 Rest of Middle East & Africa: By Market, By Application, 2015-2022 (Tons)
Table 89 South America: By Market, By Country, 2015-2022 (USD Million)
Table 90 South America: By Market, By Country, 2015-2022 (Tons)
Table 91 South America: By Market, By Type, 2015-2022 (USD Million)
Table 92 South America: By Market, By Type, 2015-2022 (Tons)
Table 93 South America: By Market, By Application, 2015-2022 (USD Million)
Table 94 South America: By Market, By Application, 2015-2022 (Tons)
Table 95 Brazil: By Market, By Application, 2015-2022 (USD Million)
Table 96 Brazil: By Market, By Application, 2015-2022 (Tons)
Table 97 Argentina: By Market, By Application, 2015-2022 (USD Million)
Table 98 Argentina: By Market, By Application, 2015-2022 (Tons)
Table 99 Chile: By Market, By Application, 2015-2022 (USD Million)
Table 100 Chile: By Market, By Application, 2015-2022 (Tons)
Table 101 Rest of South America: By Market, By Application, 2015-2022 (USD Million)
Table 102 Rest of South America: By Market, By Application, 2015-2022 (Tons)
Table 103 Market Ranking for Key Players, 2016
List of Figures (31 Figures)
Figure 1 Synthetic Quartz Market: Segmentation
Figure 2 Research Design
Figure 3 Bottom-Up Approach
Figure 4 Top-Down Approach
Figure 5 Synthetic Quartz Market: Data Triangulation
Figure 6 Electronics & Electrical Application Segment is Estimated to Account for the Largest Market Share in the Synthetic Quartz Market Between 2017 and 2022
Figure 7 Synthetic Quartz Crystal Type Segment is Estimated to Account for Largest Market Share in the Synthetic Quartz Market Between 2017 and 2022
Figure 8 The Asia Pacific Synthetic Quartz Market is Expected to Grow at the Highest CAGR Between 2017 and 2022
Figure 9 Attractive Growth Opportunities in the Synthetic Quartz Market
Figure 10 Synthetic Quartz Crystal is Expected to Be the Largest and Fastest Growing Synthetic Quartz Type During the Forecast Period, By Volume
Figure 11 Electronics & Electrical Application is Expected to Account for the Largest Share in the Synthetic Quartz Market Throughout the Forecast Period, By Volume
Figure 12 The Asia Pacific Synthetic Quartz Market is Expected to Grow at the Fastest Rate From 2017 to 2022, By Volume
Figure 13 China is Estimated to Account for the Largest Share of the Asia Pacific Synthetic Quartz Market in 2017, By Volume
Figure 14 Drivers, Restraints, Opportunities, and Challenges in the Synthetic Quartz Market
Figure 15 Porter�s Five Forces Analysis
Figure 16 Synthetic Quartz Market, By Type, 2017 vs 2022 (Tons)
Figure 17 Synthetic Quartz Market, By Application, 2017 vs 2022 (Tons)
Figure 18 China, South Korea, and India are Expected to Drive the Global Synthetic Quartz Market During the Forecast Period
Figure 19 North America Synthetic Quartz Market Snapshot
Figure 20 Europe Synthetic Quartz Market Snapshot
Figure 21 Asia Pacific Synthetic Quartz Market Snapshot
Figure 22 The Middle East & Africa Synthetic Quartz Market Snapshot
Figure 23 South America Synthetic Quartz Market Snapshot
Figure 24 Murata Manufacturing: Company Snapshot
Figure 25 TXC Corporation: Company Snapshot
Figure 26 Shin-Etsu Chemical: Company Snapshot
Figure 27 Nihon Dempa Kogyo: Company Snapshot
Figure 28 Seiko Epson: Company Snapshot
Figure 29 Asahi Glass: Company Snapshot
Figure 30 Siward Crystal Technology: Company Snapshot
Figure 31 Kyocera: Company Snapshot


Growth opportunities and latent adjacency in Synthetic Quartz Market