Swine (Pig) Feed Market by Type (Starter, Grower, Sow), Additive (Antibiotics, Vitamins, Antioxidants, Amino Acids, Feed Enzymes, Feed Acidifiers) and by Geography - Global Trends & Forecasts to 2018


Pigs are farmed in many countries, though the main consuming countries are in Asia. This is due to the significant international and even intercontinental trade in live and slaughtered pigs. Asia-Pacific was the largest consumer in the swine feed additives market in 2012, consuming 43% of the total market. Despite having the world's largest pig population, China is a net importer of pigs, and has been increasing its imports during its economic development. The largest exporters of pigs are the United States, the European Union, and Canada.
As a part of modern livestock management, feed additives play an important role in animal nutrition. They improve the characteristics of the feed to render health benefits by improving the digestibility and increasing the nutritional content and palatability of the feed. A variety of feed additives are blended with the feed in varying quantities, depending on the breed and growing phase as well as the surrounding environment, and its impact on them. For instance, the calcium content required for a starter pig is 0.8% whereas it is 0.6% in a finisher pig.
The growth in pork production has simultaneously helped the growth of the swine feed market, as feed cost is the major component, accounting for 70% to 80% of the total cost of pig meat production. Therefore, the price of feed ingredients has a substantial impact on the price of producing pork. Higher feed prices can quickly convert profits into losses.
Swine Feed Market Size, By Geography (Kt)
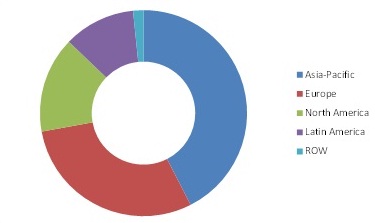
Source: MarketsandMarkets Analysis
This report provides a comprehensive review of swine additives feed consumed across various regions. A detailed analysis of the competitive landscape of key market players with their developments, mergers, acquisitions, expansions, and new product developments are furnished in this report. Quantitative data with regards to all the segmentations mentioned above is given in terms of both-revenue and volume. Furthermore, the different key market players within the swine feed market have been profiled in this report. It also includes details such as company overview, financial details, products, strategy, and recent developments.
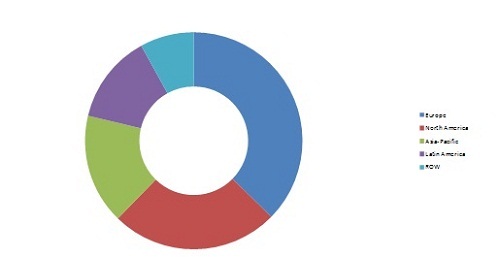
Swine Feed Additives Market Size, By Geography (Kt)
Source: MarketsandMarkets Analysis
The regions covered for the purpose of this report include North America (U.S., Canada, and Mexico), Europe (U.K., Germany, France, Italy, and Spain), Asia-Pacific (China, Japan, Vietnam, and India), Latin America (Brazil and Argentina), and the Rest of the World. The key players covered in this report are CHR. Hansen Holdings A/S (Denmark), Lallemand Inc. (Canada), Novus International Inc.(U.S), Royal DSM N.V. (The Netherlands), BASF (Badishce Anilin und Soda Fabrik) (Germany), Alltech Inc. (U.S), ADM (Archer Daniels Midland Company) (U.S), Charoen Popkhand Foods (Thailand), ABF Plc (Associated British Food) (U.K), and Cargill Inc. (U.S). The global swine feed additives market is expected to grow at a CAGR of 4.1% to attain a consumption volume of 14,318.9 KT by 2018.
Scope of the report
This report focuses on the global swine feed additives market and categorizes it into different segments based on geography, type, and additives:
Based on geography:
- North America
- Europe
- Asia-Pacific
- ROW
Based on type:
- Starters
- Growers
- Sow
- Others
Based on additives, by type:
- Antibiotics
- Vitamins
- Antioxidants
- Amino Acids
- Feed Enzymes
- Feed Acidifiers
- Others
Customization Options:
Product offering analysis:
- Descriptive product portfolio of top players of the swinefeed &feed additives market in different regions and countries, with product applications
- Detailed segment-wise and country-wise production capacity and revenue of top players of the market in different regions
Trade data:
- Analysis of swinefeed&feed additivesimported and exported annually in major regions and countries,tracked down at the sub-segment level (Sow, Grower, and Starter)
- A detailed analysis of the trade statistics (volume, sales, and prices) of pig/pork in the major regionson quarterly or yearly basis
Just in Time data:
- Daily updates in terms of price assessments and market analysis of the swinefeed &feed additives market, region-wise,which helps in making purchases and sales decisions
- Real-time data updates in terms of key developments in the major regions for the swinefeed &feed additives market
Related Commodity Market& Regulations:
- Data and statistics for related commodity markets such as cattle feed, poultry feed, and aquafeed can also be obtained on customization request
- A review of existing regulatory legislations in different countries of major regions such as North America, Europe, Asia-Pacific, and Latin Americacan be obtained
- Pig/Pork statistics in different countries of major regions such as North America, Europe, Asia-Pacific, Latin America can be made available
- Production &health management of swine-related data, for cost leadership strategies
- Organic pork production costs
- Ongoing government schemes and upcoming initiatives
Country Analysis
- Swine Feed Market, by Leading Nations
- Global Compound Feed Production Share, by Nations
- Annual Compound Feed Production in 15 leading countries of the World
- Global Swine Production, by Nations
Globally, the swine feed additives market is witnessing steady growth on account of increasing demand for high-quality pork, increased income of middle class population in developing nation and flexibility to use raw materials depending on availability. Also the increasing demand for swine feed has created a hike in demand for swine feed and the additives. The manufacturers of swine feed and additives are forced to expand their production capacities in order to fill the void between demand and supply. These positive attributes of the market products are viewed as excellent business opportunity in a steadily growing animal feeds market. This has attracted many multinational feed producing companies to make a foray into production and marketing of swine feed and additives market.
The Asia-Pacific swine feed additives market topped the consumption chart of the global industry, accounting for around 43.1% of the total share. And as far as the swine feed additives industry is concerned Europe was the dominant player with 37.3% of the total market share. The global market value for these products is expected to grow at a CAGR of 5.1% and 5.5% respectively by 2018, with the highest growth projected to be observed in the Asia-Pacific region for both the markets.
The increasing demand for swine feed has created a hike in demand for swine feed and swine feed additives. The manufacturers of swine feed and additives are forced to expand their production capacities in order to fill the void between demand and supply.
Swine Feed Additive Market Share (KT), By Geography, 2012
Source: MarketsandMarkets Analysis
The global swine feed additives market share was dominated by Europe. Increasing focus of various governments on feed cost reduction and boosting animal productivity are few of the key driver�s that pushed the market forward in this region. North America is the second largest market for the market. Asia-Pacific region, where China is becoming a key player on the global pig meat market Its high import requirement and rising disposable income, backed by the buoyant domestic demand and government support are the primary reasons for the particularly strong growth in this market.
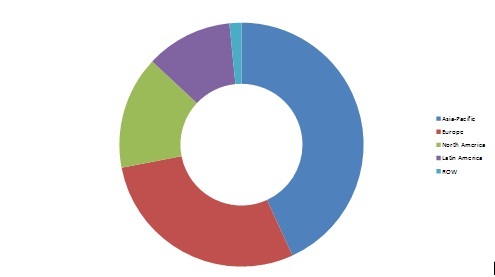
Swine Feed Market Share (KT), By Geography, 2012
Source: MarketsandMarkets Analysis
The global swine feed market was dominated by Asia-Pacific in 2012. It was followed by Europe. Here, the pig feed and feed additives market is advanced and highly regulated, especially in the western parts. The future of the market in Europe is expected to be favorable due to the increasing focus of various governments on reducing feed cost and increasing animal productivity. North America is the next most favorable market for swine feed. Here, huge demand for quality swine feed and additives and rising exports have helped push the market forward.
CHR. Hansen Holdings A/S (Denmark), Lallemand Inc (Canada), Novus International Inc.(U.S), Royal DSM N.V. (The Netherlands), BASF (Badishce Anilin und Soda Fabrik) (Germany), Alltech Inc. (U.S), ADM (Archer Daniels Midland Company) (U.S), Charoen Popkhand Foods (Thailand), ABF Plc (Associated British Food) (U.K), and Cargill Inc. (U.S) are some of the key players in the swine feed market and their recent development strategies have been studied in detail in this report.
 Exclusive indicates content/data unique to MarketsandMarkets and not available with any competitors.
Table Of Contents
1 Introduction (Page No. - 17)
1.1 Objectives
1.2 Report Description
1.3 Stakeholders
1.4 Research Methodology
1.4.1 Markets Covered
1.4.2 Market Size
1.4.3 Secondary Sources
1.4.4 Assumptions Made For The Report
1.4.5 Key Data Validated From Primary & Secondary Sources
1.4.6 Key Questions Answered
2 Executive Summary (Page No. - 24)
3 Market Overview (Page No. - 27)
3.1 Introduction
3.2 Global Swine Feed Market
3.2.1 Classification Of Swine Feed
3.2.1.1 Starter Feed
3.2.1.2 Pig Grower Feed
3.2.1.3 Sow Feed
3.2.1.4 Others
3.3 Global Swine Feed Additives Market
3.3.1 Different Types Of Feed Additives
3.3.1.1 Sensory Feed Additives
3.3.1.2 Nutritional Feed Additives
3.3.1.3 Zootechnical Feed Additives
3.4 Burning Issues
3.4.1 Regulatory Issues Related To Antibiotics
3.5 Winning Imperatives
3.5.1 Pork - A Cheaper Substitute For Beef & Poultry
3.6 Market Dynamics
3.6.1 Drivers
3.6.1.1 Substantial Growth In Pork Production
3.6.1.2 Increasing Concerns Related To Quality Of Pork Meat
3.6.2 Restraints
3.6.2.1 Outbreak Of Pathogenic Diseases
3.6.2.2 Volatility In Feed Prices
3.6.3 Opportunities
3.6.3.1 High Returns On Low Investments
3.7 Porter�s Five Forces Analysis
3.7.1 Bargaining Power Of Suppliers
3.7.2 Threat From Substitutes
3.7.3 Threat From New Entrants
3.7.4 Bargaining Power Of Buyers
3.7.5 Degree Of Competition
3.8 Supply Chain Analysis
3.9 Value Chain Analysis
3.10 Swine Feed And Additives Market Share Analysis
3.10.1 Swine Feed Additives Market
3.11 Swine Feed Market Share
3.11.1 Swine Feed Market
4 Premium Insights (Page No. - 46)
4.1 Market Segmentation
4.2 Asia-Pacific: The Prodigious Market
4.3 Pig Grower And Amino Acids � Most Preferred Type
4.4 Pig Grower And Amino Acids � Dominating Market Type Segment
4.5 Asia-Pacific: Market Life Cycle
4.6 China �The Frontrunner In Asia-Pacific Market
4.7 Pig Grower And Amino Acids: Market Dominating Segment In Asia-Pacific
5 Swine Feed Market, By Type (Page No. - 61)
5.1 Introduction
5.2 Starter Feed
5.3 Pig Grower Feed
5.4 Sow Feed
5.5 Others
6 Swine Feed Additives Market, By Type (Page No. - 78)
6.1 Introduction
6.2 Antibiotics
6.3 Vitamins
6.4 Antioxidants
6.5 Amino Acids
6.6 Feed Enzymes
6.7 Feed Acidifiers
6.8 Others
7 Swine Feed And Feed Additives Market, By Geography (Page No. - 103)
7.1 Introduction
7.2 North America
7.2.1 U.S.
7.2.2 Mexico
7.2.3 Canada
7.3 Europe
7.3.1 France
7.3.2 Germany
7.3.3 U.K.
7.3.4 Spain
7.3.5 Italy
7.3.6 Others
7.4 Asia-Pacific
7.4.1 China
7.4.2 Japan
7.4.3 Vietnam
7.4.4 Others
7.5 Latin America
7.5.1 Brazil
7.5.2 Argentina
7.5.3 Others
7.6 Row
8 Competitive Landscape (Page No. - 199)
8.1 Introduction
8.2 Investments & Expansions: Most Preferred Strategic Approach
8.3 Key Market Strategies
8.4 Acquisitions
8.5 Collaborations, Partnerships & Joint Ventures
8.6 New Product Launches
8.7 Investments & Expansions
9 Company Profiles (Company At A Glance, Recent Financials, Products & Services, Strategies & Insights, & Recent Developments)* (Page No. - 213)
9.1 Chr. Hansen Holdings A/S
9.2 Lallemand Inc
9.3 Novus International Inc.
9.4 Royal Dsm N.V.
9.5 BASF
9.6 Alltech Inc.
9.7 Archer Daniels Midland Company (ADM)
9.8 Charoen Popkh and Foods
9.9 ABF Plc
9.10 Cargill Inc.
*Details On Company At A Glance, Recent Financials, Products & Services, Strategies & Insights, & Recent Developments Might Not Be Captured In Case Of Unlisted Companies.
List Of Tables (132 Tables)
Table 1 Swine Feed Additives Market Size, By Type, 2011-2018 ($Million)
Table 2 Swine Feed Market Size, By Type, 2011-2018 (Kt)
Table 3 Ingredients Of Swine Starter Diets
Table 4 Starter: Swine Feed Additives Market Size, By Geography, 2011-2018 ($Million)
Table 5 Starter: Market Size, By Geography, 2011-2018 (Kt)
Table 6 Ingredients Of Pig Grower-Finisher Diets
Table 7 Pig Grower: Swine Feed Market Size, By Geography, 2011-2018 ($Million)
Table 8 Pig Grower: Market Size, By Geography, 2011-2018 (KT)
Table 9 Ingredients Of Sow Diets
Table 10 Sow: Swine Feed Market Size, By Geography, 2011-2018 ($Million)
Table 11 Sow: Market Size, By Geography, 2011-2018 (Kt)
Table 12 Others: Swine Feed Additives Market Size, By Geography, 2011-2018 ($Million)
Table 13 Others: Swine Feed Market Size, By Geography, 2011-2018 (Kt)
Table 14 Market Size, By Type, 2011-2018 ($Million)
Table 15 Market Size, By Type, 2011-2018 (KT)
Table 16 Antibiotics: Swine Feed Additives Market Size, By Geography, 2011-2018 ($Million)
Table 17 Antibiotics: Market Size, By Geography, 2011-2018 (KT)
Table 18 Vitamins: Swine Feed Additives Market Size, By Geography, 2011-2018 ($Million)
Table 19 Vitamins: Market Size, By Geography, 2011-2018 (KT)
Table 20 Antioxidants: Swine Feed Additives Market Size, By Geography, 2011-2018 ($Million)
Table 21 Antioxidants: Market Size, By Geography, 2011-2018 (KT)
Table 22 Amino Acids: Swine Feed Additives Market Size, By Geography, 2011-2018 ($Million)
Table 23 Amino Acids: Market Size, By Geography, 2011-2018 (KT)
Table 24 Feed Enzymes: Swine Feed Additives Market Size, By Geography, 2011-2018 ($Million)
Table 25 Feed Enzymes: Market Size, By Geography, 2011-2018 (KT)
Table 26 Feed Acidifiers: Swine Feed Additives Market Size, By Geography, 2011-2018 ($Million)
Table 27 Feed Acidifiers: Market Size, By Geography, 2011-2018 (KT)
Table 28 Mineral Requirements For Growing Pigs (90 Percent Dry Matter).
Table 29 Others: Swine Feed Additives Market Size, By Geography, 2011-2018 ($Million)
Table 30 Others: Market Size, By Geography, 2011-2018 (KT)
Table 31 Market Size, By Geography, 2011-2018 ($Million)
Table 32 Market Size, By Geography, 2011-2018 (KT)
Table 33 Market Size, By Geography, 2011-2018 ($Million)
Table 34 Market Size, By Geography, 2011-2018 (KT)
Table 35 North America: Market Size, By Country, 2011-2018 ($Million)
Table 36 North America: Market Size, By Country, 2011-2018 (KT)
Table 37 North America: Market Size, By Country, 2011-2018 ($Million)
Table 38 North America: Market Size, By Country, 2011-2018 (KT)
Table 39 U.S: Market Size, By Type, 2011-2018 ($Million)
Table 40 U.S.: Market Size, By Type, 2011-2018 (KT)
Table 41 U.S.: Market Size, By Type, 2011-2018 ($Million) Table 42 U.S.: Market Size, By Type, 2011-2018 (Kt)
Table 43 Mexico: Market Size, By Type, 2011-2018 ($Million)
Table 44 Mexico: Market Size, By Type, 2011-2018 (KT)
Table 45 Mexico: Swine Feed Additives Market Size, By Type, 2011-2018 ($Million)
Table 46 Mexico: Market Size, By Type, 2011-2018 (KT)
Table 47 Canada: Market Size, By Type, 2011-2018 ($Million)
Table 48 Canada: Market Size, By Type, 2011-2018 (KT)
Table 49 Canada: Market Size, By Type, 2011-2018 ($Million)
Table 50 Canada: Market Size, By Type, 2011-2018 (KT)
Table 51 Europe: Market Size, By Country, 2011-2018 ($Million)
Table 52 Europe: Market Size, By Country, 2011-2018 (KT)
Table 53 Europe: Swine Feed Additives Market Size, By Country, 2011-2018 ($Million)
Table 54 Europe: Market Size, By Country, 2011-2018 (KT)
Table 55 France: Market Size, By Type, 2011-2018 ($Million)
Table 56 France: Market Size, By Type, 2011-2018 (KT)
Table 57 France: Swine Feed Additive Market Size, By Type, 2011-2018 ($Million)
Table 58 France: Market Size, By Type, 2011-2018 (KT)
Table 59 Germany: Market Size, By Type, 2011-2018 ($Million)
Table 60 Germany: Market Size, By Type, 2011-2018 (KT)
Table 61 Germany: Market Size, By Type, 2011-2018 ($Million)
Table 62 Germany: Swine Feed Additves Market Size, By Type, 2011-2018 (KT)
Table 63 U.K: Market Size, By Type, 2011-2018 ($Million)
Table 64 U.K.: Market Size, By Type, 2011-2018 (KT)
Table 65 U.K.: Swine Feed Additives Market Size, By Type, 2011-2018 ($Million)
Table 66 U.K.: Market Size, By Type, 2011-2018 (KT)
Table 67 Spain: Market Size, By Type, 2011-2018 ($Million)
Table 68 Spain: Market Size, By Type, 2011-2018 (KT)
Table 69 Spain: Market Size, By Type, 2011-2018 ($Million)
Table 70 Spain: Market Size, By Type, 2011-2018 (KT)
Table 71 Italy: Market Size, By Type, 2011-2018 ($Million)
Table 72 Italy: Market Size, By Type, 2011-2018 (KT)
Table 73 Italy: Swine Feed Additives Market Size, By Type, 2011-2018 ($Million)
Table 74 Italy: Market Size, By Type, 2011-2018 (KT)
Table 75 Others: Market Size, By Type, 2011-2018 ($Million)
Table 76 Others: Market Size, By Type, 2011-2018 (KT)
Table 77 Others: Market Size, By Type, 2011-2018 ($Million)
Table 78 Others: Market Size, By Type, 2011-2018 (KT)
Table 79 Asia-Pacific: Market Size, By Country, 2011-2018 ($Million)
Table 80 Asia-Pacific: Market Size, By Country, 2011-2018 (KT)
Table 81 Asia-Pacific: Market Size, By Country, 2011-2018 ($Million)
Table 82 Asia-Pacific: Market Size, By Country, 2011-2018 (KT)
Table 83 China: Market Size, By Type, 2011-2018 ($Million)
Table 84 China: Market Size, By Type, 2011-2018 (KT)
Table 85 China: Swine Feed Additives Market Size, By Type, 2011-2018 ($Million)
Table 86 China: Market Size, By Type, 2011-2018 (KT)
Table 87 Japan: Market Size, By Type, 2011-2018 ($Million)
Table 88 Japan:Market Size, By Type, 2011-2018 (Kt)
Table 89 Japan: Market Size, By Type, 2011-2018 ($Million)
Table 90 Japan: Market Size, By Type, 2011-2018 (KT)
Table 91 Vietnam: Market Size, By Type, 2011-2018 ($Million)
Table 92 Vietnam: Market Size, By Type, 2011-2018 (KT)
Table 93 Vietnam: Market Size, By Type, 2011-2018 ($Million)
Table 94 Vietnam: Market Size, By Type, 2011-2018 (KT)
Table 95 Others: Market Size, By Type, 2011-2018 ($Million)
Table 96 Others: Market Size, By Type, 2011-2018 (KT)
Table 97 Others: Swine Feed Additives Market Size, By Type, 2011-2018 ($Million)
Table 98 Others: Market Size, By Type, 2011-2018 (KT)
Table 99 Latin America: Market Size, By Country, 2011-2018 ($Million)
Table 100 Latin America: Market Size, By Country, 2011-2018 (KT)
Table 101 Latin America: Swine Feed Additives Market Size, By Country, 2011-2018 ($Million)
Table 102 Latin America: Market Size, By Country, 2011-2018 (KT)
Table 103 Brazil: Market Size, By Type, 2011-2018 ($Million)
Table 104 Brazil: Market Size, By Type, 2011-2018 (KT)
Table 105 Brazil: Market Size, By Type, 2011-2018 ($Million)
Table 106 Brazil: Market Size, By Type, 2011-2018 (KT)
Table 107 Argentina: Market Size, By Type, 2011-2018 ($Million)
Table 108 Argentina: Market Size, By Type, 2011-2018 (KT)
Table 109 Argentina: Swine Feed Additives Market Size, By Type, 2011-2018 ($Million)
Table 110 Argentina: Market Size, By Type, 2011-2018 (KT)
Table 111 Others: Market Size, By Type, 2011-2018 ($Million)
Table 112 Others: Market Size, By Type, 2011-2018 (KT)
Table 113 Others:Market Size, By Type, 2011-2018 ($Million)
Table 114 Others: Market Size, By Type, 2011-2018 (KT)
Table 115 ROW: Market Size, By Type, 2011-2018 ($Million)
Table 116 ROW: Market Size, By Type, 2011-2018 (KT)
Table 117 ROW: Swine Feed Additives Market Size, By Type, 2011-2018 ($Million)
Table 118 ROW: Market Size, By Type, 2011-2018 (KT)
Table 119 Acquisitions, 2009�2013
Table 120 Collaborations, Partnerships & Joint Ventures, 2009-2013
Table 121 New Product Launches 2009�2013
Table 122 Investments & Expansions 2009�2013
Table 123 Chr. Hansen: Product & Its Description
Table 124 Lallemand Inc.: Products & Their Description
Table 125 Novus: Products & Their Description
Table 126 Royal DSM: Products & Their Description
Table 127 BASF: Products & Their Description
Table 128 Alltech: Products & Their Description
Table 129 ADM: Products & Their Description
Table 130 CP Charoen Popkh and Foods: Products & Their Description
Table 131 ABF: Products & Their Description
Table 132 Cargill: Products & Their Description
List Of Figures (34 Figures)
Figure 1 Swine Feed Market Size, By Geography, 2012 ($Million)
Figure 2 Swine Feed Additives Market Size, By Geography, 2012 ($Million)
Figure 3 Impact Of Drivers On Swine Feed And Swine Feed Additives Market
Figure 4 Porter�s Five Forces Analysis
Figure 5 Supply Chain Analysis
Figure 6 Value Chain Analysis
Figure 7 Swine Feed Additives: Global Market Share Analysis, By Company, 2012
Figure 8 Swine Feed: Market Share Analysis, By Company, 2012
Figure 9 Pork Feed Market Segmentation
Figure 10 Pork Feed Additives Market Segmentation
Figure 11 Pork Feed Market Size, By Geography, 2012-2018 ($Million)
Figure 12 Pork Feed Additives Market Size, By Geography, 2012-2018 ($Million)
Figure 13 Pork Feed Market Size, By Type, 2012-2018 (KT)
Figure 14 Pork Feed Additives Market Size, By Type, 2012-2018 (KT)
Figure 15 Pork Feed Market Size, By Type, By Geography, 2012 ($Million)
Figure 16 Pork Feed Additives Market Size, By Type, By Geography, 2012 ($Million)
Figure 17 Asia-Pacific: Market Life Cycle Of Pork Feed And Pork Feed Additives Market, By Country, 2012
Figure 18 Asia-Pacific: Pork Feed Market Size, By Country, 2012-2018 ($Million)
Figure 19 Asia-Pacific: Pork Feed Additives Market Size, By Country, 2012-2018 ($Million)
Figure 20 Asia-Pacific: Pork Feed Market Size, By Country, 2012-2018 (KT)
Figure 21 Asia-Pacific: Pork Feed Additives Market Size, By Country, 2012-2018 (KT)
Figure 22 Asia-Pacific: Pork Feed Market Size, By Type, 2012-2018 ($Million)
Figure 23 Asia-Pacific: Pork Feed Additives Market Size, By Type, 2012-2018 ($Million)
Figure 24 Swine Feed Additives By Type
Figure 25 Factors Affecting The Economical Viability Of The Swine Feed Industry
Figure 26 Swine Feed Additives Market Share (Volume), By Geography, 2012
Figure 27 Swine Feed & Feed Additives Market Developments Share By Growth Strategy, 2009�2013
Figure 28 Porkfeed & Feed Additives Market: Developments, 2009�2013
Figure 29 Swine Feed & Feed Additives Development Share, By Company, 2009-2013
Figure 30 DSM: SWOT Analysis
Figure 31 BASF: SWOT Analysis
Figure 32 ADM: SWOT Analysis
Figure 33 ABF: SWOT Analysis
Figure 34 Cargill: SWOT Analysis


Growth opportunities and latent adjacency in Swine (Pig) Feed Market