Sulfur Fertilizers Market by Type (Sulfates, Elemental Sulfur, Liquid Sulfur Fertilizers), Crop Type (Oilseeds & Pulses, Cereals & Grains, Fruits & Vegetables, Others), Mode of Application, Form, Cultivation Type, and Region - Global Forecast to 2025


Sulfur Fertilizers Market
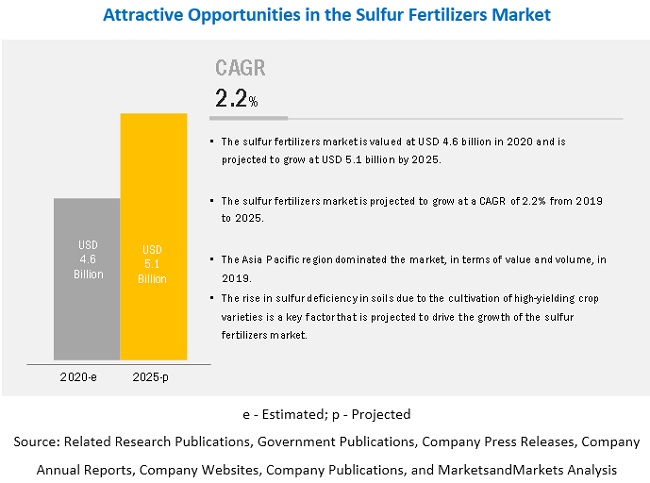
Global Sulfur Fertilizers Market is expected to grow at a CAGR of 2.2%
Market dynamics for sulfur fertilizers continue to evolve on the basis of key drivers and restraints. The growth of the sulfur fertilizers market is driven by the increasing sulfur deficiency in soil, intensive agricultural processes, growing demand for sulfur deficient crops such as canola, and increasing demand for higher agricultural productivity.The key drivers and restraints in sulfur fertilizers market are enlisted below.
Key drivers for sulfur fertilizers include:
- Increasing sulfur deficiency in soil
- Growth in demand for crops to result in sulfur deficiency
- Sulfur emission regulations driving demand for added sulfur
- High consumption of traditional sulfate fertilizers to drive the market growth
Restraints impeding the market include:
- Growing trend of consuming organic fertilizers to reduce the demand for sulfur fertilizers
A majority of the global oilseed production occurs in semi-arid tropical areas where the average yield is low. The oilseeds are drought-tolerant with low transpiration. Hence, crops in these regions suffer from sulfur deficiency due to insufficient supply. Soybean, canola, and groundnut are the major crops considered under this segment. The sulfur requirement in oilseeds is comparatively high than the other crops, and hence, it projected to dominate the sulfur fertilizers market during the forecast period. The leading crop segments are ranked below by their application.
- Oilseeds and pulses
- Cereals and grains
- Fruits and vegetables
- Other crop types
There are several types of sulfur fertilizers available for catering to sulfur deficiencies. It is important to understand the difference between the types of sulfur fertilizers and the major ones are enlisted below:
Types of sulfur fertilizers include:
- Sulfates
- Elemental sulfur
- Liquid sulfur fertilizers
The emergence of elemental sulfur enriched NPK fertilizers and the rise in investments in agricultural activities in developing countries are factors that provide growth opportunities for sulfur fertilizer manufacturers. The leading players in the sulfur fertilizers market are listed below.
Top players in sulfur fertilizers include:
- Nutrien Ltd.
- Yara International ASA
- The Mosaic Company
- ICL
- K+S Aktiengesellschaft
- Compass Minerals International
- Nufarm Ltd
- EuroChem Group
- Koch Industries
- Coromandel International limited
The sulfur fertilizer market includes certain progressive companies, which, though are in the initial stages of development, have done exceedingly well in terms of product portfolio and business strategy. The startups in the sulfur fertilizers market are listed below.
Top 10 Start-ups in agricultural micronutrients include:
- The Kugler Company
- Tiger-Sul Products LLC
- ATP Nutrition
- COMPO Expert Gmbh
- Nutri-tech Solutions
- Balchem
- Keg River Chemical corp
- Axter Agroscience
- Zuari Agrochemicals Limited
- OMEX Agriculture
[207 Pages Report] The global sulfur fertilizers market is estimated to be valued at USD 4.6 billion in 2020 and is projected to reach a value of USD 5.1 billion by 2025, recording a CAGR of 2.2% during the forecast period. Factors such as the increase in sulfur deficiencies in the soil and high consumption of traditional sulfate fertilizers are projected to drive the growth of the sulfur fertilizers market.
By crop type, the oilseeds & pulses segment is projected to be the fastest-growing in the sulfur fertilizers market during the forecast period.
A majority of the global oilseed production occurs in semi-arid tropical areas where the average yield is low. The oilseeds are drought-tolerant with low transpiration. Hence, crops in these regions suffer from sulfur deficiency due to insufficient supply. Soybean, canola, and groundnut are the major crops considered under this segment that utilize sulfur fertilizers. Sulfur is used as a plant nutrient for the synthesis of oil and the production of proteins. The sulfur requirement in oilseeds is comparatively higher than the other crops. Hence, it is projected to dominate the market during the forecast period.
By type, the sulfates segment is projected to dominate the global market during the forecast period.
In 2025, the sulfates segment is projected to dominate the global market in terms of value. This is due to the high consumption of traditional and new sulfate fertilizers, such as ammonium sulfate, single superphosphate, ammonium phosphate sulfate, potassium sulfate, and sulfates of micronutrients, across regions. In addition, the main advantage offered by sulfate fertilizers is its sulfur supply in the form of sulfate, which is readily available to plants.
By form, the dry segment is projected to be the fastest-growing in the sulfur fertilizers market during the forecast period.
The dry segment is projected to dominate the market due to its extended shelf life and relatively low cost. In addition, the consumption of the dry form of sulfur fertilizers, such as ammonium sulfate, single superphosphate, ammonium phosphate sulfate, and elemental sulfur, is high across the globe. These factors are projected to drive the growth of the market.
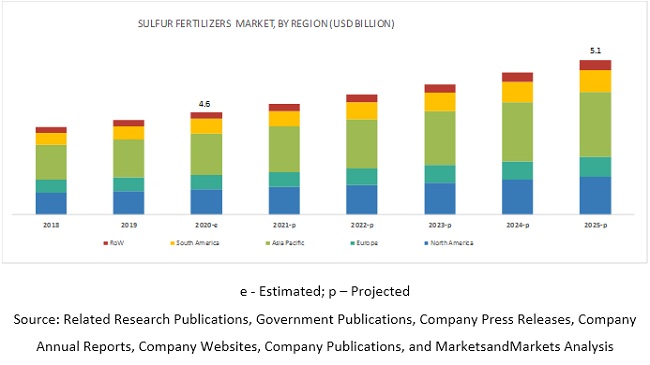
The high demand for various crops in the Asia Pacific regions is projected to drive the growth of the market.
The increase in agricultural practices and requirements for high-quality agricultural produce are factors that are projected to drive the growth of the market in the Asia Pacific region. According to the World Bank, nearly 56.2% and 60.4% of the entire land area accounted for agricultural production in China and India, respectively, in 2015. Major crops produced in Asia include rice, sugar beet, fruits & vegetables, cereals, and grains; the region consumes nearly 90% of the global rice produced. There is a high demand for sulfur fertilizers in Asia Pacific due to its direct use to treat sulfur deficiencies. They are often sprayed in combination or as additives to NPK products.
Key Market Players
Key players in this market include Nutrien, Ltd. (Canada), Yara International ASA (Norway), The Mosaic Company (US), ICL (Israel), and K+S Aktiengesellschaft (Germany). These players are focusing on increasing their presence through undertaking expansions & investments, mergers & acquisitions, partnerships, joint ventures, and agreements. They have a strong presence in North America, Asia Pacific, and Europe. In addition, they have their manufacturing facilities, along with strong distribution networks, in these regions.
Scope of the Sulfur Fertilizers Market Report
|
Report Metric |
Details |
|
Market size available for years |
2018-2025 |
|
Base year considered |
2018 |
|
Forecast period |
2020-2025 |
|
Forecast units |
Value (USD), Volume (KT) |
|
Segments covered |
Type, Crop Type, Form, Mode of Application, and Cultivation Type |
|
Geographies covered |
North America, Europe, Asia Pacific, South America, and ROW |
|
Companies covered |
Nutrien, Ltd. (Canada), Yara International ASA (Norway), The Mosaic Company (US), K+S (Germany), and ICL (Israel), EuroChem Group (Switzerland), Nufarm Limited (Australia), Koch Industries, Inc. (US), Compass Minerals (US), Deepak Fertilizers and Petrochemicals Ltd. (India), Coromandel International Limited (India), The Kugler Company (US), Sapec S.A. (Belgium), SQM S.A. (Chile), Balchem Inc. (US), Nutri-tech Solutions Pty Ltd. (Australia), Zuari Agro Chemicals Ltd. (India), Tessenderlo Kerley, Inc (Belgium), Tiger-Sul Products LLC (US), Shell Sulfur Solutions (Netherlands), and Sulphur Mills Ltd. (India) |
This research report categorizes the sulfur fertilizers market based on type, crop type, mode of application, form, cultivation type, and region.
On the basis of type, the market has been segmented as follows:
- Sulfates
- Elemental sulfur
- Liquid sulfur fertilizers
On the basis of crop type, the market has been segmented as follows:
- Cereals & grains
- Oilseeds & pulses
- Fruits & vegetables
- Others (Tea, sugarcane, coffee, forage crops, and turfs & ornamentals)
On the basis of form, the market has been segmented as follows:
- Dry
- Liquid
On the basis of mode of application, the market has been segmented as follows:
- Soil
- Foliar
- Fertigation
On the basis of cultivation type, the market has been segmented as follows:
- Open field
- Controlled-environment agriculture
On the basis of region, the market has been segmented as follows:
- North America
- Europe
- Asia Pacific
- South America
- Rest of World (ROW)*
*ROW includes South Africa, Turkey, and other countries in ROW.
Recent Developments:
- In March 2020, The Mosaic Company entered into an agreement with the Financial Technology Research Centre (FTRC) at the University of Adelaide in Australia to focus on enhanced fertilizer efficiency.
- In February 2020, ICL announced the acquisition of Growers Holdings Inc. (US), an innovator in the field of data-driven farming, which provides information on fertilization and on-field applications.
- In October 2019, K+S set up a new facility at the Wintershall site of the Werra plant (Germany) for the production of magnesium sulfate anhydrous, which enables it to expand its reach in Europe.
- In September 2019, Nutrien closed the acquisition of Ruralco Holdings Limited (Ruralco) in Australia, which would help the company to enhance the delivery of products and services to Australian farmers.
- In March 2018, The Mosaic Company launched its brand, MicroEssentials, which consist of crop nutrition formulations. The products offered by MicroEssentials are mainly used on corn, wheat, rice, soybeans, and other crops that require zinc.
- In January 2018, Nutrien announced the acquisition of Agrichem (Brazil), a leading specialty plant nutrition company. Through this acquisition, Nutrien expanded its distribution network in Brazil.
- In January 2018, Yara International signed an agreement to partner with the Veolia Group (France), which is a global leader in optimized resource management. The partnership will scale up nutrient recycling in the European food and agricultural chain.
Key questions addressed by the report:
- What are the factors that would drive the growth of the sulfur fertilizers market?
- Which are the major players in the market?
- How are the current R&D activities and M&As in the market projected to create a disrupting environment in the coming years?
- Which growth strategies are adopted by various key players to improve their position in the market?
- Which crops require more intensive application of sulfur fertilizers, and why?
To speak to our analyst for a discussion on the above findings, click Speak to Analyst
 Exclusive indicates content/data unique to MarketsandMarkets and not available with any competitors.
TABLE OF CONTENTS
1 INTRODUCTION (Page No. - 20)
1.1 OBJECTIVES OF THE STUDY
1.2 MARKET DEFINITION
1.3 STUDY SCOPE
1.3.1 REGIONAL SEGMENTATION
1.4 PERIODIZATION CONSIDERED
1.5 CURRENCY CONSIDERED
1.6 UNIT CONSIDERED
1.7 STAKEHOLDERS
2 RESEARCH METHODOLOGY (Page No. - 26)
2.1 RESEARCH DATA
2.1.1 SECONDARY DATA
2.1.1.1 Key Data from Secondary Sources
2.1.2 PRIMARY DATA
2.1.2.1 Key Data from Primary Sources
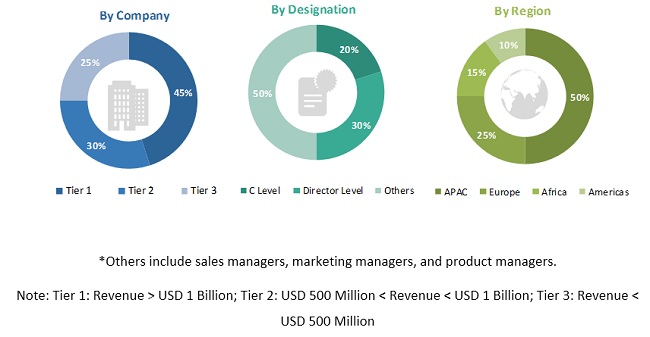
2.1.2.2 Breakdown of Primaries
2.2 MARKET SIZE ESTIMATION
2.2.1 BOTTOM-UP APPROACH
2.2.2 TOP-DOWN APPROACH
2.3 MARKET BREAKDOWN & DATA TRIANGULATION
2.4 RESEARCH ASSUMPTIONS & LIMITATIONS
2.4.1 ASSUMPTIONS
2.4.2 LIMITATIONS OF THE STUDY
3 EXECUTIVE SUMMARY (Page No. - 35)
4 PREMIUM INSIGHTS (Page No. - 39)
4.1 OPPORTUNITIES IN THE SULFUR FERTILIZERS MARKET
4.2 MARKET, BY FORM
4.3 ASIA PACIFIC: MARKET, BY TYPE AND KEY COUNTRY
4.4 MARKET, BY CROP TYPE AND REGION
4.5 KEY MARKETS AND COUNTRIES
5 MARKET OVERVIEW (Page No. - 44)
5.1 INTRODUCTION
5.2 MACRO INDICATORS
5.2.1 GROWING PRODUCTION OF HIGH-VALUE CROPS
5.2.2 LIMITED ARABLE LAND AROUND THE GLOBE
5.3 MARKET DYNAMICS
5.3.1 DRIVERS
5.3.1.1 Increase in sulfur deficiency in soils to drive the market growth
5.3.1.2 Increase in preference for high-quality crops
5.3.1.3 Strict regulations on sulfur emission regulations increases the demand for added sulfur
5.3.1.4 High consumption of traditional sulfate fertilizers to drive the market growth
5.3.2 RESTRAINTS
5.3.2.1 Growing trend of consuming organic fertilizers to reduce the demand for sulfur fertilizers
5.3.3 OPPORTUNITIES
5.3.3.1 Emergence of elemental sulfur enriched NPK fertilizers
5.3.3.2 Rise in investments in agricultural activities of developing countries to provide growth opportunities
5.3.4 CHALLENGES
5.3.4.1 Inconsistent raw material prices
5.3.4.2 Unfavorable regulatory effect of unfavorable regulatory stance across the supply chain
5.3.4.3 Environmental concerns
5.4 INDUSTRY TRENDS
5.5 SUPPLY CHAIN ANALYSIS
5.5.1 PROMINENT COMPANIES
5.5.2 SMALL & MEDIUM ENTERPRISES
5.5.3 END USERS
5.5.4 KEY INFLUENCERS
5.6 RAW MATERIAL ANALYSIS
5.6.1 MAJOR APPLICATION AREAS
5.6.2 PRICING ANALYSIS
5.6.3 SOURCING ANALYSIS
5.6.3.1 Major sulfur-producing countries
5.6.3.2 Sulfur sources
5.6.3.2.1 Mining
5.6.3.2.2 Oil & Natural Gas
5.6.3.3 Sulfur procurement process
5.7 TRADE ANALYSIS
5.7.1 LEADING SULFUR EXPORTERS
5.7.2 LEADING SULFUR IMPORTERS
5.8 PATENT ANALYSIS
6 SULFUR FERTILIZERS MARKET, BY TYPE (Page No. - 65)
6.1 INTRODUCTION
6.2 SULFATE FERTILIZERS
6.2.1 PREFERENCE FOR SULFATE FERTILIZERS REMAINS HIGH AS A READILY AVAILABLE SOURCE OF SULFUR FOR PLANT UPTAKE
6.2.1.1 Ammonium sulfate
6.2.1.2 Single superphosphate
6.2.1.3 Ammonium phosphate sulfate
6.2.1.4 Potassium magnesium sulfate
6.2.1.5 Potassium sulfate
6.2.1.6 Sulfates of micronutrient
6.2.1.6.1 Iron
6.2.1.6.2 Copper
6.2.1.6.3 Manganese
6.2.1.6.4 Zinc
6.2.1.7 Others
6.3 ELEMENTAL SULFUR FERTILIZERS
6.3.1 LOW RISK OF LEACHING LOSS TO DRIVE THE MARKET FOR ELEMENTAL SULFUR FERTILIZERS
6.3.1.1 Elemental sulfur
6.3.1.2 Sulfur bentonite
6.3.1.3 Others
6.4 LIQUID SULFUR FERTILIZERS
6.4.1 HIGH SOLUBILITY AND COMPATIBILITY WITH VARIOUS FERTILIZERS TO ENCOURAGE THE ADOPTION OF LIQUID SULFUR FERTILIZERS
6.4.1.1 Ammonium thiosulfate
6.4.1.2 Potassium thiosulfate
6.4.1.3 Other liquid sulfur fertilizers
7 SULFUR FERTILIZERS MARKET, BY CROP TYPE (Page No. - 78)
7.1 INTRODUCTION
7.2 CEREALS & GRAINS
7.2.1 SULFUR DEFICIENCY IN MAJOR STAPLE CROPS TO DRIVE THE GROWTH OF THE MARKET
7.2.1.1 Corn
7.2.1.2 Wheat
7.2.1.3 Rice
7.2.1.4 Other cereals & grains
7.3 OILSEEDS & PULSES
7.3.1 INCREASING PRODUCTION OF OILSEEDS AND PULSES TO DRIVE THE GROWTH OF THE MARKET
7.3.1.1 Soybean
7.3.1.2 Canola
7.3.1.3 Groundnut
7.3.1.4 Other oilseeds & pulses
7.4 FRUITS & VEGETABLES
7.4.1 HIGH EXPORT POTENTIAL OF FRUITS & VEGETABLES TO DRIVE THE GROWTH OF THE MARKET
7.4.1.1 Onion
7.4.1.2 Potatoes
7.4.1.3 Grapes
7.4.1.4 Other fruits & vegetables
7.5 OTHER CROP TYPES
7.5.1 SUGARCANE
7.5.2 TEA
7.5.3 COFFEE
7.5.4 TURF, FORAGE & ORNAMENTAL CROPS
8 SULFUR FERTILIZERS MARKET, BY MODE OF APPLICATION (Page No. - 89)
8.1 INTRODUCTION
8.2 SOIL
8.2.1 EASE OF USE TO ENCOURAGE THE APPLICATION OF SULFUR FERTILIZERS THROUGH SOIL
8.3 FOLIAR
8.3.1 LOWER RATE OF APPLICATION AND HIGHER EFFICACY TO DRIVE THE GROWTH OF THE FOLIAR SEGMENT
8.4 FERTIGATION
8.4.1 IMPROVED NUTRIENT EFFICIENCY TO DRIVE THE GROWTH OF THE FERTIGATION SEGMENT
9 SULFUR FERTILIZERS MARKET, BY FORM (Page No. - 94)
9.1 INTRODUCTION
9.2 LIQUID
9.2.1 IMPROVED NUTRIENT EFFICIENCY AND EASE OF APPLICATION TO DRIVE THE MARKET GROWTH FOR LIQUID SULFUR FERTILIZERS
9.3 DRY
9.3.1 EXTENDED SHELF LIFE AND LOW COST OF DRY SULFUR FERTILIZERS TO INCREASE THE USE OF DRY SULFUR FERTILIZERS
10 SULFUR FERTILIZERS MARKET, BY CULTIVATION TYPE (Page No. - 98)
10.1 INTRODUCTION
10.2 OPEN FIELD
10.2.1 INTENSIVE CROPPING PRACTICES TO PROMOTE THE USE OF SULFUR FERTILIZERS
10.3 CONTROLLED-ENVIRONMENT AGRICULTURE
10.3.1 APPLICATION OF MICRONIZED SULFUR WITH BENTONITE IN GREENHOUSE PRODUCTION OF VEGETABLES TO DRIVE THE MARKET GROWTH
11 SULFUR FERTILIZERS MARKET, BY REGION (Page No. - 101)
11.1 INTRODUCTION
11.1.1 IMPACT OF COVID-19 ON THE FERTILIZER INDUSTRY
11.2 NORTH AMERICA
11.2.1 US
11.2.1.1 Reduction in sulfur emission to encourage the need for the application of sulfur fertilizers
11.2.2 CANADA
11.2.2.1 Canola and alfalfa to witness increased application of sulfur fertilizers in Canada
11.2.3 MEXICO
11.2.3.1 Increasing awareness regarding sulfur deficient soil to drive the demand for sulfur fertilizers
11.3 EUROPE
11.3.1 FRANCE
11.3.1.1 Increase in exports of agriculture produce to drive the growth of the sulfur fertilizers market
11.3.2 GERMANY
11.3.2.1 Reduction in the natural availability of sulfur in soils to promote the use of sulfur fertilizers
11.3.3 SPAIN
11.3.3.1 Application of elemental sulfur for improved crop yield to drive the growth of the market
11.3.4 ITALY
11.3.4.1 High production of fruits & vegetables to increase the adoption of sulfur fertilizers
11.3.5 RUSSIA
11.3.5.1 Increase in the area under wheat and potato cultivation to promote the use of sulfur fertilizers
11.3.6 REST OF EUROPE
11.4 ASIA PACIFIC
11.4.1 CHINA
11.4.1.1 High sulfur deficiency in arable lands to drive the market growth for sulfur fertilizers
11.4.2 INDIA
11.4.2.1 Government initiatives for restoring sulfur in soils to drive the market growth for sulfur fertilizers
11.4.3 AUSTRALIA
11.4.3.1 Shift toward controlled-environment agriculture to promote the application of sulfur fertilizers
11.4.4 VIETNAM
11.4.4.1 Increase in sulfur leaching from soil to drive the market growth for sulfur fertilizers
11.4.5 REST OF ASIA PACIFIC
11.5 SOUTH AMERICA
11.5.1 BRAZIL
11.5.1.1 Demand for export of agricultural products to drive the market for sulfur fertilizers
11.5.2 ARGENTINA
11.5.2.1 Increase in awareness among farmers about the benefits of sulfur fertilizers to drive the growth of the market
11.5.3 REST OF SOUTH AMERICA
11.6 REST OF THE WORLD
11.6.1 SOUTH AFRICA
11.6.1.1 High crop production due to the increase in demand for food products to drive the growth of the sulfur fertilizers market
11.6.2 TURKEY
11.6.2.1 Increase in the area harvested for various crops to drive the demand for sulfur fertilizers
11.6.3 OTHERS IN ROW
12 COMPETITIVE LANDSCAPE (Page No. - 144)
12.1 OVERVIEW
12.2 MARKET SHARE ANALYSIS
12.3 COMPETITIVE LEADERSHIP MAPPING
12.3.1 DYNAMIC DIFFERENTIATORS
12.3.2 INNOVATORS
12.3.3 VISIONARY LEADERS
12.3.4 EMERGING COMPANIES
12.4 COMPETITIVE LEADERSHIP MAPPING (FOR TIER 2 COMPANIES)
12.4.1 PROGRESSIVE COMPANIES
12.4.2 STARTING BLOCKS
12.4.3 RESPONSIVE COMPANIES
12.4.4 DYNAMIC COMPANIES
12.5 COMPETITIVE SCENARIO
12.5.1 NEW PRODUCT LAUNCHES
12.5.2 EXPANSIONS & INVESTMENTS
12.5.3 MERGERS & ACQUISITIONS
12.5.4 AGREEMENTS, COLLABORATIONS & PARTNERSHIPS
13 COMPANY PROFILES (Page No. - 157)
(Business overview, Products offered, Recent Developments, SWOT analysis, Right to win)*
13.1 NUTRIEN LTD.
13.2 YARA INTERNATIONAL ASA
13.3 THE MOSAIC COMPANY
13.4 ICL
13.5 K+S AKTIENGESELLSCHAFT
13.6 NUFARM LIMITED
13.7 COROMANDEL INTERNATIONAL LTD
13.8 EUROCHEM GROUP
13.9 DEEPAK FERTILIZERS AND PETROCHEMICALS LTD.
13.10 KOCH INDUSTRIES, INC.
13.11 SAPEC S.A.
13.12 COMPASS MINERALS
13.13 THE KUGLER COMPANY
13.14 ZUARI AGROCHEMICALS LTD
13.15 SQM S.A.
13.16 BALCHEM INC.
13.17 SULPHUR MILLS LTD
13.18 NUTRI-TECH SOLUTIONS PTY LTD
13.19 TESSENDERLO KERLEY, INC.
13.20 TIGER-SUL PRODUCTS LLC
13.21 SHELL SULFUR SOLUTIONS
*Details on Business overview, Products offered, Recent Developments, SWOT analysis, Right to win might not be captured in case of unlisted companies.
14 APPENDIX (Page No. - 199)
14.1 DISCUSSION GUIDE
14.2 KNOWLEDGE STORE: MARKETSANDMARKETS’ SUBSCRIPTION PORTAL
14.3 AVAILABLE CUSTOMIZATIONS
14.4 RELATED REPORTS
14.5 AUTHOR DETAILS
LIST OF TABLES (118 TABLES)
TABLE 1 INCLUSIONS AND EXCLUSIONS PERTAINING TO THE SULFUR FERTILIZERS MARKET
TABLE 2 USD EXCHANGE RATES, 2016–2019
TABLE 3 AVERAGE CROP RESPONSES TO SULFUR APPLICATION UNDER FIELD CONDITIONS
TABLE 4 LIST OF SULFUR FERTILIZER PATENTS, 2015-2020
TABLE 5 MARKET SIZE, BY TYPE, 2018–2025 (USD MILLION)
TABLE 6 MARKET SIZE, BY TYPE, 2018–2025 (KT)
TABLE 7 SULFATE FERTILIZERS MARKET SIZE, BY REGION, 2018–2025 (USD MILLION)
TABLE 8 SULFATE FERTILIZERS MARKET SIZE, BY REGION, 2018–2025 (KT)
TABLE 9 SULFATE FERTILIZERS MARKET SIZE, BY SUBTYPE, 2018–2025 (USD MILLION)
TABLE 10 SULFATE FERTILIZERS MARKET SIZE, BY SUBTYPE, 2018–2025 (KT)
TABLE 11 SULFATES OF MICRONUTRIENT MARKET SIZE, BY SUBTYPE, 2018–2025 (USD MILLION)
TABLE 12 MICRONUTRIENT SULFATE MARKET SIZE, BY SUBTYPE, 2018–2025 (KT)
TABLE 13 ELEMENTAL SULFUR FERTILIZERS: MARKET SIZE, BY REGION, 2018–2025 (USD MILLION)
TABLE 14 ELEMENTAL SULFUR FERTILIZERS: MARKET SIZE, BY REGION, 2018–2025 (KT)
TABLE 15 ELEMENTAL SULFUR FERTILIZERS MARKET SIZE, BY SUBTYPE, 2018–2025 (USD MILLION)
TABLE 16 ELEMENTAL SULFUR FERTILIZERS: MARKET SIZE, BY SUBTYPE, 2018–2025 (KT)
TABLE 17 LIQUID SULFUR FERTILIZERS: MARKET SIZE, BY REGION, 2018–2025 (USD MILLION)
TABLE 18 LIQUID SULFUR FERTILIZERS: MARKET SIZE, BY REGION, 2018–2025 (KT)
TABLE 19 LIQUID SULFUR FERTILIZERS: MARKET SIZE, BY SUBTYPE, 2018–2025 (USD MILLION)
TABLE 20 LIQUID SULFUR FERTILIZERS: MARKET SIZE, BY SUBTYPE, 2018–2025 (KT)
TABLE 21 SULFUR FERTILIZERS: MARKET SIZE, BY CROP TYPE, 2018–2025 (USD MILLION)
TABLE 22 SULFUR FERTILIZERS: MARKET SIZE FOR CEREALS & GRAINS, BY REGION, 2018–2025 (USD MILLION)
TABLE 23 SULFUR FERTILIZERS: MARKET SIZE FOR CEREALS & GRAINS, BY CROP, 2018–2025 (USD MILLION)
TABLE 24 OILSEEDS & PULSES: SULFUR FERTILIZERS: MARKET SIZE, BY REGION, 2018–2025 (USD MILLION)
TABLE 25 MARKET SIZE FOR OILSEEDS & PULSES, BY CROP, 2018–2025 (USD MILLION)
TABLE 26 MARKET SIZE FOR FRUITS & VEGETABLES, BY REGION, 2018–2025 (USD MILLION)
TABLE 27 MARKET SIZE FOR FRUITS & VEGETABLES, BY CROP, 2018–2025 (USD MILLION)
TABLE 28 MARKET SIZE FOR OTHER CROP TYPES, BY REGION, 2018–2025 (USD MILLION)
TABLE 29 MARKET SIZE FOR OTHER CROP TYPES, BY CROP, 2018–2025 (USD MILLION)
TABLE 30 MARKET SIZE, BY MODE OF APPLICATION, 2018–2025 (USD MILLION)
TABLE 31 MARKET SIZE FOR SOIL, BY REGION, 2018–2025 (USD MILLION)
TABLE 32 MARKET SIZE FOR FOLIAR, BY REGION, 2018–2025 (USD MILLION)
TABLE 33 MARKET SIZE FOR FERTIGATION, BY REGION, 2018–2025 (USD MILLION)
TABLE 34 MARKET SIZE, BY FORM, 2018–2025 (USD MILLION)
TABLE 35 LIQUID SULFUR FERTILIZERS: MARKET SIZE, BY REGION, 2018–2025 (USD MILLION)
TABLE 36 DRY SULFUR FERTILIZERS: MARKET SIZE, BY REGION, 2018–2025 (USD MILLION)
TABLE 37 SULFUR FERTILIZERS MARKET SIZE, BY CULTIVATION TYPE , 2018–2025 (USD MILLION)
TABLE 38 MARKET SIZE, BY REGION, 2018–2025 (USD MILLION)
TABLE 39 MARKET SIZE, BY REGION, 2018–2025 (KT)
TABLE 40 NORTH AMERICA: MARKET SIZE, BY COUNTRY, 2018–2025 (USD MILLION)
TABLE 41 NORTH AMERICA: MARKET SIZE, BY COUNTRY, 2018–2025 (KT)
TABLE 42 NORTH AMERICA: MARKET SIZE, BY TYPE, 2018–2025 (USD MILLION)
TABLE 43 NORTH AMERICA: MARKET SIZE, BY TYPE, 2018–2025 (KT)
TABLE 44 NORTH AMERICA: MARKET SIZE, BY CROP TYPE, 2018–2025 (USD MILLION)
TABLE 45 NORTH AMERICA: MARKET SIZE, BY FORM, 2018–2025 (USD MILLION)
TABLE 46 NORTH AMERICA: MARKET SIZE, BY MODE OF APPLICATION, 2018–2025 (USD MILLION)
TABLE 47 US: MARKET SIZE, BY TYPE, 2018–2025 (USD MILLION)
TABLE 48 US: MARKET SIZE, BY TYPE, 2018–2025 (KT)
TABLE 49 CANADA: MARKET SIZE, BY TYPE, 2018–2025 (USD MILLION)
TABLE 50 CANADA: MARKET SIZE, BY TYPE, 2018–2025 (KT)
TABLE 51 MEXICO: MARKET SIZE, BY TYPE, 2018–2025 (USD MILLION)
TABLE 52 MEXICO: MARKET SIZE, BY TYPE, 2018–2025 (KT)
TABLE 53 EUROPE: SULFUR FERTILIZERS MARKET SIZE, BY COUNTRY, 2018–2025 (USD MILLION)
TABLE 54 EUROPE: MARKET SIZE, BY COUNTRY, 2018–2025 (KT)
TABLE 55 EUROPE: MARKET SIZE, BY TYPE, 2018–2025 (USD MILLION)
TABLE 56 EUROPE: MARKET SIZE, BY TYPE, 2018–2025 (KT)
TABLE 57 EUROPE: MARKET SIZE, BY CROP TYPE, 2018–2025 (USD MILLION)
TABLE 58 EUROPE: MARKET SIZE, BY FORM, 2018–2025 (USD MILLION)
TABLE 59 EUROPE: MARKET SIZE, BY MODE OF APPLICATION, 2018–2025 (USD MILLION)
TABLE 60 FRANCE: MARKET SIZE, BY TYPE, 2018–2025 (USD MILLION)
TABLE 61 FRANCE: MARKET SIZE, BY TYPE, 2018–2025 (KT)
TABLE 62 GERMANY: MARKET SIZE, BY TYPE, 2018–2025 (USD MILLION)
TABLE 63 GERMANY: MARKET SIZE, BY TYPE, 2018–2025 (KT)
TABLE 64 SPAIN: MARKET SIZE, BY TYPE, 2018–2025 (USD MILLION)
TABLE 65 SPAIN: MARKET SIZE, BY TYPE, 2018–2025 (KT)
TABLE 66 ITALY: MARKET SIZE, BY TYPE, 2018–2025 (USD MILLION)
TABLE 67 ITALY: MARKET SIZE, BY TYPE, 2018–2025 (KT)
TABLE 68 RUSSIA: MARKET SIZE, BY TYPE, 2018–2025 (USD MILLION)
TABLE 69 RUSSIA: MARKET SIZE, BY TYPE, 2018–2025 (KT)
TABLE 70 REST OF EUROPE: MARKET SIZE, BY TYPE, 2018–2025 (USD MILLION)
TABLE 71 REST OF EUROPE: MARKET SIZE, BY TYPE, 2018–2025 (KT)
TABLE 72 ASIA PACIFIC: SULFUR FERTILIZERS MARKET SIZE, BY COUNTRY, 2018–2025 (USD MILLION)
TABLE 73 ASIA PACIFIC: MARKET SIZE, BY COUNTRY, 2018–2025 (KT)
TABLE 74 ASIA PACIFIC: MARKET SIZE, BY TYPE, 2018–2025 (USD MILLION)
TABLE 75 ASIA PACIFIC: MARKET SIZE, BY TYPE, 2018–2025 (KT)
TABLE 76 ASIA PACIFIC: MARKET SIZE, BY CROP TYPE, 2018–2025 (USD MILLION)
TABLE 77 ASIA PACIFIC: MARKET SIZE, BY FORM, 2018–2025 (USD MILLION)
TABLE 78 ASIA PACIFIC: MARKET SIZE, BY MODE OF APPLICATION, 2018–2025 (USD MILLION)
TABLE 79 CHINA: MARKET SIZE, BY TYPE, 2018–2025 (USD MILLION)
TABLE 80 CHINA: MARKET SIZE, BY TYPE, 2018–2025 (KT)
TABLE 81 INDIA: MARKET SIZE, BY TYPE, 2018–2025 (USD MILLION)
TABLE 82 INDIA: MARKET SIZE, BY TYPE, 2018–2025 (KT)
TABLE 83 AUSTRALIA: MARKET SIZE, BY TYPE, 2018–2025 (USD MILLION)
TABLE 84 AUSTRALIA: MARKET SIZE, BY TYPE, 2018–2025 (KT)
TABLE 85 VIETNAM: MARKET SIZE, BY TYPE, 2018–2025 (USD MILLION)
TABLE 86 VIETNAM: MARKET SIZE, BY TYPE, 2018–2025 (KT)
TABLE 87 REST OF ASIA PACIFIC: MARKET SIZE, BY TYPE, 2018–2025 (USD MILLION)
TABLE 88 REST OF ASIA PACIFIC: MARKET SIZE, BY TYPE, 2018–2025 (KT)
TABLE 89 SOUTH AMERICA: SULFUR FERTILIZERS MARKET SIZE, BY COUNTRY, 2018–2025 (USD MILLION)
TABLE 90 SOUTH AMERICA: MARKET SIZE, BY COUNTRY, 2018–2025 (KT)
TABLE 91 SOUTH AMERICA: MARKET SIZE, BY TYPE, 2018–2025 (USD MILLION)
TABLE 92 SOUTH AMERICA: MARKET SIZE, BY TYPE, 2018–2025 (KT)
TABLE 93 SOUTH AMERICA: MARKET SIZE, BY CROP TYPE, 2018–2025 (USD MILLION)
TABLE 94 SOUTH AMERICA: MARKET SIZE, BY FORM, 2018–2025 (USD MILLION)
TABLE 95 SOUTH AMERICA: MARKET SIZE, BY MODE OF APPLICATION, 2018–2025 (USD MILLION)
TABLE 96 BRAZIL: MARKET SIZE, BY TYPE, 2018–2025 (USD MILLION)
TABLE 97 BRAZIL: MARKET SIZE, BY TYPE, 2018–2025 (KT)
TABLE 98 ARGENTINA: MARKET SIZE, BY TYPE, 2018–2025 (USD MILLION)
TABLE 99 ARGENTINA: MARKET SIZE, BY TYPE, 2018–2025 (KT)
TABLE 100 REST OF SOUTH AMERICA: MARKET SIZE, BY TYPE, 2018–2025 (USD MILLION)
TABLE 101 REST OF SOUTH AMERICA: MARKET SIZE, BY TYPE, 2018–2025 (KT)
TABLE 102 ROW: SULFUR FERTILIZERS MARKET SIZE, BY COUNTRY, 2018–2025 (USD MILLION)
TABLE 103 ROW: MARKET SIZE, BY COUNTRY, 2018–2025 (KT)
TABLE 104 ROW: MARKET SIZE, BY TYPE, 2018–2025 (USD MILLION)
TABLE 105 ROW: MARKET SIZE, BY TYPE, 2018–2025 (KT)
TABLE 106 ROW: MARKET SIZE, BY CROP TYPE, 2018–2025 (USD MILLION)
TABLE 107 ROW: MARKET SIZE, BY FORM, 2018–2025 (USD MILLION)
TABLE 108 ROW: MARKET SIZE, BY MODE OF APPLICATION, 2018–2025 (USD MILLION)
TABLE 109 SOUTH AFRICA: MARKET SIZE, BY TYPE, 2018–2025 (USD MILLION)
TABLE 110 SOUTH AFRICA: MARKET SIZE, BY TYPE, 2018–2025 (KT)
TABLE 111 TURKEY: MARKET SIZE, BY TYPE, 2018–2025 (USD MILLION)
TABLE 112 TURKEY: MARKET SIZE, BY TYPE, 2018–2025 (KT)
TABLE 113 OTHERS IN ROW: MARKET SIZE, BY TYPE, 2018–2025 (USD MILLION)
TABLE 114 OTHERS IN ROW: SULFUR FERTILIZERS MARKET SIZE, BY TYPE, 2018–2025 (KT)
TABLE 115 NEW PRODUCT LAUNCHES, 2017–2019
TABLE 116 EXPANSIONS, 2016–2019
TABLE 117 MERGERS & ACQUISITIONS, 2016–2020
TABLE 118 AGREEMENTS, COLLABORATIONS & PARTNERSHIPS, 2017–2020
LIST OF FIGURES (63 FIGURES)
FIGURE 1 MARKET SEGMENTATION
FIGURE 2 RESEARCH DESIGN
FIGURE 3 MARKET SIZE ESTIMATION METHODOLOGY: BOTTOM-UP APPROACH
FIGURE 4 MARKET SIZE ESTIMATION METHODOLOGY: TOP-DOWN APPROACH
FIGURE 5 DATA TRIANGULATION METHODOLOGY
FIGURE 6 GLOBAL SULFUR FERTILIZERS: MARKET, BY TYPE 2020-2025
FIGURE 7 OILSEEDS & PULSES SEGMENT IS PROJECTED TO DOMINATE THE MARKET DURING THE FORECAST PERIOD
FIGURE 8 FERTIGATION IS PROJECTED TO WITNESS THE HIGHEST DEMAND DURING THE FORECAST PERIOD
FIGURE 9 ASIA PACIFIC ACCOUNTED FOR THE LARGEST SHARE, IN TERMS OF VALUE, IN 2019
FIGURE 10 INCREASE IN SULFUR DEFICIENCY IN THE SOIL TO DRIVE THE GROWTH OF THE MARKET
FIGURE 11 DRY FORM WAS A LARGER SEGMENT IN THE SULFUR FERTILIZERS MARKET IN 2019
FIGURE 12 ASIA PACIFIC: CHINA WAS ONE OF THE MAJOR CONSUMERS ACROSS THE GLOBE IN 2019
FIGURE 13 ASIA PACIFIC DOMINATED ACROSS ALL THE CROP TYPE SEGMENTS
FIGURE 14 CHINA DOMINATED THE GLOBAL MARKET, IN 2019, IN TERMS OF VALUE
FIGURE 15 AREA HARVESTED, BY CROP TYPE, 2014–2018 (HA)
FIGURE 16 GLOBAL DECREASE IN PER CAPITA ARABLE LAND (1960–2050)
FIGURE 17 MARKET: DRIVERS, RESTRAINTS, OPPORTUNITIES, AND CHALLENGES
FIGURE 18 REGIONAL PLANT NUTRITION & SULPHUR DEFICIT, 2005-2015
FIGURE 19 CONSUMPTION OF TRADITIONAL SULFUR FERTILIZERS, 2012-2017
FIGURE 20 ORGANIC LAND AREA IN HECTARES, 2017
FIGURE 21 SHARE OF THE FDI INFLOW IN AGRICULTURE, BY REGION, 2017
FIGURE 22 COST OF RAW MATERIALS (SULFUR) PER UNIT TON, 2011-2019
FIGURE 23 REGULATORY APPROVALS: VITAL COMPONENT OF THE SUPPLY CHAIN
FIGURE 24 SULFUR FOB PRICE ANALYSIS
FIGURE 25 SULFUR PRODUCTION, BY COUNTRY, 2014-2019 (‘000 METRIC TON)
FIGURE 26 SULFUR RECOVERY – CLAUS PROCESS FLOW DIAGRAM
FIGURE 27 LEADING SULFUR-EXPORTING REGIONS, 2013-2017
FIGURE 28 LEADING SULFUR-EXPORTING COUNTRIES, 2013-2017
FIGURE 29 LEADING SULFUR-IMPORTING REGIONS, 2013-2017
FIGURE 30 LEADING SULFUR-IMPORTING COUNTRIES, 2013-2017
FIGURE 31 NUMBER OF PATENTS APPROVED FOR SULFUR FERTILIZERS IN MAJOR COUNTRIES, 2015–2020
FIGURE 32 SULFATE IS PROJECTED TO DOMINATE THE MARKET DURING THE FORECAST PERIOD
FIGURE 33 OILSEEDS & PULSES SEGMENT IS PROJECTED TO DOMINATE THE MARKET DURING THE FORECAST PERIOD
FIGURE 34 SOIL SEGMENT IS PROJECTED TO DOMINATE THE MARKET DURING THE FORECAST PERIOD
FIGURE 35 DRY SEGMENT IS PROJECTED TO DOMINATE THE MARKET DURING THE FORECAST PERIOD
FIGURE 36 OPEN FIELD SEGMENT IS PROJECTED TO DOMINATE THE MARKET DURING THE FORECAST PERIOD
FIGURE 37 RUSSIA AND BRAZIL ARE PROJECTED TO RECORD THE HIGHEST GROWTH IN THE MARKET DURING THE FORECAST PERIOD
FIGURE 38 ASIA PACIFIC: SNAPSHOT
FIGURE 39 ROW: SULFUR FERTILIZERS SNAPSHOT
FIGURE 40 SULFUR FERTILIZERS: COMPANY SHARE ANALYSIS, 2018
FIGURE 41 SULFUR FERTILIZERS MARKET: COMPETITIVE LEADERSHIP MAPPING, 2019
FIGURE 42 KEY DEVELOPMENTS OF THE LEADING PLAYERS IN THE SULFUR FERTILIZERS MARKET, 2014–2019
FIGURE 43 SULFUR FERTILIZERS MARKET: COMPETITIVE LEADERSHIP MAPPING FOR TIER 2 COMPANIES, 2019
FIGURE 44 NUTRIEN LTD: COMPANY SNAPSHOT
FIGURE 45 NUTRIEN LTD: SWOT ANALYSIS
FIGURE 46 YARA INTERNATIONAL ASA: COMPANY SNAPSHOT
FIGURE 47 YARA INTERNATIONAL ASA: SWOT ANALYSIS
FIGURE 48 THE MOSAIC COMPANY: COMPANY SNAPSHOT
FIGURE 49 THE MOSAIC COMPANY: SWOT ANALYSIS
FIGURE 50 ICL: COMPANY SNAPSHOT
FIGURE 51 ICL: SWOT ANALYSIS
FIGURE 52 K+S AKTIENGESELLSCHAFT: COMPANY SNAPSHOT
FIGURE 53 K+S AKTIENGESELLSCHAFT : SWOT ANALYSIS
FIGURE 54 NUFARM LIMITED: COMPANY SNAPSHOT
FIGURE 55 COROMANDEL INTERNATIONAL LTD: COMPANY SNAPSHOT
FIGURE 56 EUROCHEM GROUP: COMPANY SNAPSHOT
FIGURE 57 DEEPAK FERTILIZERS AND PETROCHEMICALS LTD.: COMPANY SNAPSHOT
FIGURE 58 COMPASS MINERALS: COMPANY SNAPSHOT
FIGURE 59 ZUARI AGRO CHEMICALS LTD: COMPANY SNAPSHOT
FIGURE 60 SQM S.A.: COMPANY SNAPSHOT
FIGURE 61 BALCHEM INC.: COMPANY SNAPSHOT
FIGURE 62 TESSENDERLO KERLEY, INC.: COMPANY SNAPSHOT
FIGURE 63 SHELL SULFUR SOLUTIONS: COMPANY SNAPSHOT
The study involved four major activities for estimating the share of the sulfur fertilizers market. Exhaustive secondary research was done to collect information on the market, peer market, and parent market. These findings, assumptions, and market sizes were validated with industry experts across the value chain through primary research. Both the top-down and bottom-up approaches were employed to estimate the complete market size. Thereafter, the market breakdown and data triangulation approaches were used to estimate the market size of segments and subsegments.
Secondary Research
In the secondary research process, various secondary sources, such as the Food and Agriculture Organization (FAO), International Fertilizer Association (IFA), The Sulphur Institute (TSI), United States Department of Agriculture (USDA), the ministries of the agricultural department in various countries, corporate filings (such as annual reports, press releases, investor presentations, and financial statements), and trade, business, and professional associations, were considered. The secondary data was collected and analyzed to arrive at the overall market size, which was further validated by primary research.
Primary Research
The sulfur fertilizers market comprises several stakeholders, such as agricultural manufacturers, formulators and blenders, fertilizer traders, suppliers, distributors, importers and exporters, raw material suppliers, and technology providers to sulfur fertilizer manufacturers, The agricultural co-operative societies, fertilizers associations and industry bodies, and government agricultural departments and regulatory bodies. The market is driven mainly by factors such as the rise in the use of low-sulfur containing fertilizers and the decrease in the sulfur deposition in the atmosphere due to the introduction of strict regulations on sulfur emissions.
Various primary sources from both the supply and demand sides of the market were interviewed to obtain qualitative and quantitative information.
Market Size Estimation
Both the top-down and bottom-up approaches were used to estimate and validate the total size of the sulfur fertilizers market. These methods were also used extensively to estimate the size of various subsegments in the market. The research methodology used to estimate the market size includes the following:
- The key players in the industry and markets were identified through extensive secondary research.
- Major regions were identified, along with countries contributing to the maximum share.
- The industry’s supply chain and market size, in terms of value, was determined through primary and secondary research processes.
- All percentage shares, splits, and breakdowns were determined using secondary sources and verified through primary respondents
Data Triangulation
After arriving at the overall market size—using the market size estimation processes as explained above—the market was split into several segments and subsegments. To complete the overall market engineering process and arrive at the exact statistics of each market segment and subsegment, the data triangulation and market breakdown procedures were employed. The data was triangulated by studying various factors and trends from both the demand and supply sides in the market.
To know about the assumptions considered for the study, download the pdf brochure
Report Objectives
Market Intelligence
- Determining and projecting the size of the market, based on type, crop type, form, mode of application, cultivation type, and regional markets, over a five-year period, ranging from 2020 to 2025
- Identifying attractive opportunities in the market by determining the largest and fastest-growing segments across regions
- Analyzing the demand-side factors based on the following:
- Impact of macro- and micro-economic factors on the market
- The shift in demand patterns across different subsegments and regions
Competitive Intelligence
- Identifying and profiling the key market players in the sulfur fertilizers market
- Providing a comparative analysis of the market leaders based on the following:
- Product offerings
- Business strategies
- Strengths, weaknesses, opportunities, and threats
- Key financials
- Understanding the competitive landscape and identifying major growth strategies adopted by the key companies
- Analyzing the prices, trade, and patents registered across the regions
- Analyzing the market dynamics and competitive situations & trends across regions, as well as their impact on prominent market players
Available Customizations
With the given market data, MarketsandMarkets offers customizations according to company-specific scientific needs.
The following customization options are available for the report:
Product Analysis
- Product matrix, which gives a detailed comparison of the product portfolio of each company
Geographic Analysis
- Further breakdown of the Rest of Europe market into the Netherlands, Belgium, Denmark, Hungary, Poland, Portugal, and the US.
- Further breakdown of the Rest of Asia Pacific market into Indonesia, Japan, Malaysia, South Korea, and Thailand.
- Further breakdown of the Rest of South America market into Chile, Colombia, Uruguay, and Peru
Company Information
- Detailed analyses and profiling of additional market players (up to five)


Growth opportunities and latent adjacency in Sulfur Fertilizers Market