Submarine Power Cable Market by Core Type (Single-core, Multi-core), Voltage (Medium, High), Conductor Material (Copper, Aluminium), End Use (Offshore Wind, Inter-Country & Island Connection, Offshore Oil & Gas), Type and Region - Global Forecast to 2028
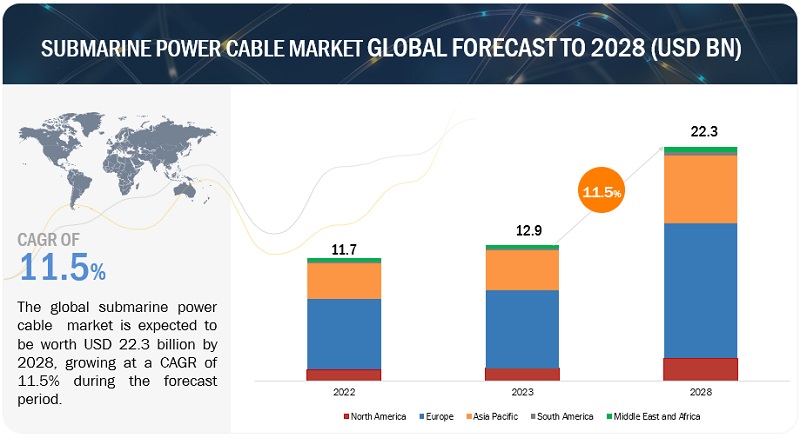
[207 Pages Report] The submarine power cable market is expected to grow from an estimated USD 12.9 billion in 2023 to USD 22.3 billion by 2028, at a CAGR of 11.5% during the forecast period. The submarine power cable market is propelled by factors like the expansion of offshore wind energy capacity and the rising need for cross-border and island connections. Additionally, the growing demand from the offshore oil and gas sector is anticipated to drive demand for submarine power cables. Furthermore, the increasing interest in high-voltage direct current (HVDC) connections represents a promising opportunity for the submarine power cable market, given the substantial investments being allocated to this segment.
To know about the assumptions considered for the study, Request for Free Sample Report
To know about the assumptions considered for the study, download the pdf brochure
Submarine Power Cable Market Dynamics
Driver: Growth of Offshore Wind Farms
The growth of Wind Power Generation in offshore locations is fueled by the abundant wind resources near coastlines, proximity to urban centers, reduced environmental impact, and government support for renewable energy. Submarine power cables are vital for connecting offshore wind farms to the grid, facilitating this growth and promoting clean energy adoption.
The global energy transition is fueling a surge in demand for submarine power cables, notably in the offshore wind sector. Offshore wind projects are expanding into more remote and deeper waters, often employing innovative floating wind technology in previously untapped regions. These developments necessitate longer and more robust submarine cables to transmit generated electricity ashore. Deep-sea wind turbines, boasting increased height and exposure to consistent, high-velocity winds, offer enhanced power generation potential. However, this also requires larger and more efficient submarine cables. This burgeoning demand presents a substantial business opportunity for companies engaged in cable manufacturing, installation, and maintenance, with the industry striving to push the boundaries of cable length and capacity to meet the offshore wind sector's growing needs.
Restraints: High Cost of Installation and Repair of Submarine Cables
The deployment and maintenance of submarine cables can present notable financial hurdles for power transmission ventures. These expenses stem from the intricate installation procedures, specialized equipment prerequisites, and the demand for expert workforce. Moreover, the distinctive attributes and operational circumstances of submarine settings amplify the associated expenditures.
Also, submarine power cable projects often cross international borders and involve multiple jurisdictions, each with its own set of regulations. This can make it difficult to get all of the necessary permits and approvals and can lead to delays in the start of construction and the completion of the project. In addition, submarine power cable projects are often complex and involve a number of different stakeholders, including government agencies, environmental groups, and local communities. This can make it difficult to reach a consensus on the project and to address all of the concerns of the stakeholders. This can also lead to delays in the project.
Opportunity: Increasing Adoption of HVDC Submarine Power Cables
The growing integration of intermittent renewable sources of energy increases the need for transmitting electric energy over long distances, encompassing wide and deep-water bodies using submarine power cables. With the increasing installation of submarine power cable projects, there has arisen a need for efficient power transmission enabling reduced dissipative losses. This is achieved with the application of HVDC submarine power cables, which offer several advantages over conventional High Voltage Direct Current (HVAC). HVDC cables require less material and space than HVAC cables. HVDC cables only need one power line to transmit electricity, while HVAC cables need three. HVDC cables also have a shorter length limit than HVAC cables due to the capacitance between the active conductors and the surrounding earth or water. This means that HVDC cables can be used to transmit electricity over longer distances without losing power.
Challenges: Environmental Compliance Challenges in Submarine Power Cable Installations
Submarine power cables face several challenges. Installation costs are substantial due to their complexity, specialized equipment, and skilled labor requirements. Maintenance and repair in underwater environments are costly and technologically demanding. They are vulnerable to natural disasters, such as storms and earthquakes, which can lead to service interruptions and expensive repairs. Marine life, including fishing activities and accidental anchoring, poses risks. Submarine cables also need to comply with environmental regulations to minimize ecological impacts. The growing demand for longer and higher-capacity cables for offshore wind and energy interconnections necessitates ongoing innovation to address these challenges and ensure the reliability and sustainability of underwater power transmission.
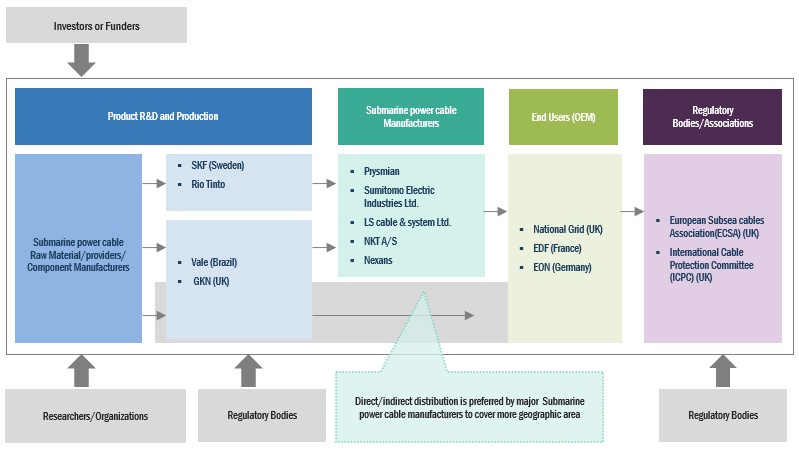
Submarine Power Cable Market Ecosystem
Notable players in this industry comprise long-standing, financially robust manufacturers of the Submarine power cable Market. These companies have a significant track record in the market, offering a wide range of products, employing cutting-edge technologies, and maintaining robust global sales and marketing networks. Prominent companies in this market include Prysmian (Itlay), Sumitomo Electric Industries Ltd. (Japan), LS cable & system LTD. (Korea), NKT A/S (Denmark), and Nexans (France).
Single core is expected to be the largest market based on core type
Single-core submarine power cables are a type of specialized cable designed for transmitting electrical power underwater, typically between two points on land or between an offshore installation and the shore. These cables are essential for various applications, including offshore wind farms, interconnections between power grids in different countries, and power distribution to remote islands or offshore facilities.
DC, by type, to hold the fastest market share during the forecast period during the forecast period
The market has been segmented by type into AC and DC. HVDC submarine cables typically operate at high voltage levels, often ranging from hundreds of kilovolts (kV) to several megavolts (MV). Higher voltage levels reduce transmission losses over long distances. DC segment is expected to be the fastest segment in the market by type due to the reduced transmission losses when compared to AC submarine power cables. Moreover, the cost of the DC power cables are lesser when compared to AC power cables which is driving the market for the segment.
High voltage, by voltage, to hold the largest market share during the forecast period.
The market has been segmented by voltage into high and medium voltage. The high voltage segment is expected to be the largest segment in the market by voltage. High-voltage submarine cables typically operate at high voltage levels, often ranging from hundreds of kilovolts (kV) to several megavolts (MV). Higher voltage levels reduce transmission losses over long distances. The market growth for this segment is because of rising investments in grid interconnections and the offshore wind sector requiring longer and higher capacity cables are expected to drive the high-voltage segment during the forecast period.
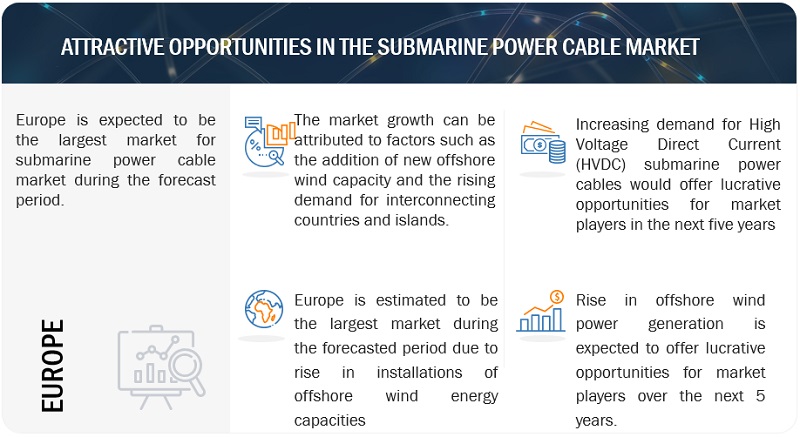
Europe is expected to account for the largest market during the forecast period.
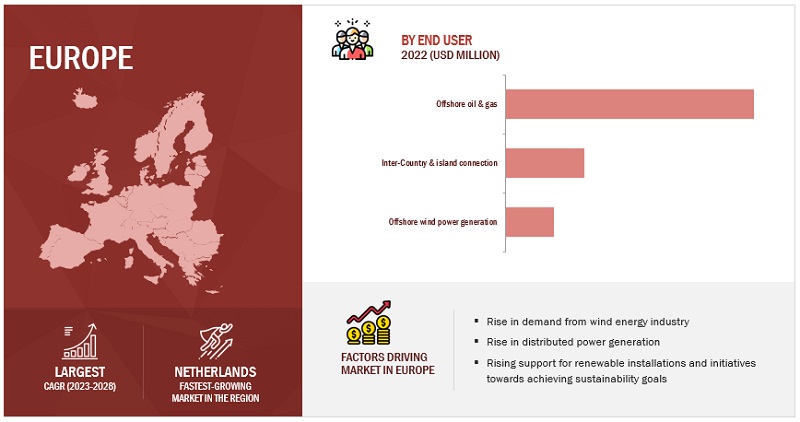
Europe is the largest market due to the high number of projects in terms of new offshore wind farm installation. As countries in Europe work towards achieving carbon neutrality and meeting their renewable energy targets, offshore power generation has emerged as a versatile and efficient solution to optimize energy generation. Furthermore, supportive policies and financial incentives from European governments have attracted investments in offshore projects. The European Union's focus on fostering green innovation and supporting sustainable energy initiatives has created a favorable environment for the growth of the submarine power cable market. Moreover, the versatility and adaptability of submarine cable have captured the interest of diverse sectors in Europe, including offshore wind power generation, Inter-country & Island Connection, and offshore oil and gas users. submarine power cables provide a scalable and flexible approach to cater to varying energy transmission needs, for offshore applications.
Key Market Players
The submarine power cable market is dominated by a few major players that have a wide regional presence. The major players in the submarine power cable market are Prysmian (Itlay), Sumitomo Electric Industries Ltd. (Japan), LS cable & system LTD. (Korea), NKT A/S (Denmark), and Nexans (France). Strategies such as product launches, contracts, agreements, partnerships, collaborations, alliances, acquisitions, and expansions are followed by these companies to capture a larger share of the submarine power cable market.
Scope of the Report
|
Report Metric |
Details |
|
Market size available for years |
2021–2028 |
|
Base year considered |
2022 |
|
Forecast period |
2024–2028 |
|
Forecast units |
Value (USD) |
|
Segments covered |
Type, Core Type, Voltage, Conductor Material, End Use, and Region |
|
Geographies covered |
Asia Pacific, North America, Europe, Middle East & Africa, and South America |
|
Companies covered |
Sumitomo Electric Industries (Japan), Prysmian S.p.A (Italy), Nexans (France), NKT A/S (Denmark), LS Cable & System Ltd. (South Korea), Furukawa Electric Co., Ltd. (Japan), ZTT (China), KEI Industries Limited (India), Tele Fonika Kable SA (Poland), Taihan Cable & Solution Co., Ltd. (South Korea), Hengtong Group (China), Tratos (Italy), Hydro Group (UK), The Okonite Company (US), Hellinic Cables (Greece), Bhuwal Insulation Cable Pvt. Ltd. (India), Apar Industries (India), JDR Cable Systems Ltd. (UK), SSG Cable (China), 1X Technologies LLC (US) |
This research report categorizes the Submarine Power Cable market by type, end user industry, module, and region
On the basis of type, the Submarine Power Cable market has been segmented as follows:
- AC
- DC
On the basis of end user, the Submarine Power Cable market has been segmented as follows:
- Offshore Wind Power Generation
- Inter-country and Island Connection
- Offshore Oil & Gas
On the basis of by Core Type, the Submarine Power Cable market has been segmented as follows:
- Single Core
- Multicore
On the basis of by conductor material, the Submarine Power Cable market has been segmented as follows:
- Copper
- Aluminium
On the basis of by voltage, the Submarine Power Cable market has been segmented as follows:
- Medium
- High
On the basis of region, the Submarine Power Cable market has been segmented as follows:
- Asia Pacific
- Europe
- North America
- Middle East & Africa
- South America
Recent Developments
- In April 2023, Sumitomo Electric Industries, Ltd. announced plans to establish a new Power Cable factory (high voltage cable manufacturing plant) in the Scottish Highlands to support UK Government’s goal to achieve Net zero 2050.
- In April 2023, Nexans successfully finalized the acquisition of Reka kaapeli oy, a leading Finnish manufacturer of high, medium, and low voltage cables, as part of its strategy to become a key player in electrification and contribute to carbon neutrality by 2030.
- In April 2020, Prysmian Group successfully completed the brand integration process after acquiring General Cable. The company introduced a multi-brand strategy and updated its visual identity and logos.
Frequently Asked Questions (FAQ):
What is the current size of the submarine power cable market?
The current market size of global submarine power cable market is USD 12.9 billion in 2023.
What is the major drivers for submarine power cable market?
Major drivers for the submarine cable market include offshore renewable energy expansion, cross-border grid interconnections, global energy transition, technological advancements, and government support for infrastructure development.
Which is the largest region during the forecasted period in the submarine power cable market?
Europe is the largest market as there is a high number of projects in terms of new offshore wind farm installation, addition of new offshore wind capacity and the rising demand for interconnecting countries and islands.
Which is the Fastest market segment, by type during the forecasted period in the submarine power cable market?
DC segment is expected to be the fastest segment in the market by type due to its lower demand for reactive power as DC is the preferred choice for transmitting substantial electric power via submarine cables.
Which is the largest segment, by voltage during the forecasted period the submarine power cable market?
The high voltage segment is expected to be the largest segment in the market by voltage, because of Rising investments in grid interconnections and the offshore wind sector requiring longer and higher capacity cables are expected to drive the high-voltage segment during the forecast period.
To speak to our analyst for a discussion on the above findings, click Speak to Analyst


- 5.1 INTRODUCTION
-
5.2 MARKET DYNAMICSDRIVERS- Growing installation of offshore wind turbines- Discoveries of reserves and growing offshore production in developing economiesRESTRAINTS- Complex regulatory and environmental authorization procedures- High cost of installation and repairing submarine cablesOPPORTUNITIES- Increasing adoption of HVDC submarine power cablesCHALLENGES- Requirement of technical expertise for developing and installing submarine power cables- Damage caused to cables by human interventions- Price variations of copper and aluminum
-
5.3 TRENDS/DISRUPTIONS IMPACTING CUSTOMERS’ BUSINESSES
-
5.4 TECHNOLOGY ANALYSISTECHNOLOGY TRENDS OF SUBMARINE POWER CABLES
-
5.5 CASE STUDY ANALYSISAUSTRALIA–SINGAPORE INTERCONNECTOR PROJECT FOSTERS REGIONAL ENERGY COOPERATION BY INVESTING IN HVDC TECHNOLOGYTRATOS COLLABORATES WITH ENEL TO DEVELOP SPECIALIZED CABLES WITH ADVANCED INSULATION MATERIALS
- 5.6 KEY CONFERENCES AND EVENTS, 2023–2024
-
5.7 ECOSYSTEM ANALYSIS
- 5.8 VALUE CHAIN ANALYSIS
- 5.9 PRICING ANALYSIS
-
5.10 TARIFF AND REGULATORY LANDSCAPETARIFF RELATED TO SUBMARINE POWER CABLE UNITSREGULATORY LANDSCAPESTANDARDS
-
5.11 PATENT ANALYSIS
- 5.12 TRADE ANALYSIS
-
5.13 PORTER’S FIVE FORCES ANALYSISTHREAT OF SUBSTITUTESBARGAINING POWER OF SUPPLIERSBARGAINING POWER OF BUYERSTHREAT OF NEW ENTRANTSINTENSITY OF COMPETITIVE RIVALRY
-
5.14 KEY STAKEHOLDERS AND BUYING CRITERIAKEY STAKEHOLDERS IN BUYING PROCESSBUYING CRITERIA
- 6.1 INTRODUCTION
-
6.2 SINGLE-COREEASY INSTALLATION AND HANDLING TO DRIVE DEMAND
-
6.3 MULTI-COREEASY TRANSMISSION OF HIGH LEVELS OF POWER TO BOOST MARKET GROWTH
- 7.1 INTRODUCTION
-
7.2 ACCOST-EFFECTIVENESS FOR SHORT DISTANCE AND EASY MAINTENANCE TO DRIVE MARKET GROWTH
-
7.3 DCABILITY TO FACILITATE SUBSEA POWER DISTRIBUTION FOR MARINE RESEARCH AND EXPLORATION TO SPUR DEMAND
- 8.1 INTRODUCTION
-
8.2 MEDIUM-VOLTAGESUITABILITY FOR SHORT-DISTANCE POWER TRANSMISSION TO DRIVE MARKET
-
8.3 HIGH-VOLTAGERISING NUMBER OF OFFSHORE WIND POWER INSTALLATIONS TO FOSTER SEGMENTAL GROWTH
- 9.1 INTRODUCTION
-
9.2 COPPERROBUST TENSILE STRENGTH AND THERMAL CONDUCTIVITY TO FOSTER SEGMENTAL GROWTH
-
9.3 ALUMINUMSAFE HANDLING FOR LONG CABLE LENGTHS TO DRIVE DEMAND
- 10.1 INTRODUCTION
-
10.2 OFFSHORE WIND POWER GENERATIONDEPLOYMENT OF HVDC CABLING TO TRANSMIT POWER ACROSS REMOTE OFFSHORE INSTALLATIONS TO BOOST SEGMENTAL GROWTH
-
10.3 INTER-COUNTRY & ISLAND CONNECTIONPROMOTION OF UNIFIED ELECTRICITY MARKET TO DRIVE MARKET
-
10.4 OFFSHORE OIL & GASINCREASING SUBSEA OPERATIONS AND DEEPWATER DRILLING TO FUEL MARKET GROWTH
- 11.1 INTRODUCTION
-
11.2 EUROPERECESSION IMPACT: EUROPEUK- Strong focus to achieve ‘Net Zero Target’ to fuel marketGERMANY- Legislations favoring development of renewable energy sector to fuel market growthDENMARK- Rising investments to develop offshore wind energy projects to favor market growthNETHERLANDS- Promising investment opportunities for players in offshore wind sector to foster market growthNORWAY- Key players making significant investments in offshore oil and gas industry to drive marketFRANCE- Growing emphasis on developing energy sector to drive market growthREST OF EUROPE
-
11.3 ASIA PACIFICRECESSION IMPACT: ASIA PACIFICCHINA- Increased focus on achieving carbon neutrality to drive marketJAPAN- Rising government-led initiatives to protect undersea cables to drive marketSOUTH KOREA- Ongoing developments in offshore wind sector to fuel market growthMALAYSIA- Rise in offshore oil & gas explorations to drive marketINDONESIA- Development of new offshore projects to foster market growthVIETNAM- Subsequent increase in offshore wind energy capacity to boost market growthREST OF ASIA PACIFIC
-
11.4 NORTH AMERICARECESSION IMPACT: NORTH AMERICAUS- Implementation of comprehensive strategies by Department of Energy to boost marketCANADA- Government-led initiatives to promote and support clean economy with renewable energy technologies to fuel market growthMEXICO- Large and diverse renewable energy resource base to offer lucrative opportunities to players
-
11.5 MIDDLE EAST & AFRICARECESSION IMPACT: MIDDLE EAST & AFRICASAUDI ARABIA- Significant presence of productive onshore oilfields to drive marketUAE- Implementation of Enhanced Oil Recovery (EOR) technique in oil fields to surge demandANGOLA- Rising focus on exploring and producing offshore crude oil and natural gas to fuel market growthREST OF MIDDLE EAST & AFRICA
-
11.6 SOUTH AMERICARECESSION IMPACT: SOUTH AMERICABRAZIL- Growing offshore exploration and oil production activities to drive marketARGENTINA- Rising government investments for offshore gas production venture to drive marketREST OF SOUTH AMERICA

- 12.1 OVERVIEW
- 12.2 KEY STRATEGIES ADOPTED BY MAJOR PLAYERS
- 12.3 MARKET SHARE ANALYSIS, 2022
- 12.4 REVENUE ANALYSIS, 2018–2022
-
12.5 EVALUATION MATRIX OF KEY COMPANIES, 2022STARSPERVASIVE PLAYERSEMERGING LEADERSPARTICIPANTS
- 12.6 SUBMARINE POWER CABLE MARKET: COMPANY FOOTPRINT
-
12.7 COMPETITIVE SCENARIOS AND TRENDSPRODUCT LAUNCHESDEALSOTHERS
-
13.1 KEY PLAYERSSUMITOMO ELECTRIC INDUSTRIES, LTD.- Business overview- Products/Solutions/Services offered- Recent developments- MnM viewPRYSMIAN SPA- Business overview- Products/Solutions/Services offered- Recent developments- MnM viewNEXANS- Business overview- Products/Solutions/Services offered- Recent developments- MnM viewNKT A/S- Business overview- Products/Solutions/Services offered- Recent developments- MnM viewLS CABLE & SYSTEM LTD.- Business overview- Products/Solutions/Services offered- Recent developments- MnM viewFURUKAWA ELECTRIC CO., LTD.- Business overview- Products/Solutions/Services offered- Recent developmentsZTT- Business overview- Products/Solutions/Services offered- Recent developmentsKEI INDUSTRIES LIMITED- Business overview- Products/Solutions/Services offered- Recent developmentsTFKABLE- Business overview- Products/Solutions/Services offeredTAIHAN CABLE & SOLUTION CO., LTD.- Business overview- Products/Solutions/Services offered- Recent developmentsHENGTONG GROUP CO., LTD.- Business overview- Products/Solutions/Services offered- Recent developmentsTRATOS- Business overview- Products/Solutions/Services offered- Recent developmentsHYDRO GROUP- Business overview- Products/Solutions/Services offeredTHE OKONITE COMPANY- Business overview- Products/Solutions/Services offeredHELLENIC CABLES- Business overview- Products/Solutions/Services offered- Recent developments
-
13.2 OTHER PLAYERSBHUWAL INSULATION CABLE PVT. LTDAPAR INDUSTRIESJDR CABLE SYSTEMS LTD.SSGCABLE1X TECHNOLOGIES LLC
- 14.1 INSIGHTS FROM INDUSTRY EXPERTS
- 14.2 DISCUSSION GUIDE
- 14.3 KNOWLEDGESTORE: MARKETSANDMARKETS’ SUBSCRIPTION PORTAL
- 14.4 CUSTOMIZATION OPTIONS
- 14.5 RELATED REPORTS
- 14.6 AUTHOR DETAILS
- TABLE 1 SNAPSHOT OF MARKET
- TABLE 2 COUNTRY-WISE MAJOR OFFSHORE PROJECTS AND CONTRACTS
- TABLE 3 REGION-WISE DATA FOR HVDC SUBMARINE CABLE PROJECTS, 2021–2024
- TABLE 4 MARKET: LIST OF CONFERENCES AND EVENTS
- TABLE 5 COMPANIES AND THEIR ROLE IN SUBMARINE POWER CABLE ECOSYSTEM
- TABLE 6 AVERAGE SELLING PRICE OF SUBMARINE POWER CABLE, BY TYPE
- TABLE 7 AVERAGE SELLING PRICE ANALYSIS OF SUBMARINE POWER CABLE, BY REGION
- TABLE 8 AVERAGE TARIFF DATA OF SUBMARINE CABLES, BY COUNTRY
- TABLE 9 NORTH AMERICA: LIST OF REGULATORY BODIES, GOVERNMENT AGENCIES, AND OTHER ORGANIZATIONS
- TABLE 10 EUROPE: LIST OF REGULATORY BODIES, GOVERNMENT AGENCIES, AND OTHER ORGANIZATIONS
- TABLE 11 ASIA PACIFIC: LIST OF REGULATORY BODIES, GOVERNMENT AGENCIES, AND OTHER ORGANIZATIONS
- TABLE 12 GLOBAL: LIST OF REGULATORY BODIES, GOVERNMENT AGENCIES, AND OTHER ORGANIZATIONS
- TABLE 13 NORTH AMERICA: STANDARDS/REGULATIONS RELATED TO MARKET
- TABLE 14 SOUTH AMERICA: STANDARDS/REGULATIONS RELATED TO MARKET
- TABLE 15 GLOBAL: STANDARDS/REGULATIONS RELATED TO MARKET
- TABLE 16 MARKET: INNOVATIONS AND PATENT REGISTRATIONS, 2020–2023
- TABLE 17 TRADE DATA FOR PRODUCTS UNDER HS CODE: 8544, 2018–2022 (USD THOUSAND)
- TABLE 18 MARKET: PORTER’S FIVE FORCES ANALYSIS
- TABLE 19 INFLUENCE OF STAKEHOLDERS ON BUYING PROCESS FOR TOP THREE BY END USES
- TABLE 20 KEY BUYING CRITERIA FOR TOP THREE END USES
- TABLE 21 MARKET, BY CORE TYPE, 2021–2028 (USD MILLION)
- TABLE 22 SINGLE-CORE: MARKET, BY REGION, 2021–2028 (USD MILLION)
- TABLE 23 MULTI-CORE: MARKET, BY REGION, 2021–2028 (USD MILLION)
- TABLE 24 MARKET, BY TYPE, 2021–2028 (USD MILLION)
- TABLE 25 AC: MARKET, BY REGION, 2021–2028 (USD MILLION)
- TABLE 26 DC: MARKET, BY REGION, 2021–2028 (USD MILLION)
- TABLE 27 MARKET, BY VOLTAGE, 2021–2028 (USD MILLION)
- TABLE 28 MEDIUM-VOLTAGE: MARKET, BY REGION, 2021–2028 (USD MILLION)
- TABLE 29 HIGH-VOLTAGE: MARKET, BY REGION, 2021–2028 (USD MILLION)
- TABLE 30 MARKET, BY CONDUCTOR MATERIAL, 2021–2028 (USD MILLION)
- TABLE 31 CHARACTERISTICS OF COPPER AND ALUMINUM
- TABLE 32 COPPER: MARKET, BY REGION, 2021–2028 (USD MILLION)
- TABLE 33 ALUMINUM: MARKET, BY REGION, 2021–2028 (USD MILLION)
- TABLE 34 MARKET, BY END USE, 2021–2028 (USD MILLION)
- TABLE 35 COUNTRY-WISE DATA ON OFFSHORE WIND PROJECTS, 2022–2027
- TABLE 36 OFFSHORE WIND POWER GENERATION: MARKET, BY REGION, 2021–2028 (USD MILLION)
- TABLE 37 REGION-WISE DATA ON SUBMARINE INTERCONNECTION PROJECTS, 2021–2027
- TABLE 38 INTER-COUNTRY & ISLAND CONNECTION: MARKET, BY REGION, 2021–2028 (USD MILLION)
- TABLE 39 OFFSHORE OIL & GAS: MARKET, BY REGION, 2021–2028 (USD MILLION)
- TABLE 40 MARKET, BY REGION, 2021–2028 (USD MILLION)
- TABLE 41 MARKET, BY REGION, 2021–2028 (KILOMETERS)
- TABLE 42 EUROPE OFFSHORE WIND SITES WITH GRID-CONNECTED TURBINES, 2022
- TABLE 43 EUROPE: MARKET, BY TYPE, 2021–2028 (USD MILLION)
- TABLE 44 EUROPE: MARKET, BY CORE TYPE, 2021–2028 (USD MILLION)
- TABLE 45 EUROPE: MARKET, BY VOLTAGE, 2021–2028 (USD MILLION)
- TABLE 46 EUROPE: MARKET, BY CONDUCTOR MATERIAL, 2021–2028 (USD MILLION)
- TABLE 47 EUROPE: MARKET, BY COUNTRY, 2021–2028 (USD MILLION)
- TABLE 48 UK: MARKET, BY END USE, 2021–2028 (USD MILLION)
- TABLE 49 GERMANY: MARKET, BY END USE, 2021–2028 (USD MILLION)
- TABLE 50 DENMARK: MARKET, BY END USE, 2021–2028 (USD MILLION)
- TABLE 51 NETHERLANDS: MARKET, BY END USE, 2021–2028 (USD MILLION)
- TABLE 52 NORWAY: MARKET, BY END USE, 2021–2028 (USD MILLION)
- TABLE 53 FRANCE: MARKET, BY END USE, 2021–2028 (USD MILLION)
- TABLE 54 REST OF EUROPE: MARKET, BY END USE, 2021–2028 (USD MILLION)
- TABLE 55 ASIA PACIFIC: MARKET, BY TYPE, 2021–2028 (USD MILLION)
- TABLE 56 ASIA PACIFIC: MARKET, BY CORE TYPE, 2021–2028 (USD MILLION)
- TABLE 57 ASIA PACIFIC: MARKET, BY VOLTAGE, 2021–2028 (USD MILLION)
- TABLE 58 ASIA PACIFIC: MARKET, BY CONDUCTOR MATERIAL, 2021–2028 (USD MILLION)
- TABLE 59 ASIA PACIFIC: MARKET, BY COUNTRY, 2021–2028 (USD MILLION
- TABLE 60 CHINA: MARKET, BY END USE, 2021–2028 (USD MILLION)
- TABLE 61 JAPAN: MARKET, BY END USE, 2021–2028 (USD MILLION)
- TABLE 62 SOUTH KOREA: MARKET, BY END USE, 2021–2028 (USD MILLION)
- TABLE 63 MALAYSIA: MARKET, BY END USE, 2021–2028 (USD MILLION)
- TABLE 64 INDONESIA: MARKET, BY END USE, 2021–2028 (USD MILLION)
- TABLE 65 VIETNAM: MARKET, BY END USE, 2021–2028 (USD MILLION)
- TABLE 66 REST OF ASIA PACIFIC: MARKET, BY END USE, 2021–2028 (USD MILLION)
- TABLE 67 NORTH AMERICA: MARKET, BY TYPE, 2021–2028 (USD MILLION)
- TABLE 68 NORTH AMERICA: MARKET, BY CORE TYPE, 2021–2028 (USD MILLION)
- TABLE 69 NORTH AMERICA: MARKET, BY VOLTAGE, 2021–2028 (USD MILLION)
- TABLE 70 NORTH AMERICA: MARKET, BY CONDUCTOR MATERIAL, 2021–2028 (USD MILLION)
- TABLE 71 NORTH AMERICA: MARKET SIZE, BY END USE, 2021–2028 (USD MILLION)
- TABLE 72 NORTH AMERICA: MARKET, BY COUNTRY, 2021–2028 (USD MILLION)
- TABLE 73 US: MARKET, BY END USE, 2021–2028 (USD MILLION)
- TABLE 74 CANADA: MARKET, BY END USE, 2021–2028 (USD MILLION)
- TABLE 75 MEXICO: MARKET, BY END USE, 2021–2028 (USD MILLION)
- TABLE 76 MIDDLE EAST & AFRICA: MARKET, BY TYPE, 2021–2028 (USD MILLION)
- TABLE 77 MIDDLE EAST & AFRICA: MARKET, BY CORE TYPE, 2021–2028 (USD MILLION)
- TABLE 78 MIDDLE EAST & AFRICA: MARKET, BY VOLTAGE, 2021–2028 (USD MILLION)
- TABLE 79 MIDDLE EAST & AFRICA: MARKET, BY CONDUCTOR MATERIAL, 2021–2028 (USD MILLION)
- TABLE 80 MIDDLE EAST & AFRICA: MARKET, BY END USE, 2021–2028 (USD MILLION)
- TABLE 81 MIDDLE EAST & AFRICA: MARKET, BY COUNTRY, 2021–2028 (USD BILLION)
- TABLE 82 SAUDI ARABIA: MARKET, BY END USE, 2021–2028 (USD MILLION)
- TABLE 83 UAE: MARKET, BY END USE, 2021–2028 (USD MILLION)
- TABLE 84 ANGOLA: MARKET, BY END USE, 2021–2028 (USD MILLION)
- TABLE 85 REST OF MIDDLE EAST & AFRICA: MARKET, BY END USE, 2021–2028 (USD MILLION)
- TABLE 86 SOUTH AMERICA: MARKET, BY CORE TYPE, 2021–2028 (USD MILLION)
- TABLE 87 SOUTH AMERICA: MARKET, BY TYPE, 2021–2028 (USD MILLION)
- TABLE 88 SOUTH AMERICA: MARKET, BY VOLTAGE, 2021–2028 (USD MILLION)
- TABLE 89 SOUTH AMERICA: MARKET, BY CONDUCTOR MATERIAL, 2021–2028 (USD MILLION)
- TABLE 90 SOUTH AMERICA: MARKET SIZE, BY END USE, 2021–2028 (USD MILLION)
- TABLE 91 SOUTH AMERICA: MARKET, BY COUNTRY, 2021–2028 (USD MILLION)
- TABLE 92 BRAZIL: MARKET, BY END USE, 2021–2028 (USD MILLION)
- TABLE 93 ARGENTINA: MARKET, BY END USE, 2021–2028 (USD MILLION)
- TABLE 94 REST OF SOUTH AMERICA: MARKET, BY END USE, 2021–2028 (USD MILLION)
- TABLE 95 MARKET: OVERVIEW OF STRATEGIES ADOPTED BY KEY PLAYERS
- TABLE 96 MARKET SHARE ANALYSIS, 2022
- TABLE 97 COMPANY FOOTPRINT
- TABLE 98 TYPE: COMPANY FOOTPRINT
- TABLE 99 END USE: COMPANY FOOTPRINT
- TABLE 100 REGION: COMPANY FOOTPRINT
- TABLE 101 MARKET: PRODUCT LAUNCHES, 2021–2023
- TABLE 102 MARKET: DEALS, 2021–2023
- TABLE 103 MARKET: OTHERS, 2021–2023
- TABLE 104 SUMITOMO ELECTRIC INDUSTRIES, LTD.: COMPANY OVERVIEW
- TABLE 105 SUMITOMO ELECTRIC INDUSTRIES, LTD.: PRODUCTS/SOLUTIONS/ SERVICES OFFERED
- TABLE 106 SUMITOMO ELECTRIC INDUSTRIES, LTD.: DEALS
- TABLE 107 SUMITOMO ELECTRIC INDUSTRIES, LTD.: OTHERS
- TABLE 108 PRYSMIAN GROUP: COMPANY OVERVIEW
- TABLE 109 PRYSMIAN GROUP: PRODUCTS/SOLUTIONS/SERVICES OFFERED
- TABLE 110 PRYSMIAN GROUP: PRODUCT LAUNCHES
- TABLE 111 PRYSMIAN GROUP: DEALS
- TABLE 112 PRYSMIAN GROUP: OTHERS
- TABLE 113 NEXANS: COMPANY OVERVIEW
- TABLE 114 NEXANS: PRODUCTS/SOLUTIONS/SERVICES OFFERED
- TABLE 115 NEXANS: DEALS
- TABLE 116 NEXANS: OTHERS
- TABLE 117 NKT A/S: COMPANY OVERVIEW
- TABLE 118 NKT A/S: PRODUCTS/SOLUTIONS/SERVICES OFFERED
- TABLE 119 NKT A/S: PRODUCT LAUNCHES
- TABLE 120 NKT A/S: DEALS
- TABLE 121 NKT A/S: OTHERS
- TABLE 122 LS CABLE & SYSTEM LTD.: COMPANY OVERVIEW
- TABLE 123 LS CABLE & SYSTEM LTD.: PRODUCTS/SOLUTIONS/SERVICES OFFERED
- TABLE 124 LS CABLE & SYSTEM LTD.: OTHERS
- TABLE 125 FURUKAWA ELECTRIC CO., LTD.: COMPANY OVERVIEW
- TABLE 126 FURUKAWA ELECTRIC CO., LTD.: PRODUCTS/SOLUTIONS/SERVICES OFFERED
- TABLE 127 FURUKAWA ELECTRIC CO., LTD.: OTHERS
- TABLE 128 ZTT: COMPANY OVERVIEW
- TABLE 129 ZTT: PRODUCTS/SOLUTIONS/SERVICES OFFERED
- TABLE 130 ZTT: OTHERS
- TABLE 131 KEI INDUSTRIES LIMITED: COMPANY OVERVIEW
- TABLE 132 KEI INDUSTRIES LIMITED: PRODUCTS/SOLUTIONS/SERVICES OFFERED
- TABLE 133 KEI INDUSTRIES LIMITED: DEALS
- TABLE 134 TFKABLE: COMPANY OVERVIEW
- TABLE 135 TFKABLE: PRODUCTS/SOLUTIONS/SERVICES OFFERED
- TABLE 136 TAIHAN CABLE & SOLUTION CO., LTD.: COMPANY OVERVIEW
- TABLE 137 TAIHAN CABLE & SOLUTION CO., LTD.: PRODUCTS/SOLUTIONS/ SERVICES OFFERED
- TABLE 138 TAIHAN CABLE & SOLUTION CO., LTD.: OTHERS
- TABLE 139 HENGTONG GROUP CO., LTD: COMPANY OVERVIEW
- TABLE 140 HENGTONG GROUP CO., LTD: PRODUCTS/SOLUTIONS/SERVICES OFFERED
- TABLE 141 HENGTONG GROUP CO., LTD: OTHERS
- TABLE 142 TRATOS: COMPANY OVERVIEW
- TABLE 143 TRATOS: PRODUCTS/SOLUTIONS/SERVICES OFFERED
- TABLE 144 TRATOS: OTHERS
- TABLE 145 HYDRO GROUP: COMPANY OVERVIEW
- TABLE 146 HYDRO GROUP: PRODUCTS/SOLUTIONS/SERVICES OFFERED
- TABLE 147 THE OKONITE COMPANY: COMPANY OVERVIEW
- TABLE 148 THE OKONITE COMPANY: PRODUCTS/SOLUTIONS/SERVICES OFFERED
- TABLE 149 HELLENIC CABLES: COMPANY OVERVIEW
- TABLE 150 HELLENIC CABLES: PRODUCTS/SOLUTIONS/SERVICES OFFERED
- TABLE 151 HELLENIC CABLES: OTHERS
- FIGURE 1 MARKET: RESEARCH DESIGN
- FIGURE 2 DATA TRIANGULATION
- FIGURE 3 MAIN METRICS CONSIDERED TO ANALYZE AND ASSESS DEMAND FOR SUBMARINE POWER CABLE
- FIGURE 4 MARKET SIZE ESTIMATION METHODOLOGY: BOTTOM-UP APPROACH
- FIGURE 5 MARKET SIZE ESTIMATION METHODOLOGY: TOP-DOWN APPROACH
- FIGURE 6 KEY STEPS CONSIDERED TO ASSESS SUPPLY OF SUBMARINE POWER CABLE
- FIGURE 7 MARKET: SUPPLY-SIDE ANALYSIS
- FIGURE 8 COMPANY REVENUE ANALYSIS, 2022
- FIGURE 9 SINGLE-CORE SEGMENT TO HOLD LARGER MARKET SHARE DURING FORECAST PERIOD
- FIGURE 10 DC SEGMENT TO DISPLAY HIGHER CAGR, BY TYPE, DURING FORECAST PERIOD
- FIGURE 11 COPPER SEGMENT TO DOMINATE MARKET THROUGHOUT FORECAST PERIOD
- FIGURE 12 HIGH VOLTAGE SEGMENT TO EXHIBIT GREATER CAGR DURING FORECAST PERIOD
- FIGURE 13 OFFSHORE WIND POWER GENERATION SEGMENT TO LEAD MARKET DURING FORECAST PERIOD
- FIGURE 14 EUROPE ACCOUNTED FOR LARGEST SHARE IN GLOBAL SUBMARINE POWER MARKET IN 2022
- FIGURE 15 GROWING ADOPTION OF OFFSHORE SOLUTIONS AND GOVERNMENT MANDATES TO FAVOR MARKET GROWTH
- FIGURE 16 INDUSTRIAL SEGMENT AND CHINA HELD LARGEST SHARES IN 2022
- FIGURE 17 SINGLE CORE SEGMENT TO ACCOUNT FOR LARGER MARKET SHARE IN 2028
- FIGURE 18 DC SEGMENT TO DOMINATE MARKET IN 2028
- FIGURE 19 ALUMINUM SEGMENT TO CLAIM LARGER MARKET SHARE IN 2028
- FIGURE 20 HIGH VOLTAGE SEGMENT TO DOMINATE MARKET IN 2028
- FIGURE 21 OFFSHORE WIND POWER GENERATION SEGMENT TO CAPTURE LARGEST MARKET SHARE IN 2028
- FIGURE 22 MARKET: DRIVERS, RESTRAINTS, OPPORTUNITIES, AND CHALLENGES
- FIGURE 23 GLOBAL OFFSHORE INSTALLATIONS, 2012–2021
- FIGURE 24 FACTORS CAUSING SUBMARINE POWER CABLE FAULTS
- FIGURE 25 GLOBAL NOMINAL PRICES FOR ALUMINUM AND COPPER, 2020-2023
- FIGURE 26 REVENUE SHIFT AND NEW REVENUE POCKETS FOR PLAYERS IN MARKET
- FIGURE 27 MARKET: ECOSYSTEM ANALYSIS
- FIGURE 28 MARKET: VALUE CHAIN ANALYSIS
- FIGURE 29 AVERAGE SELLING PRICE OF SUBMARINE POWER CABLE, BY TYPE
- FIGURE 30 AVERAGE SELLING PRICE OF SUBMARINE POWER CABLE, BY REGION, 2021–2028
- FIGURE 31 IMPORT AND EXPORT SCENARIO FOR PRODUCTS UNDER HS CODE: 8544, 2018–2022
- FIGURE 32 MARKET: PORTER’S FIVE FORCES ANALYSIS
- FIGURE 33 INFLUENCE OF STAKEHOLDERS ON BUYING PROCESS FOR TOP THREE END USES
- FIGURE 34 KEY BUYING CRITERIA FOR TOP THREE END USES
- FIGURE 35 MARKET, BY CORE TYPE, 2022
- FIGURE 36 MARKET, BY TYPE, 2022
- FIGURE 37 MARKET, BY VOLTAGE, 2022
- FIGURE 38 MARKET, BY CONDUCTOR MATERIAL, 2022
- FIGURE 39 MARKET, BY END USE, 2022
- FIGURE 40 NORTH AMERICA TO DISPLAY HIGHEST CAGR DURING FORECAST PERIOD
- FIGURE 41 EUROPE DOMINATED GLOBAL MARKET IN 2022
- FIGURE 42 EUROPE: MARKET SNAPSHOT
- FIGURE 43 ASIA PACIFIC: MARKET SNAPSHOT
- FIGURE 44 MARKET SHARE ANALYSIS, 2022
- FIGURE 45 MARKET SHARE ANALYSIS OF KEY PLAYERS, 2022
- FIGURE 46 MARKET: REVENUE ANALYSIS OF TOP FIVE PLAYERS, 2018–2022
- FIGURE 47 MARKET: EVALUATION MATRIX OF KEY COMPANIES, 2022
- FIGURE 48 SUMITOMO ELECTRIC INDUSTRIES, LTD.: COMPANY SNAPSHOT
- FIGURE 49 PRYSMIAN GROUP: COMPANY SNAPSHOT
- FIGURE 50 NEXANS: COMPANY SNAPSHOT
- FIGURE 51 NKT A/S: COMPANY SNAPSHOT
- FIGURE 52 LS CABLE & SYSTEM LTD.: COMPANY SNAPSHOT
- FIGURE 53 FURUKAWA ELECTRIC CO., LTD.: COMPANY SNAPSHOT
- FIGURE 54 ZTT: COMPANY SNAPSHOT
- FIGURE 55 KEI INDUSTRIES LIMITED: COMPANY SNAPSHOT
- FIGURE 56 TAIHAN CABLE & SOLUTION CO., LTD.: COMPANY SNAPSHOT
The study involved major activities in estimating the current size of the Submarine Power Cable market. Exhaustive secondary research was done to collect information on the peer and parent markets. The next step was to validate these findings, assumptions, and sizing with industry experts across the value chain through primary research. Both top-down and bottom-up approaches were employed to estimate the complete market size. Thereafter, market breakdown and data triangulation were used to estimate the market size of the segments and subsegments.
Secondary Research
This research study on the Submarine Power Cable market involved the use of extensive secondary sources, directories, and databases, such as Hoovers, Bloomberg, Businessweek, Factiva, International Energy Agency, and BP Statistical Review of World Energy, to identify and collect information useful for a technical, market-oriented, and commercial study of the global Submarine Power Cable market. The other secondary sources included annual reports, press releases & investor presentations of companies, white papers, certified publications, articles by recognized authors, manufacturer associations, trade directories, and databases.
Primary Research
The Submarine Power Cable market comprises several stakeholders such as generator manufacturers, manufacturers of subcomponents of Submarine Power Cable, manufacturing technology providers, and technology support providers in the supply chain. The demand side of this market is characterized by the rising offshore wind energy installations. The supply side is characterized by rising demand for contracts from the industrial sector, and mergers & acquisitions among big players. Various primary sources from both the supply and demand sides of the market were interviewed to obtain qualitative and quantitative information. Following is the breakdown of primary respondents:
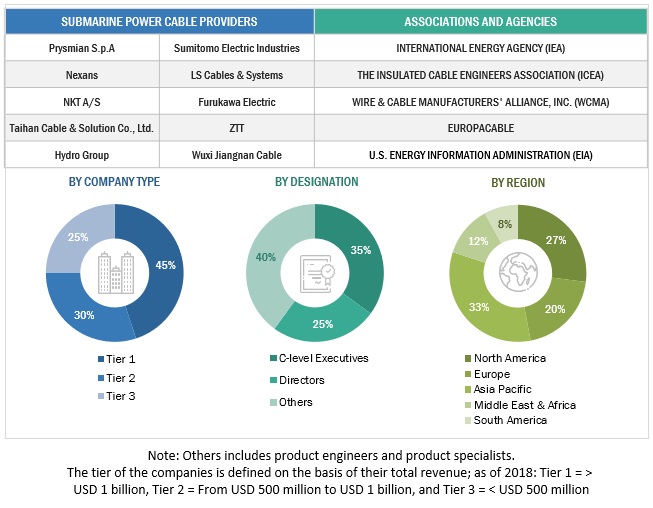
To know about the assumptions considered for the study, download the pdf brochure
Market Size Estimation
Both top-down and bottom-up approaches were used to estimate and validate the total size of the Submarine Power Cable market. These methods were also used extensively to estimate the size of various subsegments in the market. The research methodology used to estimate the market size includes the following:
- The key players in the industry and market have been identified through extensive secondary research, and their market share in the respective regions have been determined through both primary and secondary research.
- The industry’s value chain and market size, in terms of value, have been determined through primary and secondary research processes.
- All percentage shares, splits, and breakdowns have been determined using secondary sources and verified through primary sources.
Global Submarine Power Cable Market Size: Top-down Approach
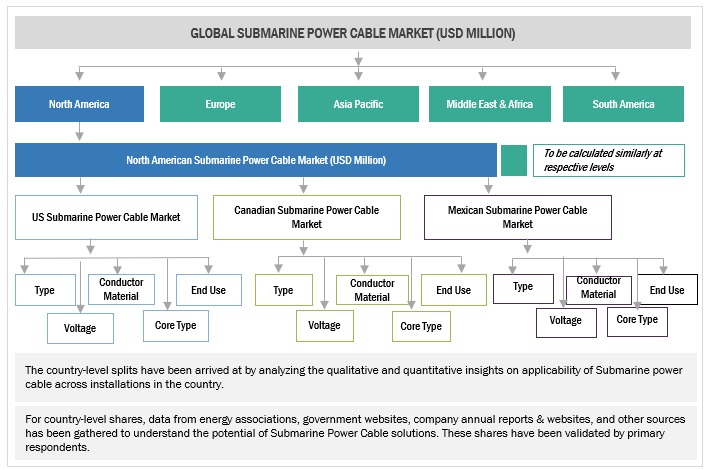
To know about the assumptions considered for the study, Request for Free Sample Report
Global Submarine Power Cable Market Size: Bottom-Up Approach
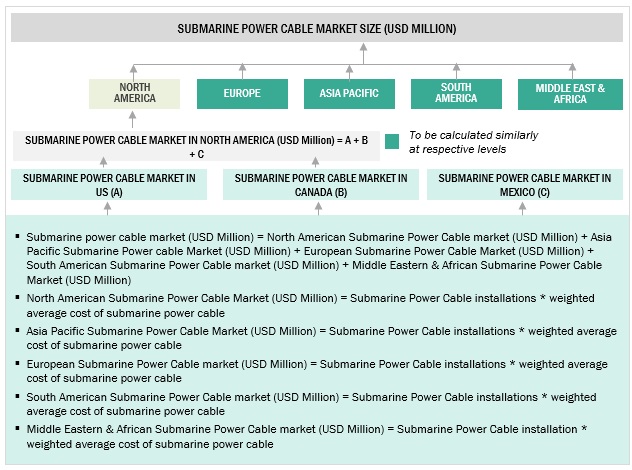
Data Triangulation
After arriving at the overall market size from the estimation process explained above, the total market has been split into several segments and subsegments. To complete the overall market engineering process and arrive at the exact statistics for all the segments and subsegments, the data triangulation and market breakdown processes have been employed, wherever applicable. The data has been triangulated by studying various factors and trends from both the demand- and supply sides. Along with this, the market has been validated using both the top-down and bottom-up approaches.
Market Definition
A hybrid power solution refers to a unit that combines multiple sources of energy generation to produce electricity. It typically integrates renewable energy sources, such as solar, and wind, with conventional power technologies like diesel generators. The combination of these sources allows for increased efficiency, reliability, and flexibility in electricity production.
Key Stakeholders
- Government & research organizations
- Institutional investors and investment banks
- Investors/shareholders
- Environmental research institutes
Objectives of the Study
- To define, describe, segment, and forecast the Submarine Power Cable market, in terms of value and volume, on the basis of system type, end user, grid connectivity, power rating, and region
- To forecast the market size for five key regions: North America, South America, Europe, Asia Pacific, and Middle East & Africa, along with their key countries
- To provide detailed information about the key drivers, restraints, opportunities, and challenges influencing the growth of the market
- To strategically analyze the subsegments with respect to individual growth trends, prospects, and contributions of each segment to the overall market size
- To analyze market opportunities for stakeholders and the competitive landscape of the market
- To strategically profile the key players and comprehensively analyze their market shares and core competencies
- To analyze competitive developments, such as sales contracts, agreements, investments, expansions, new product launches, mergers, partnerships, collaborations, and acquisitions, in the market
Available Customizations:
With the given market data, MarketsandMarkets offers customizations as per the client’s specific needs. The following customization options are available for this report:
Geographic Analysis
- Further breakdown of region or country-specific analysis
Company Information
- Detailed analyses and profiling of additional market players (up to 5)


Growth opportunities and latent adjacency in Submarine Power Cable Market