Cables and Connectors Market for Satellite and Submarine Industries by Components (Cable and Cable Assemblies, Connectors and Others), Application (Testing and Manufacturing), Industries and Geography- Analysis and Forecast (2014-2020)


The cables, cable assemblies, and connectors play a crucial role in the integration of various systems & subsystems of the space satellites and submarine infrastructure. Both the industries require Cable Connectors Market which can withstand a harsh environment in order to operate in varying atmospheric conditions. Secondly, lighter and smaller components with reliable efficiency are preferred in the satellite & submarine industries, which create an opportunity for the manufacturers to design highly efficient, standardized as well as customized cables and connectors for these industries.
The factors that are driving the use of the Cable Connectors Market in satellite and submarine industries include the trend of satellite miniaturization, the demand for high speed connectivity networks, and heavy investments in offshore wind projects. However, the major restraints for the growth of the market are entry barriers for start-ups & SMEs, and natural disaster & maritime threats which may affect the submarine cable networks. The globally expanding demand for application-specific cables and connectors is expected to create a lot of opportunities for the growth of the said market.
Scope of the report:
This report categorizes the global Cable Connectors Market on the basis of component, application, industry, and geography.
Market based on component:
The Cable Connectors Market, based on component, has been segmented into three types; namely cable & cable assemblies, electronic & mechanical connectors, and other components. The cable & cable assemblies have been further segmented into high data rate cables, power/signal delivery cables, RF microwave cables, and others.
Market on the basis of application:
The applications of the cables & connectors in the satellite and submarine industries include testing and manufacturing/production.
Market based on industry:
The industry analysis of the Cable Connectors Market covers the satellite and submarine industries. The satellite industry has been further segmented into sub-industries such as military & defense, commercial, civil, and government.
Similarly, the submarine industry has been segmented into sub-industries as oil & gas, energy & power, submarine communication, and others.
Market based on geography:
The geographic analysis covers The Americas, Europe, Asia-Pacific, and Rest of the World (RoW). The cross segmentation data included in the report provides an in-depth insight into the regional markets.
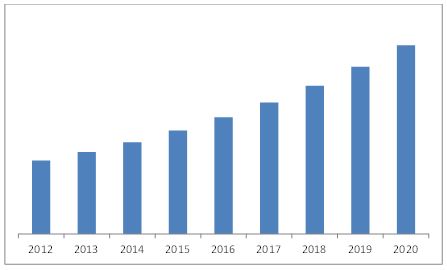
The total Cable Connectors Market was valued at $18.90 billion in 2013 and is expected to reach up to $43.55 billion by 2020, at a CAGR of 12.76% between 2014 and 2020.
This report on the cables and connectors market is aimed towards analyzing the major industry segments such as satellite and submarine industries for the same.
Factors such as satellite miniaturization, heavy investment in submarines for military modernization, and the demand for high-speed connectivity are driving the growth of the cables and connectors market, in the European region, especially in Germany. This report profiles all the major companies involved in the submarine & satellite cable and connectors market such as Alcatel-Lucent (France), Amphenol Corp. (U.S.), TE Connectivity Ltd. (Switzerland), Prysmian Group (Italy), Nexans S.A (France), Fujitsu (Japan), Axon Cables (France), Molex, Inc. (U.S.), Esterline Technologies Corp. (U.S.), and Huawei Technologies Co. Ltd. (China).
The Cable Connectors Market has classified based on components into cable & cable assemblies, electronic & mechanical connectors, and others. In terms of application, the cables and connectors market has been segmented into testing and manufacturing/ production. The cables and connectors submarine industry is further segmented into oil & gas, energy & power, and submarine communication. Similarly, the satellite industry is further segmented into military & defense, commercial, civil, and government. The growth of the market in Europe can be attributed to the increasing number of projects in the offshore wind connections and submarine interconnections market and moderate pricing pressure among the suppliers.
Cables and Connectors Market (2012 - 2020)
Source: MarketsandMarkets Analysis
 Exclusive indicates content/data unique to MarketsandMarkets and not available with any competitors.
Table of Contents
1 Introduction (Page No. - 14)
1.1 Study Objectives
1.2 Cable Connectors Market Definition
1.3 Study Scope
1.3.1 Markets Covered
1.3.2 Geographic Scope
1.3.3 Years Considered for the Study
1.4 Currency & Pricing
1.5 Limitations
1.6 Stakeholders
2 Research Methodology (Page No. - 18)
2.1 Research Data
2.1.1 Secondary Data
2.1.1.1 Key Data From Secondary Sources
2.1.2 Primary Data
2.1.2.1 Key Data From Primary Sources
2.1.2.2 Key Industry Insights
2.1.2.3 Breakdown of Primaries Interviews: By Company Type, Designation, and Region
2.2 Factor Analysis
2.2.1 Introduction
2.2.2 Demand-Side Analysis
2.2.2.1 Demand for Higher Bandwidth in Telecom Industry
2.2.2.2 Future Prospects in Submarine Industry Offshore Projects
2.2.3 Supply-Side Analysis
2.2.3.1 Reduction in Construction Cost for Submarine Cables
2.2.3.2 Customization of Cables and Connectors in the Satellite and Submarine Industries
2.3 Cable Connectors Market Size Estimation
2.3.1 Bottom-Up Approach
2.3.2 Top-Down Approach
2.4 Cable Connectors Market Breakdown and Data Triangulation
2.5 Research Assumptions and Limitations
2.5.1 Assumptions
3 Executive Summary (Page No. - 31)
4 Premium Insights (Page No. - 36)
4.1 Increasing Opportunities in the Satellite & Submarine Industries
4.2 Cable Connectors Market: By Component
4.3 APAC Region is Expected to be the Fastest Growing Region During the Forecast Period
4.4 The European Region Accounts for the Largest Market Share in the Global Cable Connectors Market
4.5 Growth Rate Comparison Between the Major Countries Between 2014 to 2020
4.6 Life Cycle Analysis, By Region
5 Market Overview (Page No. - 42)
5.1 Cable Connectors Market Segmentation
5.1.1 Cable Connectors Market, By Component
5.1.2 Cable Connectors Market, By Application
5.1.3 Cable Connectors Market, By Industry
5.1.4 Cable Connectors Market, By Geography
5.2 Cable Connectors Markett Dynamics
5.2.1 Drivers
5.2.1.1 Satellite Miniaturization
5.2.1.2 Demand for High-Speed Connectivity
5.2.2 Restraints
5.2.2.1 Natural Disaster & Maritime Threats Affect Submarine Cables
5.2.2.2 Entry Barriers for Start-Ups and Smes
5.2.3 Opportunities
5.2.3.1 Upcoming Application and Services
5.2.3.2 Huge Investments Made in Offshore Wind Energy Projects
5.2.4 Challenges
5.2.4.1 Standardization of Components
5.2.4.2 Decrease in the Quality of Products and Devices
5.2.5 Winning Imperatives
5.2.5.1 Increased Competition Among Economies
6 Industry Trends (Page No. - 54)
6.1 Introduction
6.2 Value Chain Analysis
6.3 Porter’s Five Forces Analysis
6.3.1 Intensity of Competitive Rivalry
6.3.2 Threat From Substitutes
6.3.3 Bargaining Power of Buyers
6.3.4 Bargaining Power of Suppliers
6.3.5 Threats From New Entrants
6.4 Strategic Benchmarking
6.4.1 Technology Integration and Product Enhancement
7 Submarine & Satellite Cable and Connectors Market, By Component (Page No. - 65)
7.1 Introduction
7.2 Cable & Cable Assemblies
7.3 Electronic & Mechanical Connectors
7.4 Other Components
8 Submarine & Satellite Cable and Connectors Market, By Application (Page No. - 74)
8.1 Introduction
8.2 Testing
8.3 Manufacturing/Production
9 Submarine & Satellite Cable and Connectors Market, By Industry (Page No. - 80)
9.1 Introduction
9.2 Satellite Industry
9.2.1 Military & Defense
9.2.2 Commercial
9.2.3 Civil
9.2.4 Government
9.3 Submarine Industry
9.3.1 Oil & Gas
9.3.2 Energy & Power
9.3.3 Submarine Communication
9.3.4 Others
10 Geographic Analysis (Page No. - 101)
10.1 Introduction
10.2 Americas
10.3 Europe
10.4 Asia-Pacific
10.5 Rest of the World
11 Competitive Landscape (Page No. - 124)
11.1 Overview
11.2 Market Ranking for Cable Connectors Market
11.3 Competitive Scenario
11.4 Recent Developments
11.4.1 New Product Launches
11.4.2 Partnerships, Agreements, and Contracts & Collaborations
11.4.3 Mergers and Acquisitions
11.4.4 Expansions
11.4.5 Other Developments
12 Company Profiles (Page No. - 133)
12.1 Introduction
12.2 Alcatel-Lucent
12.3 Amphenol Corp.
12.4 Axon Cable
12.5 Esterline Technologies Corp.
12.6 Fujitsu
12.7 Huawei Technologies Co. Ltd.
12.8 Molex, Inc.
12.9 Nexans S.A.
12.10 Prysmian Group
12.11 TE Connectivity Ltd.
13 Appendix (Page No. - 159)
13.1 Insights of Industry Experts
13.2 Discussion Guide
13.3 Introducing RT: Real Time Market Intelligence
13.4 Available Customizations
13.5 Related Reports
List of Tables (72 Tables)
Table 1 List of a Few Upcoming Offshore Projects in the Oil & Gas Sector, 2015
Table 2 Demand for High-Speed Connectivity is Propelling the Growth of the Cable Connectors Market
Table 3 Repairing Costs in Submarine Cables Act As a Restraint for the Cable Connectors Market
Table 4 Growth in Satellite and Submarine Industries is a Huge Opportunity in the Market
Table 5 Porter’s Five Forces Analysis: Threat From Substitutes Likely to Have a Minimum Impact on the Overall Market
Table 6 Cable Connectors Market, By Component ($Billion), 2012-2020
Table 7 Cable & Cable Assemblies Market, By Type ($Million), 2012-2020
Table 8 Cables & Cable Assemblies Market, By Application ($Million), 2012-2020
Table 9 Electronic & Mechanical Connectors Market, By Types, ($Million), 2012-2020
Table 10 Electronic & Mechanical Connectors Market, By Application ($Million), 2012-2020
Table 11 Other Components Market, By Type ($Million), 2012-2020
Table 12 Other Components Market, By Application ($Million), 2012-2020
Table 13 Cable Connectors Market, By Application ($Billion), 2012-2020
Table 14 Cables & Connectors Testing Market, By Industry ($Million), 2012-2020
Table 15 Market, By Component ($Million), 2012-2020
Table 16 Cables & Connectors Manufacturing Market, By Industry ($Million), 2012-2020
Table 17 Cable Connectors Market, By Component ($Million), 2012-2020
Table 18 Cable Connectors Market, By Industry ($Billion), 2012-2020
Table 19 Satellite Industry Cables & Connectors Market, By Sub-Segment ($Million), 2012-2020
Table 20 Cables & Connectors Satellite Industry Market, By Application ($Million), 2012-2020
Table 21 Satellite Industry Cables & Connectors Market, By Region ($Million), 2012-2020
Table 22 The Americas Cables & Connectors Satellite Industry Market, By Region ($Million), 2012-2020
Table 23 North Americas Cable Connectors Market, By Country ($Million), 2012-2020
Table 24 European Cable Connectors Market, By Country ($Million), 2012-2020
Table 25 APAC Cable Connectors Market, By Country ($Million), 2012-2020
Table 26 ROW Cables & Connectors Satellite Industry Market, By Region ($Million), 2012-2020
Table 27 Satellite Industry Cables & Connectors Military & Defence Market, By Region ($Million), 2012-2020
Table 28 Satellite Industry Cables & Connectors Commercial Market, By Region ($Million), 2012-2020
Table 29 Satellite Industry Cables & Connectors Civil Market, By Region ($Million), 2012-2020
Table 30 Satellite Industry Cables & Connectors Government Market, By Region ($Million), 2012-2020
Table 31 Submarine Industry Cables & Connectors Market, By Sub-Segment ($Million), 2012-2020
Table 32 Cables & Connectors Submarine Industry Market, By Application ($Million), 2012-2020
Table 33 Submarine Industry Cables & Connectors Market, By Region ($Million), 2012-2020
Table 34 The Americas Cables & Connectors Submarine Industry Market, By Region ($Million), 2012-2020
Table 35 North America Cables& Connectors Submarine Industry Market, By Country ($Million), 2012-2020
Table 36 European Cables & Connectors Submarine Industry Market, By Country ($Million), 2012-2020
Table 37 APAC Cables & Connectors Submarine Industry Market, By Country ($Million), 2012-2020
Table 38 ROW Cables & Connectors Submarine Industry Market, By Region ($Million), 2012-2020
Table 39 Submarine Industry Cables & Connectors Oil & Gas Market, By Region ($Million), 2012-2020
Table 40 Submarine Industry Cables & Connectors Energy & Power Market, By Region ($Million), 2012-2020
Table 41 Submarine Industry Cables & Connectors Submarine Communication Market, By Region ($Million), 2012-2020
Table 42 Submarine Industry Cables and Connectors Others Market, By Region ($Million), 2012-2020
Table 43 Global Cable Connectors Market, By Geography ($Million), 2012-2020
Table 44 The Americas Cables & Connectors Market, By Industry ($Million), 2012-2020
Table 45 Global Cable Connectors Market, By Americas ($Million), 2012-2020
Table 46 North American Cable Connectors Market, By Country ($Million), 2012-2020
Table 47 North American Cable Connectors Market, By Industry ($Million), 2012-2020
Table 48 The U. S Cable Connectors Market, By Industry ($Million), 2012-2020
Table 49 The Others Region Cable Connectors Market, By Industry ($Million), 2012-2020
Table 50 South American Cable Connectors Market, By Industry ($Million), 2012-2020
Table 51 Europe: Cable Connectors Market, By Industry ($Million), 2012-2020
Table 52 Europe: Cable Connectors Market, By Country ($Million), 2012-2020
Table 53 U.K.: Cable Connectors Market, By Industry ($Million), 2012-2020
Table 54 Germany: Cable Connectors Market, By Industry ($Million), 2012-2020
Table 55 France: Cable Connectors Market, By Industry ($Million), 2012-2020
Table 56 Italy: Cable Connectors Market, By Industry ($Million), 2012-2020
Table 57 Others Cable Connectors Market, By Industry ($Million), 2012-2020
Table 58 APAC: Cable Connectors Market, By Industry ($Million), 2012-2020
Table 59 APAC: Cable Connectors Market, By Country ($Million), 2012-2020
Table 60 China: Cables and Connectors Market, By Industry ($Million), 2012-2020
Table 61 Japan: Market, By Industry ($Million), 2012-2020
Table 62 South Korea: Cables and Connectors Market, By Industry ($Million), 2012-2020
Table 63 Others Cables and Connectors Market, By Industry ($Million), 2012-2020
Table 64 ROW: Cables and Connectors Market, By Industry ($Million), 2012-2020
Table 65 ROW: Market, By Country ($Million), 2012-2020
Table 66 Middle East: Cables and Connectors Market, By Industry ($Million), 2012-2020
Table 67 Africa: Cables and Connectors Market, By Industry ($Million), 2012-2020
Table 68 New Product Launches, 2013-2015
Table 69 Partnerships, Agreements, and Contracts & Collaborations, 2013-2015
Table 70 Mergers and Acquisitions
Table 71 Expansions
Table 72 Other Developments
List of Figures (90 Figures)
Figure 1 Research Design & Factor Analysis
Figure 2 Worldwide International Bandwidth Growth, 2009-2013
Figure 3 Worldwide Oil and Gas Offshore Projects Till Date, 2013
Figure 4 Submarine Cable Construction Cost Analysis, ($Billion), 2010-2014
Figure 5 More Demand for Custom Cables & Connectors in Both the Industries, in 2013
Figure 6 Market Size Estimation Methodology: Bottom-Up Approach
Figure 7 Market Size Estimation Methodology: Top-Down Approach
Figure 8 Assumptions for the Research Study
Figure 9 The Submarine Industry is Estimated to Account for the Highest Market Share During the Forecast Period
Figure 10 The Manufacturing/ Production Application is Expected to Witness High Growth in the Submarine Market During the Forecast Period
Figure 11 Cable & Cable Assemblies Accounted for the Maximum Share of the Cables & Connectors Component Market in 2014
Figure 12 Power/Signal Delivery Cables is Expected to Grow at the Fastest CAGR Between 2014 and 2020
Figure 13 Europe Accounted for the Largest Market Share in the Cables & Connectors Market in 2013
Figure 14 Significant Increase in Demand for Cables & Connectors During the Forecast Period
Figure 15 The Cable & Cable Assemblies Market is Expected to Grow at the Highest CAGR During the Forecast Period
Figure 16 China is Estimated to Hold the Highest Market Share in APAC Till 2020
Figure 17 Germany was the Key Contributor With the Largest Share in the European Market, Followed By France
Figure 18 APAC Countries Are Projected to Grow at a Faster CAGR Compared to the European Countries and the U.S.
Figure 19 the Cables & Connectors Market is Currently in the Maturity Stage in the APAC and European Regions (2013)
Figure 20 Cables & Connectors Market: Segmentation
Figure 21 Market Segmentation: By Component
Figure 22 Market Segmentation: By Application
Figure 23 Market Segmentation: By Industry
Figure 24 Market Segmentation: By Geography
Figure 25 Demand for High-Speed Connectivity is Expected to Spur the Demand for Cables and Connectors Market
Figure 26 Number of Miniaturized Satellite Launches Till 2013
Figure 27 Investments in New Submarine Fiber Optic Projects, ($Billion), 2008- 2012
Figure 28 40% of Submarine Cable Damages Has Been Due to Fishing, Till 2014
Figure 29 Industry Life-Cycle of Cables and Connectors in Satellite and Submarine Application, 2014
Figure 30 Value Chain Analysis (2014): Major Value is Added During the Manufacturing and Assembly Phase
Figure 31 Porter’s Five Forces Analysis (2014):
Figure 32 Cables & Connectors: Porter’s Five Forces Analysis
Figure 33 Intensity of Competitive Rivalry: High Competition in the Market Due to the Presence of a Large Number of Players
Figure 34 Threats From Substitutes: Threats From Substitutes Will be Low Due to the Less Availability of Substitute Products & Technology
Figure 35 Bargaining Power of Buyers: As the Adoption Rate of Buyers is Low, They Will Have a Moderate Bargaining Power
Figure 36 Bargaining Power of Suppliers: Quality Factor Will Drive the Switching of Suppliers By Buyers in Future
Figure 37 Threats From New Entrants: Higher Market Growth Rate Likely to Attract New Entrants
Figure 38 Strategic Benchmarking: Key Players Largely Adopted Inorganic Growth Strategies for Technology Integration and Product Enhancement
Figure 39 Cables & Connectors Market: Segmentation of Components
Figure 40 Cables & Connectors Market for Satellite and Submarine Industries 2014 – 2020
Figure 41 Cable & Cable Assemblies Market for Satellite & Submarine Industries, 2014-2020
Figure 42 Electronic & Mechanical Connectors Market for Satellite & Submarine Industries, 2014-2020
Figure 43 Other Components Market for Satellite and Submarine Industries, 2014-2020
Figure 44 Cables & Connectors Market Segmentation, By Application
Figure 45 Manufacturing/Production: The Fastest Growing Application in the Cables & Connectors Market Between 2014 and 2020
Figure 46 Cables & Connectors Testing Market Comparison, By Component, 2014 Vs 2020
Figure 47 Cables & Connectors Manufacturing Market Comparison, By Component, 2014 Vs 2020
Figure 48 Segmentation of Cables & Connectors Market, By Industry
Figure 49 Submarine Industry is Expected to Have the Largest Share in the Cables & Connectors Market From 2014–2020
Figure 50 Satellite Industry Cables & Connectors Market: Government Satellites Registered the Highest CAGR During the Forecasted Period
Figure 51 Satellite Industry Cables & Connectors Market, By Region
Figure 52 Segmentation of Satellite Industry
Figure 53 Submarine Industry Cables & Connectors Market: Demand is Dominated By Submarine Communication in the Forecasted Period
Figure 54 Submarine Industry Cables & Connectors Market, By Region
Figure 55 Segmentation of Submarine Industry
Figure 56 Market for Satellite and Submarine Industries, By Geography
Figure 57 Geographic Snapshot (2013)- APAC Region is Estimated to Register the Highest Growth Rate During the Forecast Period
Figure 58 Japan is Estimated to Grow at the Highest Rate Among All Countries in the Cables and Connectors Market Between 2014 and 2020
Figure 59 Americas Market Snapshot: The Demand Would be Driven By the Increase in Projects in the Submarine Interconnections Market
Figure 60 Americas Cables & Connectors Market Comparison, By Industry, 2014 Vs 2020
Figure 61 Americas Market: Segmentation
Figure 62 South American Cables & Connectors Market Comparison, By Industry, 2014 Vs 2020
Figure 63 Europe Market Snapshot: The Demand Would be Driven By the Moderate Pricing Pressure Among the Submarine Interconnections Market Suppliers
Figure 64 Europe: Cables & Connectors Market: Segmentation
Figure 65 Italy: Cables & Connectors Market Comparison, By Industry, 2014 Vs 2020
Figure 66 APAC Market Snapshot: The Demand Would be Driven By the Growing Chinese Economy
Figure 67 APAC Cables & Connectors Market: Segmentation
Figure 68 South Korea: Market Comparison, By Industry, 2014 vs 2020
Figure 69 ROW: Cables & Connectors Market: Segmentation
Figure 70 Key Growth Strategies Adopted By the Top Companies Over the Last Three Years, 2012-2014
Figure 71 Amphenol Corp. and Prysmian Group Grew at the Fastest Rate Between 2011 and 2013
Figure 72 Market Ranking of the Top 5 Players in the Cables and Connectors Market, 2013
Figure 73 Market Evaluation Framework-New Product Launches Fuelled Growth and Innovation in 2013 and 2014
Figure 74 Battle for Market Share: New Product Launches was the Key Strategy
Figure 75 Geographic Revenue Mix of the Top Five Market Players
Figure 76 Alcatel-Lucent: Company Snapshot
Figure 77 SWOT Analysis
Figure 78 Amphenol Corp.: Company Snapshot
Figure 79 SWOT Analysis
Figure 80 Axon Cable: Company Snapshot
Figure 81 Esterline Technologies Corp.: Company Snapshot
Figure 82 Fujitsu: Company Snapshot
Figure 83 Huawei Technologies Co. Ltd.: Company Snapshot
Figure 84 Molex, Inc.: Company Snapshot
Figure 85 Nexans S.A.: Company Snapshot
Figure 86 SWOT Analysis
Figure 87 Prysmian Group: Company Snapshot
Figure 88 SWOT Analysis
Figure 89 TE Connectivity Ltd.: Company Snapshot
Figure 90 SWOT Analysis
This Cables and Connectors Market Research Report is based on a comprehensive and structured research methodology designed to provide accurate, data-driven insights into global market trends, growth drivers, technological innovations, and competitive dynamics. The objective of the study is to assess the current landscape and forecast the future potential of cables and connectors across various industries such as automotive, telecommunications, aerospace, consumer electronics, and industrial automation.
The research began with secondary data collection to build a foundational understanding of the market. Key sources included industry databases, government publications, trade journals, whitepapers, and annual reports of major market players. Information from international bodies such as the IEEE, IEC, and various trade associations helped establish a benchmark for understanding global standards, technological developments, and regional adoption patterns.
Following secondary research, primary research was conducted to validate the collected data and gather qualitative insights. Structured interviews and surveys were carried out with manufacturers, suppliers, distributors, and end-users. This step helped to understand demand fluctuations, pricing strategies, supply chain challenges, and evolving customer requirements in real time. The expert opinions collected also added context to the trends and forecasts derived from secondary research.
For market size estimation and forecasting, a dual approach was used, combining top-down and bottom-up methods. The bottom-up approach involved aggregating revenue and shipment data from leading companies and product categories. The top-down method cross-verified these figures using industry-wide financial data and macroeconomic indicators. Forecasts were developed using statistical tools and models, incorporating historical data, growth trends, and scenario-based analysis over a defined forecast period.
The market was segmented by type (e.g., HDMI, USB, fiber optic, coaxial), application (e.g., data transmission, power supply), end-user industry, and region (e.g., North America, Europe, Asia-Pacific, Latin America, Middle East & Africa). Each segment was evaluated for market share, growth potential, and technological innovation. Regional analysis took into account local regulatory frameworks, infrastructure development, and industrial expansion.
Lastly, a rigorous data validation and triangulation process was employed to ensure the accuracy and reliability of the insights. Data points from multiple sources were cross-checked and reviewed by internal analysts. Discrepancies were addressed through follow-up research and expert consultation, ensuring the final output provides a holistic and trustworthy view of the cables and connectors market.


Growth opportunities and latent adjacency in Cables and Connectors Market