Sports & Energy Drinks Market by Types, Ingredients, Distribution Channels, End-Users & Top Brands Trends (Forecast to 2016)


The sports drinks, energy drinks, and nutraceutical drinks form a part of functional drinks; which comes under soft drinks. Sports and energy drinks are very different beverage choices that should be assessed and marketed differently and hence are described separately in the report. Sports and energy drinks differ in their functionality as well. Sports drinks are meant to replenish the fluid lost during exercise or any physical activity; whereas energy drinks are to give you a boost of energy. The report provides full analysis of the world's leading sports and energy drinks brands and markets, with clear insight and market commentary on the main developments and trends. A chronology of developments by region is also covered, ensuring the notification of the latest energy drink developments.
Global demand for sports and energy drinks is expected to grow at a CAGR of more than 10% from 2011 to 2016. Rising health awareness among consumers is playing a major role in the popularity of this beverage. Coca-Cola Company, PepsiCo Inc, GlaxoSmithKline, and Red Bull GmbH are innovating constantly and adding new products to this niche segment. The industry is experimenting with products such as sugar-free or light drinks to attract female consumers. The market is expected to grow as new formulations are launched. Sports and Energy Drinks Market research report segments the global market of sports and energy drinks on the basis of products, major players, and geographies with market dynamics for macro and micro segments. Revenue is forecasted for the market with an in-depth analysis of emerging trends and wining imperatives for the major players in the industry.
With the huge market potential and the growing preference, the market is likely to witness considerable growth in the years to come. The market is anticipated to continue penetrating the untapped markets and older population. The growth of the market is also largely attributed to the developments such as the incorporation of the organic and natural ingredients. The varieties of sports and energy drinks containing organic or natural ingredients are increasing continually at present.
MARKETS COVERED
This report focuses on global sports and energy drinks market. This research categorizes the global sports and energy drinks market on the basis of types, end-users, ingredients, geography, top brands, and distribution channel.
On the basis of geography:
- North America (U.S.)
- Europe (U.K.)
- Asia- Pacific (Japan)
- ROW
On the basis of top brands:
- Sports drinks
- Gatorade
- Powerade
- Others
- Energy drinks
- Red Bull
- Others
On the basis of distribution channel:
- Off-premise (Off-trade)
- Convenience stores
- Supermarkets/hypermarkets
- Mass merchandisers
- Drug stores
- Others
- On-premise (On-trade)
- Food service/sports nutrition chain
- Vending
- Others
SCOPE OF THE REPORT
The report discusses sports and energy drinks market as follows:
- Sports drinks types: (isotonic sports drinks, hypertonic sports drinks, and hypotonic sports drinks)
- Sports drinks end-users: (sportsman/athletes and casual sports drink users)
- Sports drinks ingredients: (electrolytes, carbohydrates, sodium, sugar, preservatives, B-Vitamin, citric acid, and others)
- Energy drinks types: (alcoholic energy drinks and non-alcoholic energy drinks)
- Energy drinks end users: (kids/teenagers, adults and geriatrics)
- Energy drinks ingredients: (caffeine, taurine, guarana, B vitamins, ginseng, ginkgo biloba, L-Carnitine, sugars, antioxidants, and others)
Energy drinks are products that are usually carbonated/fizzy and claim to awaken or provide alertness, or are described as beverages that are marketed as soft drinks with added benefits. Sports drinks are usually non-carbonated beverages, and claimed to rehydrate/replenish, as well as restore minerals, sugar, and the other nutrients usually lost during exercise. Some are also claimed to improve performance and increase endurance.
The global market for energy drinks has grown exponentially in the last few years and young adults are the primary targets of the industry. Now, there are hundreds of sports and energy drinks available in the global market. The market was well-established in 2010 and is expected to grow rapidly. The global market for sports and energy drinks is dominated by a few major companies such as PepsiCo Inc, Coca-Cola Company, and Red Bull GmbH with exception of a few regional markets such as U.K., which are dominated by regional player like Glaceau. At present, youngsters are the main target customer of the sports and energy drinks. However, the customer base is expected to widen to adults including women and children.
Sports and Energy Drinks Market, by Geography, 2011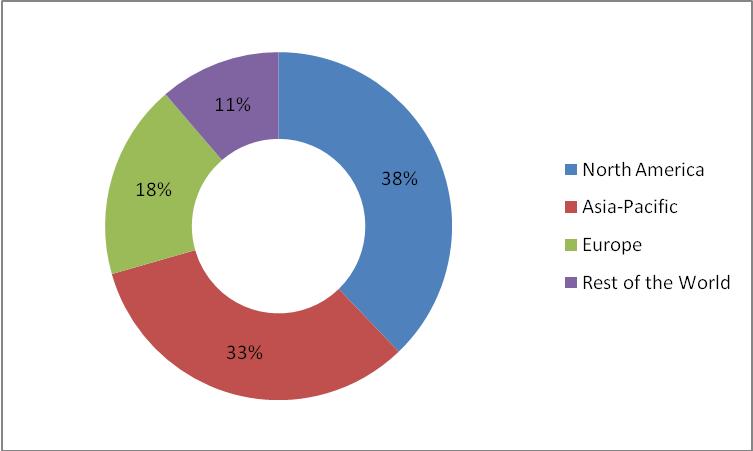
Source: MarketsandMarkets
In the global retail drinks market, �sports and energy drinks� are amongst the fastest growing segments in the world.
Sports and energy drinks are mostly sold through different retail formats such as convenience stores, supermarkets, and hypermarkets and followed by mass merchandisers and drug stores. The upcoming trend becoming popular is vending machines with 7% share in the global sports and energy drinks distribution channel.
Recent product innovation is concentrated on the creation of additive- and preservative-free products that offer increasingly health-conscious consumers a more natural, non-artificial alternative. Suppliers are also making their drinks functional; for example, through the addition of vitamins and minerals. Consumption of sports and energy drinks remains heavily biased towards young men aged 15-25. The consumer base has to be shifted from young to adults to increase market size. Functionality is set to remain the key line of product development in the near future, as manufacturers will need to be able to expand the current core consumer base of young consumers to older people in order to ensure future growth. Replacing the high caffeine content of many energy drinks with herbal formulations will also become an increasingly important area of development. The necessity of expanding the current core consumer base from the young generation to older people is to guarantee future growth. Packaging innovation has resulted in the launch of energy shots and re-sealable cans recently.
 Exclusive indicates content/data unique to MarketsandMarkets and not available with any competitors.
TABLE OF CONTENTS
1 INTRODUCTION
1.1 KEY TAKE-AWAYS
1.2 REPORT DESCRIPTION
1.3 MARKETS COVERED
1.4 STAKEHOLDERS
1.5 RESEARCH METHODOLOGY
1.5.1 MARKET SIZE
1.5.2 COMPANIES COVERED DURING SECONDARY
1.5.3 ASSUMPTIONS
1.5.4 KEY DATA POINTS TAKEN FROM SECONDARY SOURCES
1.5.5 KEY QUESTIONS ANSWERED
2 EXECUTIVE SUMMARY
3 MARKET OVERVIEW
3.1 INTRODUCTION
3.2 BURNING ISSUE
3.2.1 LACK OF STANDARD REGULATIONS
3.2.2 ENERGY DRINKS LABELING REGULATIONS
3.2.3 ENERGY DRINK TAXATION
3.3 WINNING IMPERATIVE
3.3.1 BRAND, LINE & FLAVOR EXTENSIONS
3.3.2 DISTRIBUTION ALLIANCES
3.4 DRIVERS
3.4.1 MAKING DRINKS MORE FUNCTIONAL
3.4.2 HEALTH CONCERNS & PHYSICAL WELL-BEING
3.4.3 SMART MARKETING & INTELLIGENT POSITIONING
3.4.4 PACKAGING INNOVATIONS
3.5 RESTRAINTS
3.5.1 AGING DEMOGRAPHY
3.5.2 HIGH PRODUCT PRICES
3.6 OPPORTUNITIES
3.6.1 RISING DEMAND FROM EMERGING COUNTRIES
3.6.2 NEW TARGET CONSUMER
3.7 PORTER�S FIVE FORCES ANALYSIS
3.7.1 INDUSTRY COMPETITORS & EXTENT OF RIVALRY
3.7.2 THREAT OF NEW ENTRANTS
3.7.3 THREAT OF SUBSTITUTES
3.7.4 BARGAINING POWER OF BUYERS
3.7.4.1 End consumers
3.7.4.2 Retailers
3.7.5 BARGAINING POWER OF SUPPLIERS
3.8 PATENT ANALYSIS
3.9 MARKET SHARE ANALYSIS
3.10 ENERGY SHOTS: OVERVIEW
3.11 SPORTS & ENERGY DRINKS POWDER & TABLETS: OVERVIEW
3.12 ENERGY DRINKS PACKAGING: OVERVIEW
3.13 WOMEN�S ENERGY DRINKS: OVERVIEW
3.14 ORGANIC ENERGY DRINKS: OVERVIEW
4 SPORTS & ENERGY DRINKS MARKET, BY TYPES & INGREDIENTS
4.1 INTRODUCTION
4.2 GLOBAL SPORTS DRINKS MARKET
4.2.1 SPORTS DRINKS TYPES
4.2.1.1 Isotonic Sports Drinks
4.2.1.2 Hypertonic Sports Drinks
4.2.1.3 Hypotonic Sports Drinks
4.2.2 SPORTS DRINKS TYPES, BY CONSUMPTION TIME
4.2.2.1 Before Exercise
4.2.2.2 During Exercise
4.2.2.3 Recovery
4.2.3 GLOBAL SPORTS DRINKS MARKET, BY END-USERS
4.2.3.1 Sportsperson/Athletes
4.2.3.2 Casual sports drink users
4.2.3.3 Recreational users
4.2.3.4 Lifestyle users
4.2.4 SPORTS DRINKS INGREDIENTS
4.2.4.1 Electrolytes
4.2.4.2 Carbohydrates
4.2.4.3 Sodium
4.2.4.4 Sugar
4.2.4.5 Preservatives
4.2.4.6 Vitamins B
4.2.4.7 Citric acid
4.2.4.8 Others
4.3 GLOBAL ENERGY DRINKS MARKET
4.3.1 GLOBAL ENERGY DRINKS MARKET, BY TYPES
4.3.1.1 Alcoholic Energy Drinks
4.3.1.2 Non-Alcoholic Energy Drinks
4.3.2 ENERGY DRINKS END-USERS
4.3.2.1 Kids/teenagers
4.3.2.2 Adults
4.3.3 ENERGY DRINK INGREDIENTS
4.3.3.1 Caffeine
4.3.3.2 Taurine
4.3.3.3 Guarana
4.3.3.4 Vitamin B
4.3.3.5 Ginseng
4.3.3.6 Ginkgo Biloba
4.3.3.7 L-Carnitine
4.3.3.8 Sugars
4.3.3.9 Antioxidants
4.3.3.10 Others
4.3.3.10.1 Glucuronolactone
4.3.3.10.2 Yerba Mate
4.3.3.10.3 GABA
4.3.3.10.4 Acai Berry
4.3.3.10.5 Milk Thistle
4.3.3.10.6 Inositol
4.3.3.10.7 Yohimbine
4.3.3.10.8 Artificial Sweeteners
4.3.3.10.9 Stevia
5 SPORTS & ENERGY DRINKS MARKET, BY GEOGRAPHY
5.1 OVERVIEW
5.2 ENERGY DRINKS MARKET, BY GEOGRAPHY
5.3 SPORTS DRINKS MARKET, BY GEOGRAPHY
5.4 NORTH AMERICA: ENERGY DRINKS MARKET, BY COUNTRY
5.5 NORTH AMERICA: SPORTS DRINKS MARKET, BY COUNTRY
5.6 ASIA-PACIFIC: ENERGY DRINKS MARKET, BY COUNTRY
5.7 ASIA PACIFIC: SPORTS DRINKS MARKET, BY COUNTRY
5.8 EUROPE: ENERGY DRINKS MARKET, BY COUNTRY
5.9 EUROPE: SPORTS DRINKS MARKET, BY COUNTRY
5.10 ROW: ENERGY DRINKS MARKET, BY COUNTRY
5.11 ROW: SPORTS DRINKS MARKET, BY COUNTRY
6 GLOBAL SPORTS & ENERGY DRINKS MARKET, BY DISTRIBUTION CHANNEL
6.1 INTRODUCTION
6.2 NORTH AMERICA: SPORTS & ENERGY DRINKS MARKET, BY DISTRIBUTION CHANNEL
6.2.1 U.S: SPORTS & ENERGY DRINKS MARKET, BY DISTRIBUTION CHANNEL
6.3 ASIA-PACIFIC: SPORTS & ENERGY DRINKS MARKET, BY DISTRIBUTION CHANNEL
6.3.1 JAPAN: SPORTS & ENERGY DRINKS MARKET, BY DISTRIBUTION CHANNEL
6.4 EUROPE: SPORTS & ENERGY DRINKS MARKET, BY DISTRIBUTION CHANNEL
6.4.1 U.K: SPORTS & ENERGY DRINKS MARKET, BY DISTRIBUTION CHANNEL
7 GLOBAL SPORTS & ENERGY DRINKS MARKET, BY TOP BRANDS
7.1 INTRODUCTION
7.2 NORTH AMERICA: SPORTS & ENERGY DRINKS MARKET, BY TOP BRANDS
7.2.1 U.S: SPORTS & ENERGY DRINKS MARKET, BY TOP BRANDS
7.3 ASIA-PACIFIC: SPORTS & ENERGY DRINKS MARKET, BY TOP BRANDS
7.3.1 JAPAN: SPORTS & ENERGY DRINKS MARKET, BY TOP BRANDS
7.4 EUROPE: SPORTS & ENERGY DRINKS MARKET, BY TOP BRANDS
7.4.1 U.K: SPORTS & ENERGY DRINKS MARKET, BY TOP BRANDS
8 COMPETITIVE LANDSCAPE
9 COMPANY PROFILES
9.1 ABBOTT NUTRITION INC
9.1.1 OVERVIEW
9.1.2 FINANCIALS
9.1.3 PRODUCTS & SERVICES
9.1.4 STRATEGY
9.1.5 DEVELOPMENTS
9.2 AJEGROUP
9.2.1 OVERVIEW
9.2.2 FINANCIALS
9.2.3 PRODUCTS & SERVICES
9.2.4 STRATEGY
9.2.5 DEVELOPMENTS
9.3 ARCTICO BEVERAGE COMPANY INTERNATIONAL INC
9.3.1 OVERVIEW
9.3.2 FINANCIALS
9.3.3 PRODUCTS & SERVICES
9.3.4 STRATEGY
9.3.5 DEVELOPMENTS
9.4 BRITVIC PLC
9.4.1 OVERVIEW
9.4.2 FINANCIALS
9.4.3 PRODUCTS & SERVICES
9.4.4 STRATEGY
9.4.5 DEVELOPMENTS
9.5 CHAMPION NUTRITION INC
9.5.1 OVERVIEW
9.5.2 FINANCIALS
9.5.3 PRODUCTS & SERVICES
9.5.4 STRATEGY
9.5.5 DEVELOPMENTS
9.6 CLOUD 9 ENERGY DRINK
9.6.1 OVERVIEW
9.6.2 FINANCIALS
9.6.3 PRODUCTS & SERVICES
9.6.4 STRATEGY
9.6.5 DEVELOPMENTS
9.7 D'ANGELO
9.7.1 OVERVIEW
9.7.2 FINANCIALS
9.7.3 PRODUCTS & SERVICES
9.7.4 STRATEGY
9.7.5 DEVELOPMENTS
9.8 DR PEPPER SNAPPLE GROUP INC
9.8.1 OVERVIEW
9.8.2 FINANCIALS
9.8.3 PRODUCTS & SERVICES
9.8.4 STRATEGY
9.8.5 DEVELOPMENTS
9.9 EXTREME DRINKS CO
9.9.1 OVERVIEW
9.9.2 FINANCIALS
9.9.3 PRODUCTS & SERVICES
9.9.4 STRATEGY
9.9.5 DEVELOPMENTS
9.10 FRASER AND NEAVE HOLDINGS BHD
9.10.1 OVERVIEW
9.10.2 FINANCIALS
9.10.3 PRODUCTS & SERVICES
9.10.4 STRATEGY
9.10.5 DEVELOPMENTS
9.11 FRUCOR BEVERAGES LTD
9.11.1 OVERVIEW
9.11.2 FINANCIALS
9.11.3 PRODUCTS & SERVICES
9.11.4 STRATEGY
9.11.5 DEVELOPMENTS
9.12 GLANBIA PLC
9.12.1 OVERVIEW
9.12.2 FINANCIALS
9.12.3 PRODUCTS & SERVICES
9.12.4 STRATEGY
9.12.5 DEVELOPMENTS
9.13 GLAXOSMITHKLINE PLC
9.13.1 OVERVIEW
9.13.2 FINANCIALS
9.13.3 PRODUCTS & SERVICES
9.13.4 STRATEGY
9.13.5 DEVELOPMENTS
9.14 HANSEN�S NATURAL CORP
9.14.1 OVERVIEW
9.14.2 FINANCIALS
9.14.3 PRODUCTS & SERVICES
9.14.4 STRATEGY
9.14.5 DEVELOPMENTS
9.15 KRAFT FOODS INC
9.15.1 OVERVIEW
9.15.2 FINANCIALS
9.15.3 PRODUCTS & SERVICES
9.15.4 STRATEGY
9.15.5 DEVELOPMENTS
9.16 THE MONARCH BEVERAGE CO INC
9.16.1 OVERVIEW
9.16.2 FINANCIALS
9.16.3 PRODUCTS & SERVICES
9.16.4 STRATEGY
9.16.5 DEVELOPMENTS
9.17 NESTL� S.A.
9.17.1 OVERVIEW
9.17.2 FINANCIALS
9.17.3 PRODUCTS & SERVICES
9.17.4 STRATEGY
9.17.5 DEVELOPMENTS
9.18 OTSUKA HOLDING CO LTD
9.18.1 OVERVIEW
9.18.2 FINANCIALS
9.18.3 PRODUCTS & SERVICES
9.18.4 STRATEGY
9.18.5 DEVELOPMENTS
9.19 PACIFICHEALTH LABORATORIES INC
9.19.1 OVERVIEW
9.19.2 FINANCIALS
9.19.3 PRODUCTS & SERVICES
9.19.4 STRATEGY
9.19.5 DEVELOPMENTS
9.20 PEPSICO INC
9.20.1 OVERVIEW
9.20.2 FINANCIALS
9.20.3 PRODUCTS & SERVICES
9.20.4 STRATEGY
9.20.5 DEVELOPMENTS
9.21 PROVEXIS PLC
9.21.1 OVERVIEW
9.21.2 FINANCIALS
9.21.3 PRODUCTS & SERVICES
9.21.4 STRATEGY
9.21.5 DEVELOPMENTS
9.22 RED BULL GMBH
9.22.1 OVERVIEW
9.22.2 FINANCIALS
9.22.3 PRODUCTS & SERVICES
9.22.4 STRATEGY
9.22.5 DEVELOPMENTS
9.23 ROCKSTAR INC
9.23.1 OVERVIEW
9.23.2 FINANCIALS
9.23.3 PRODUCTS & SERVICES
9.23.4 STRATEGY
9.23.5 DEVELOPMENTS
9.24 STARBUCKS COFFEE CO
9.24.1 OVERVIEW
9.24.2 FINANCIALS
9.24.3 PRODUCTS & SERVICES
9.24.4 STRATEGY
9.24.5 DEVELOPMENTS
9.25 SUNTORY HOLDINGS LTD
9.25.1 OVERVIEW
9.25.2 FINANCIALS
9.25.3 PRODUCTS & SERVICES
9.25.4 STRATEGY
9.25.5 DEVELOPMENTS
9.26 THE COCA-COLA CO
9.26.1 OVERVIEW
9.26.2 FINANCIALS
9.26.3 PRODUCTS & SERVICES
9.26.4 STRATEGY
9.26.5 DEVELOPMENTS
9.27 THE FRS CO
9.27.1 OVERVIEW
9.27.2 FINANCIALS
9.27.3 PRODUCTS & SERVICES
9.27.4 STRATEGY
9.27.5 DEVELOPMENTS
APPENDIX
US PATENTS
EUROPE PATENTS
JAPAN PATENTS
LIST OF TABLES
TABLE 1 SPORTS & ENERGY DRINKS MARKET VOLUME, BY GEOGRAPHY, 2009 � 2016 (MILLION LITERS)
TABLE 2 SPORTS & ENERGY DRINKS MARKET REVENUE, BY GEOGRAPHY, 2009 - 2016 ($MILLION)
TABLE 3 BRAND, LINE & FLAVOUR EXTENSIONS OF MAJOR SPORTS & ENERGY DRINK BRANDS
TABLE 4 TOP FLAVOURS IN SPORTS & ENERGY DRINKS
TABLE 5 IMPACT ANALYSIS OF GROWTH DRIVERS
TABLE 6 NORTH AMERICA: NEW PRODUCTS LAUNCHE, BY POSITIONING STRATEGIES, 2008 � 2010
TABLE 7 MARKETING INVESTMENTS, BY RED BULL, 2010
TABLE 8 IMPACT ANALYSIS OF GROWTH RESTRAINTS
TABLE 9 COMPARISON OF COMMERCIAL SPORT DRINK VS. TRADITIONAL DRINK
TABLE 10 NORTH AMERICA: NEW PRODUCTS LAUNCH, BY TYPES, 2008 � 2010
TABLE 11 MARKET TREND FOR ENERGY SHOTS, 2010
TABLE 12 SPORTS & ENERGY DRINKS BRANDS, BY PACK SIZES
TABLE 13 WOMEN�S ENERGY DRINKS CONTENT
TABLE 14 COMPARISON BETWEEN SPORTS DRINKS & ENERGY DRINKS
TABLE 15 TYPES OF SPORTS DRINKS
TABLE 16 EFFECTS OF FLUID LOSS ON HUMAN BODY
TABLE 17 SPORTS DRINK INGREDIENTS & THEIR FUNCTIONS
TABLE 18 ELECTROLYTE CONTENT OF SPORTS DRINKS
TABLE 19 ELECTROLYTES INTAKE RECOMMENDATION
TABLE 20 CARBOHYDRATE CONCENTRATION IN SPORTS DRINKS
TABLE 21 SODIUM CONTENT IN SPORTS DRINKS
TABLE 22 RECOMMENDED SODIUM INTAKE
TABLE 23 KEY INGREDIENTS OF MAJOR SPORTS DRINKS
TABLE 24 ENERGY DRINK INGREDIENTS & THEIR FUNCTIONS
TABLE 25 INGREDIENT CONTENTS IN ENERGY DRINKS
TABLE 26 CAFFEINE CONTENT IN ENERGY DRINKS
TABLE 27 CURATIVE USE OF TAURINE
TABLE 28 GUARANA CONTENT IN ENERGY DRINK
TABLE 29 GINSENG CONTENT IN ENERGY DRINK
TABLE 30 L-CARNITINE IN ENERGY DRINKS
TABLE 31 GENERAL TYPE OF SUGARS USED IN ENERGY DRINKS
TABLE 32 GLUCURONOLACTONE IN ENERGY DRINK
TABLE 33 ARTIFICIAL SWEETENERS USED IN ENERGY DRINK
TABLE 34 ENERGY DRINKS MARKET, BY GEOGRAPHY, 2009 � 2016 (MILLION LITERS)
TABLE 35 ENERGY DRINKS MARKET REVENUE, BY GEOGRAPHY, 2009 � 2016 ($MILLION)
TABLE 36 SPORTS DRINKS MARKET VOLUME, BY GEOGRAPHY, 2009 - 2016 (MILLION LITERS)
TABLE 37 SPORTS DRINKS MARKET REVENUE, BY GEOGRAPHY, 2009 - 2016 ($MILLION)
TABLE 38 NORTH AMERICA: ENERGY DRINKS MARKET VOLUME, BY COUNTRY, 2009 - 2016 (MILLION LITERS)
TABLE 39 NORTH AMERICA: ENERGY DRINKS MARKET REVENUE, BY COUNTRY, 2009 - 2016 ($MILLION)
TABLE 40 NORTH AMERICA: SPORTS DRINKS MARKET VOLUME, BY COUNTRY, 2009 - 2016 (MILLION LITERS)
TABLE 41 NORTH AMERICA: SPORTS DRINKS MARKET REVENUE, BY COUNTRY, 2009 - 2016 ($MILLION)
TABLE 42 ASIA-PACIFIC: ENERGY DRINKS MARKET VOLUME, BY COUNTRY, 2009 - 2016 (MILLION LITERS)
TABLE 43 ASIA-PACIFIC: ENERGY DRINKS MARKET REVENUE, BY COUNTRY, 2009 - 2016 ($MILLION)
TABLE 44 ASIA-PACIFIC: SPORTS DRINKS MARKET VOLUME, BY COUNTRY, 2009 - 2016 (MILLION LITERS)
TABLE 45 ASIA-PACIFIC: SPORTS DRINKS MARKET REVENUE, BY COUNTRY, 2009 - 2016 ($MILLION)
TABLE 46 EUROPE: ENERGY DRINKS MARKET VOLUME, BY COUNTRY, 2009 - 2016 (MILLION LITERS)
TABLE 47 EUROPE: ENERGY DRINKS MARKET REVENUE, BY COUNTRY, 2009 - 2016 ($MILLION)
TABLE 48 EUROPE: SPORTS DRINKS MARKET VOLUME, BY COUNTRY, 2009 - 2016 (MILLION LITERS)
TABLE 49 EUROPE: SPORTS DRINKS MARKET REVENUE, BY COUNTRY, 2009 - 2016 ($MILLION)
TABLE 50 ROW: ENERGY DRINKS MARKET VOLUME, BY COUNTRY, 2009 - 2016 (MILLION LITERS)
TABLE 51 ROW: ENERGY DRINKS MARKET REVENUE, BY COUNTRY, 2009 - 2016 ($MILLION)
TABLE 52 ROW: SPORTS DRINKS MARKET VOLUME, BY COUNTRY, 2009 - 2016 (MILLION LITERS)
TABLE 53 ROW: SPORTS DRINKS MARKET REVENUE, BY COUNTRY, 2009 - 2016 ($MILLION)
TABLE 54 U.S: ENERGY DRINKS MARKET VOLUME, BY DISTRIBUTION CHANNEL, 2009 - 2016 (MILLION LITERS)
TABLE 55 U.S: ENERGY DRINKS MARKET REVENUE, BY DISTRIBUTION CHANNEL, 2009 � 2016 ($MILLION)
TABLE 56 U.S: SPORTS DRINKS MARKET VOLUME, BY DISTRIBUTION CHANNEL, 2009 - 2016 (MILLION LITERS)
TABLE 57 U.S: SPORTS DRINKS MARKET REVENUE, BY DISTRIBUTION CHANNEL, 2009 - 2016 ($MILLION)
TABLE 58 JAPAN: ENERGY DRINKS MARKET VOLUME, BY DISTRIBUTION CHANNEL, 2009 - 2016 (MILLION LITERS)
TABLE 59 JAPAN: ENERGY DRINKS MARKET REVENUE, BY DISTRIBUTION CHANNEL, 2009 - 2016 ($MILLION)
TABLE 60 JAPAN: SPORTS DRINKS MARKET VOLUME, BY DISTRIBUTION CHANNEL, 2009 - 2016 (MILLION LITERS)
TABLE 61 JAPAN: SPORTS DRINKS MARKET REVENUE, BY DISTRIBUTION CHANNEL, 2009 - 2016 ($MILLION)
TABLE 62 U.K: ENERGY DRINKS MARKET VOLUME, BY DISTRIBUTION CHANNEL, 2009 - 2016 (MILLION LITERS)
TABLE 63 U.K: ENERGY DRINKS MARKET REVENUE, BY DISTRIBUTION CHANNEL, 2009 - 2016 ($MILLION)
TABLE 64 U.K: SPORTS DRINKS MARKET VOLUME, BY DISTRIBUTION CHANNEL, 2009 - 2016 (MILLION LITERS)
TABLE 65 U.K: SPORTS DRINKS MARKET REVENUE, BY DISTRIBUTION CHANNEL, 2009 - 2016 ($MILLION)
TABLE 66 U.S: ENERGY DRINKS MARKET VOLUME, BY TOP BRANDS, 2009 - 2016 (MILLION LITERS)
TABLE 67 U.S: ENERGY DRINKS MARKET REVENUE, BY TOP BRANDS, 2009 - 2016 ($MILLION)
TABLE 68 U.S: SPORTS DRINKS MARKET VOLUME, BY TOP BRANDS, 2009 - 2016 (MILLION LITERS)
TABLE 69 U.S: SPORTS DRINKS MARKET REVENUE, BY TOP BRANDS, 2009 - 2016 ($MILLION)
TABLE 70 JAPAN: ENERGY DRINKS MARKET VOLUME, BY TOP BRANDS, 2009 - 2016 (MILLION LITERS)
TABLE 71 JAPAN: ENERGY DRINKS MARKET REVENUE, BY TOP BRANDS, 2009 - 2016 ($MILLION)
TABLE 72 JAPAN: SPORTS DRINKS MARKET VOLUME, BY TOP BRANDS, 2009 - 2016 (MILLION LITERS)
TABLE 73 JAPAN: SPORTS DRINKS MARKET REVENUE, BY TOP BRANDS, 2009 - 2016 ($MILLION)
TABLE 74 U.K: ENERGY DRINKS MARKET VOLUME, BY TOP BRANDS, 2009 - 2016 (MILLION LITERS)
TABLE 75 U.K: ENERGY DRINKS MARKET REVENUE, BY TOP BRANDS, 2009 - 2016 ($MILLION)
TABLE 76 U.K: SPORTS DRINKS MARKET VOLUME, BY TOP BRANDS, 2009 - 2016 (MILLION LITERS)
TABLE 77 U.K: SPORTS DRINKS MARKET REVENUE, BY TOP BRANDS, 2009 - 2016 ($MILLION)
TABLE 78 MERGERS & ACQUISITIONS, 2008 � 2011
TABLE 79 NEW PRODUCTS LAUNCH, 2008 � 2011
TABLE 80 AGREEMENTS, PARTNERSHIPS, & COLLABORATIONS, 2008 � 2011
TABLE 81 EXPANSIONS IN PRODUCTION FACILITIES, 2008 � 2011
TABLE 82 GEOGRAPHIC EXPANSIONS, 2010 � 2011
TABLE 83 PROMOTIONAL ACTIVITIES, 2008 � 2011
TABLE 84 ABBOTT NUTRITION INC: REVENUE GROWTH, BY PRODUCT GROUPS, 2009 � 2010 ($MILLION)
TABLE 85 BRITVIC PLC: REVENUE GROWTH, BY SEGMENTS, 2009 � 2010 ($MILLION)
TABLE 86 KRAFT FOODS: REVENUE GROWTH, BY SEGMENTS, 2009 � 2010 ($MILLION)
TABLE 87 PEPSICO: REVENUE GROWTH, BY SEGMENTS, 2009 � 2010 ($MILLION)
TABLE 88 STARBUCKS CORPORATION: REVENUE GROWTH, BY SEGMENTS, 2009 � 2010 ($MILLION)
TABLE 89 COCA-COLA: REVENUE GROWTH, BY SEGMENTS, 2009 � 2010 ($MILLION)
LIST OF FIGURES
FIGURE 1 PORTER�S ANALYSIS
FIGURE 2 SUBSTITUTES FOR SPORTS & ENERGY DRINKS, 2009
FIGURE 3 SPORTS & ENRGY DRINK PATENTS, BY GEOGRAPHY, 2005 � 2011
FIGURE 4 PATENTS COMPARISON, BY TYPES, 2005 � 2011
FIGURE 5 NORTH AMERICA: MARKET SHARE OF TOP ENERGY DRINKS COMPANIES, 2010
FIGURE 6 EUROPE: MARKET SHARE OF TOP ENERGY DRINKS COMPANIES, 2010
FIGURE 7 ASIA-PACIFIC: MARKET SHARE OF TOP ENERGY DRINKS COMPANIES, 2010
FIGURE 8 NORTH AMERICA: MARKET SHARE OF TOP SPORTS DRINK COMPANIES, 2010
FIGURE 9 EUROPE: MARKET SHARE OF TOP SPORTS DRINK COMPANIES, 2010
FIGURE 10 ASIA-PACIFIC: MARKET SHARE OF TOP SPORTS DRINK COMPANIES, 2010
FIGURE 11 SPORTS DRINK END-USERS
FIGURE 12 YOUTH & ADULT ENERGY DRINK CONSUMERS, 2009
FIGURE 13 SPORTS & ENERGY DRINKS MARKET, BY GEOGRAPHY, 2011
FIGURE 14 SPORTS & ENERGY DRINKS, BY DISTRIBUTION CHANNEL
FIGURE 15 U.S: RED BULL DISTRIBUTION STRATEGY
FIGURE 16 MAJOR GROWTH STRATEGIES
FIGURE 17 NEW PRODUCTS LAUNCH, 2008 � 2011


Growth opportunities and latent adjacency in Sports & Energy Drinks Market