Software Composition Analysis Market by Component (Solution and Services (Professional and Managed)), Organization Size, Deployment Type (On-Premises and Cloud), Vertical (BFSI, Healthcare, Telecom & IT), and Region - Global Forecast to 2022


[153 Pages Reports] The global software composition analysis market size is expected to grow from USD 129.1 Million in 2016 to USD 398.4 Million by 2022, at a Compound Annual Growth Rate (CAGR) of 20.9% during the forecast period. The base year considered for this study is 2016, and the forecast period is 2017�2022. The increasing level of threats and risks in open-source codes is one of the major factors fueling the growth of the global market.
Objectives of the Study
- To define, describe, and forecast the software composition analysis market by component (solution and services), organization size, deployment type, vertical, and region
- To provide detailed information about the major factors (drivers, restraints, opportunities, and challenges) influencing the growth of the market
- To analyze the micromarkets with respect to individual growth trends, prospects, and contributions to the overall market
- To analyze market opportunities for stakeholders by identifying high-growth segments of the market
- To forecast the market size of the segments with respect to 5 main regions, namely, North America, Europe, Asia Pacific (APAC), Middle East and Africa (MEA), and Latin America
- To profile the key players in the market and comprehensively analyze their market size and core competencies2
- To track and analyze competitive developments, such as new product launches; mergers and acquisitions; and partnerships, agreements, and collaborations, in the global market
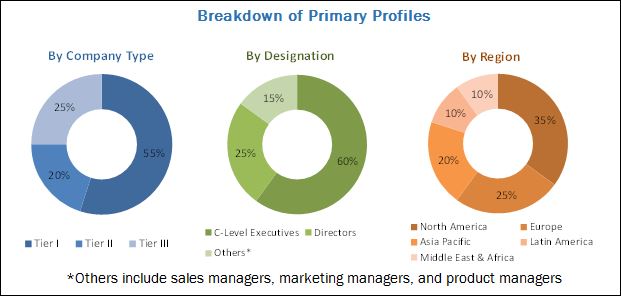
The research methodology used to estimate and forecast the software composition analysis market began with the capturing of data on the revenues of key vendors through secondary sources, such as annual reports; press releases; associations and consortiums, such as the IEEE Cyber Security Community; Information Security Research Association (ISRA); Information Systems Security Association (ISSA); RSA Security; the SysAdmin, Audit, Network, and Security (SANS) Institute; and SC Magazine; databases such as Factiva, D&B Hoovers, and Bloomberg BusinessWeek; company websites; and news articles. Vendor offerings were also taken into consideration to determine the market segmentation. The bottom-up procedure was employed to arrive at the overall market size of the global market from the revenues of key players in the market. After arriving at the overall market size, the total market was split into several segments and subsegments, which were then verified through primary research by conducting extensive interviews with key people, such as Chief Executive Officers (CEOs), Vice Presidents (VPs), directors, and executives. The data triangulation and market breakdown procedures were employed to complete the overall market engineering process and arrive at the exact statistics for all the segments. The breakdown of the primary profiles is depicted in the following figure:
To know about the assumptions considered for the study, download the pdf brochure
The software composition analysis ecosystem includes several providers, such as Synopsys (US), Sonatype (US), Veracode (US), WhiteHat Security (US), and WhiteSource Software (US). Other stakeholders include cybersecurity vendors, Open Source Software (OSS) security vendors, application security vendors, Independent Software Vendors (ISVs), system integrators, consulting companies, and enterprise customers.
Key Target Audience for Software Composition Analysis Market
- Software composition analysis solution vendors
- Cybersecurity vendors
- Application security vendors
- Defense organizations
- Government agencies
- ISVs
- Consulting firms
- System integrators
- Value-Added Resellers (VARs)
- Information Technology (IT) security agencies
- Managed Security Service Providers (MSSPs)
�The research study answers several questions for the stakeholders, primarily which market segments to focus on in the next 2 to 5 years, for prioritizing the efforts and investments.�
Scope of the Software Composition Analysis Market Research Report
|
Report Metrics |
Details |
|
Market size available for years |
2016�2022 |
|
Base year considered |
2017 |
|
Forecast period |
2017�2022 |
|
Forecast units |
Million (USD) |
|
Segments covered |
Component (Solution and Services (Professional and Managed)), Organization Size, Deployment Type (On-Premises and Cloud), Vertical (BFSI, Healthcare, Telecom & IT), and Region |
|
Geographies covered |
North America, Europe, Asia Pacific (APAC), Middle East and Africa (MEA), and Latin America |
|
Companies covered |
Synopsys (US), Sonatype (US), Veracode (US), WhiteHat Security (US), WhiteSource Software (US), Contrast Security (US), Flexera (US), nexB (US), Rogue Wave Software (US), and SourceClear (US). |
The research report categorizes the Software Composition Analysis Market to forecast the revenues and analyze trends in each of the following subsegments:
By Component
- Solution
- Services
- Professional services
- Support and maintenance
- Training and education
- Planning and consulting
- Managed services
- Professional services
Software Composition Analysis Market By Organization Size
- Large enterprises
- Small and Medium-sized Enterprises (SMEs)
By Deployment Type
- On-premises
- Cloud
By Vertical
- Banking, Financial Services, and Insurance (BFSI)
- Telecom and IT
- Healthcare
- Government and defense
- Retail and e-commerce
- Manufacturing
- Automotive
- Others (energy and utilities, education, and media and entertainment)
By Region
- North America
- US
- Canada
- Europe
- UK
- Germany
- France
- Rest of Europe
- APAC
- China
- Japan
- Rest of APAC
- MEA
- Middle East
- Africa
- Latin America
- Mexico
- Brazil
- Rest of Latin America
Available Customizations
With the given market data, MarketsandMarkets offers customizations based on the company�s specific needs. The following customization options are available for the report:
Geographic Analysis
- Further breakdown of the APAC market into countries contributing 75% of the regional market size
- Further breakdown of the North American market into countries contributing 75% of the regional market size
- Further breakdown of the Latin American market into countries contributing 75% of the regional market size
- Further breakdown of the MEA market into countries contributing 75% of the regional market size
- Further breakdown of the European market into countries contributing 75% of the regional market size
Company Information
- Detailed analysis and profiling of additional market players (up to 5)
The software composition analysis market size is expected to grow from USD 154.0 Million in 2017 to USD 398.4 Million by 2022, at a Compound Annual Growth Rate (CAGR) of 20.9% during the forecast period. The demand for software composition analysis solutions and services is expected to be driven by many factors, such as increasing threats to open-source codes, stringent government regulations, and dependence of commercial and IoT-based software products on open-source codes.
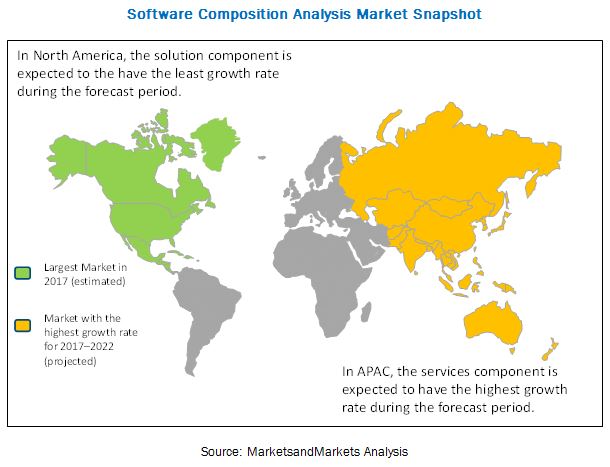
The software composition analysis market has been segmented on the basis of components, organization sizes, deployment types, verticals, and regions. Among the components, the services segment is expected to grow at a higher CAGR during the forecast period and the solutions segment is estimated to have the largest market size in 2017. The software composition analysis solution and services make sure that the open-source code, component, and software do not disrupt the functioning of projects and affect the user experience. The software composition analysis solution provides significant capabilities, such as vulnerability detection, risk management, alerting, and reporting, license management, policy management, and remediation.
The large enterprises segment is expected to hold a larger market size, whereas the Small and Medium-Sized Enterprises (SMEs) segment is expected to grow at a high CAGR during the forecast period. Large enterprises have been operating in a highly saturated market, wherein, they are left behind with limited growth opportunities. The open-source code analysis solution, required by large enterprises, needs to help work in an agile approach rather than the waterfall approach. Vulnerability detection should be done with minimal false positives and should be able to track vulnerability in every step of SDLC. Thus, a robust software composition analysis solution enables the software development, quality, and security teams to work in unison.
The BFSI vertical is expected to dominate the software composition analysis market by verticals with the largest market size, whereas the retail and e-commerce vertical is expected to grow at the highest CAGR during the forecast period. The BFSI vertical�s dominance is attributed to the fact that these enterprises rely heavily on the open-source software technology to increase their operational efficiency and avoid proprietary source code vendor lock-ins. The retail and e-commerce vertical is focused on cost-cutting, improving the revenue margin, and adhering to various regulatory compliances. To achieve this, the retail and e-commerce vertical is increasingly adopting open-source components and hence, is rapidly deploying software composition analysis solutions for Open Source Software (OSS) security.
North America is estimated to hold the largest market share in 2017, whereas Asia Pacific (APAC) is projected to grow at the highest CAGR during the forecast period in the software composition analysis market. Increasing threats on open-source codes, stringent regulations, and dependence of commercial and IoT based software products on open-source codes are expected to drive the demand for software composition analysis solutions and services, globally.
High adoption of software composition analysis solutions in the FinTech sector and an increasing demand for cloud-based software composition analysis solutions are expected to provide significant opportunities to the software composition analysis market to flourish. However, major issues faced by enterprises while adopting software composition analysis solutions and services are DevOps and budgetary constraints among SMEs.
Major vendors providing software composition analysis solutions and services are Synopsys (US), Sonatype (US), Veracode (US), WhiteHat Security (US), WhiteSource Software (US), Contrast Security (US), Flexera (US), nexB (US), Rogue Wave Software (US), and SourceClear (US). These players have adopted various strategies, such as new product launches; partnerships, agreements, and collaborations; mergers and acquisitions; and business expansions to expand their presence in the global software composition analysis market.
To speak to our analyst for a discussion on the above findings, click Speak to Analyst
 Exclusive indicates content/data unique to MarketsandMarkets and not available with any competitors.
Table of Contents
1 Introduction (Page No. - 13)
1.1 Objectives of the Study
1.2 Market Definition
1.3 Market Scope
1.4 Years Considered for the Study
1.5 Currency
1.6 Stakeholders
2 Research Methodology (Page No. - 17)
2.1 Research Data
2.1.1 Secondary Data
2.1.2 Primary Data
2.1.2.1 Breakdown of Primaries
2.1.2.2 Key Industry Insights
2.2 Market Size Estimation
2.3 Research Assumptions
2.4 Limitations
3 Executive Summary (Page No. - 25)
4 Premium Insights (Page No. - 29)
4.1 Attractive Market Opportunities in the Market
4.2 Market Share of Top 3 Verticals and Regions
4.3 Software Composition Analysis Market, By Service
4.4 Market By Professional Service
4.5 Market By Deployment Type
4.6 Market By Organization Size
4.7 Market By Vertical
4.8 Market Investment Scenario
5 Market Overview (Page No. - 35)
5.1 Introduction
5.2 Market Dynamics
5.2.1 Drivers
5.2.1.1 Increasing Levels of Threats and Risks in Open-Source Codes
5.2.1.2 Commercial and Iot-Based Software Products� Dependence on Open-Source Codes
5.2.1.3 Stringent Regulations
5.2.2 Restraints
5.2.2.1 Streamlined Operations and Agility Due to Devops Inhibit the Growth of the Software Composition Analysis Market
5.2.2.2 Budget Constraints Among SMES
5.2.3 Opportunities
5.2.3.1 High Adoption of Software Composition Analysis Solutions in the Fintech Sector
5.2.3.2 Increase in Demand for Cloud-Based and Hybrid Software Composition Analysis Solutions Among SMES
5.2.4 Challenges
5.2.4.1 Lack of Awareness About Software Composition Analysis Solutions Among Enterprises
5.2.4.2 Lack of Technical Expertise Among the Enterprise Workforce, and Difficulties in Collaboration Between the Development and Security Teams
5.3 Vulnerability Lists and Databases
5.3.1 Common Weakness Enumeration (CWE)
5.3.2 Common Vulnerabilities and Exposures (CVE)
5.3.3 National Vulnerability Database (NVD)
5.4 Best Practices for Software Composition Analysis
5.5 Regulatory Landscape
5.5.1 Payment Card Industry Data Security Standard (PCI DSS)
5.5.2 Health Insurance Portability and Accountability Act (HIPAA)
5.5.3 Federal Information Security Management Act (FISMA)
5.5.4 Sarbanes�Oxley Act (SOX)
5.5.5 Gramm�Leach�Bliley Act (GLBA)
5.5.6 Federal Information Processing Standards (FIPS)
5.6 Innovation Spotlight
5.7 Use Cases
5.7.1 Dependence of A Leading Fintech Company on Software Composition Analysis Solutions for Open-Source Vulnerability Management
5.7.2 Adoption of Software Composition Analysis Solutions By A Big Data Company in the Us
5.7.3 Dependence of A Major IT Services Company on Software Composition Analysis Solution
5.7.4 Large-Scale Adoption of Software Composition Analysis Solutions By the BFSI Sector in North America
5.7.5 Need for the Best-In-Class Software Composition Analysis Solutions for an Automotive Supplier in Italy
6 Market, By Component (Page No. - 50)
6.1 Introduction
6.2 Solution
6.2.1 Capabilities
6.2.1.1 Vulnerability Detection
6.2.1.2 Risk Management, Alerting, and Reporting
6.2.1.3 License Management
6.2.1.4 Policy Management
6.2.1.5 Remediation
6.3 Services
6.3.1 Professional Services
6.3.1.1 Planning and Consulting
6.3.1.2 Training and Education
6.3.1.3 Support and Maintenance
6.3.2 Managed Services
7 Software Composition Analysis Market, By Deployment Type (Page No. - 64)
7.1 Introduction
7.2 On-Premises
7.3 Cloud
8 Market, By Organization Size (Page No. - 69)
8.1 Introduction
8.2 Large Enterprises
8.3 Small and Medium-Sized Enterprises
9 Market, By Vertical (Page No. - 73)
9.1 Introduction
9.2 Banking, Financial Services, and Insurance
9.3 Government and Defense
9.4 Telecom and IT
9.5 Retail and Ecommerce
9.6 Healthcare
9.7 Manufacturing
9.8 Automotive
9.9 Others
10 Software Composition Analysis Market, By Region (Page No. - 84)
10.1 Introduction
10.2 North America
10.2.1 United States
10.2.2 Canada
10.3 Europe
10.3.1 United Kingdom
10.3.2 Germany
10.3.3 France
10.3.4 Others
10.4 Asia Pacific
10.4.1 China
10.4.2 Japan
10.4.3 Others
10.5 Middle East and Africa
10.5.1 Middle East
10.5.2 Africa
10.6 Latin America
10.6.1 Mexico
10.6.2 Brazil
10.6.3 Others
11 Competitive Landscape (Page No. - 111)
11.1 Overview
11.2 Market Standing, By Key Player
11.3 Competitive Situations and Trends
11.3.1 New Product Launches/Product Enhancements
11.3.2 Business Expansions
11.3.3 Partnerships, Agreements, and Collaborations
11.3.4 Mergers and Acquisitions
12 Company Profiles (Page No. - 116)
12.1 Introduction
12.2 Synopsys
12.2.1 Business Overview
12.2.2 Products and Services Offered
12.2.3 Recent Developments
12.2.4 SWOT Analysis
12.2.5 MnM View
12.3 Sonatype
12.3.1 Business Overview
12.3.2 Products Offered
12.3.3 Recent Developments
12.3.4 SWOT Analysis
12.3.5 MnM View
12.4 Veracode (CA Technologies)
12.4.1 Business Overview
12.4.2 Products and Services Offered
12.4.3 Recent Developments
12.4.4 SWOT Analysis
12.4.5 MnM View
12.5 Whitehat Security
12.5.1 Business Overview
12.5.2 Products and Services Offered
12.5.3 Recent Developments
12.5.4 SWOT Analysis
12.5.5 MnM View
12.6 Whitesource Software
12.6.1 Business Overview
12.6.2 Products Offered
12.6.3 Recent Developments
12.6.4 SWOT Analysis
12.6.5 MnM View
12.7 Contrast Security
12.7.1 Business Overview
12.7.2 Products Offered
12.7.3 Recent Developments
12.7.4 MnM View
12.8 Flexera
12.8.1 Business Overview
12.8.2 Products and Services Offered
12.8.3 Recent Developments
12.8.4 MnM View
12.9 nexB
12.9.1 Business Overview
12.9.2 Products Offered
12.9.3 Recent Developments
12.9.4 MnM View
12.10 Rogue Wave Software
12.10.1 Business Overview
12.10.2 Services Offered
12.10.3 Recent Developments
12.10.4 MnM View
12.11 Sourceclear
12.11.1 Business Overview
12.11.2 Products Offered
12.11.3 Recent Developments
12.11.4 MnM View
13 Appendix (Page No. - 146)
13.1 Discussion Guide
13.2 Knowledge Store: Marketsandmarkets� Subscription Portal
13.3 Introducing RT: Real-Time Market Intelligence
13.4 Available Customizations
13.5 Related Reports
13.6 Author Details
List of Tables (69 Tables)
Table 1 United States Dollar Exchange Rate, 2014�2016
Table 2 Most Common High-Risk Open-Source Components
Table 3 Innovation Spotlight: Latest Software Composition Analysis Solutions
Table 4 Software Composition Analysis Market Size, By Component, 2015�2022 (USD Million)
Table 5 Solution: Market Size, By Region, 2015�2022 (USD Million)
Table 6 Services: Market Size, By Region, 2015�2022 (USD Million)
Table 7 Services: Market Size, By Type, 2015�2022 (USD Million)
Table 8 Professional Services Market Size, By Region, 2015�2022 (USD Thousand)
Table 9 Professional Services Market Size, By Type, 2015�2022 (USD Million)
Table 10 Planning and Consulting Market Size, By Region, 2015�2022 (USD Thousand)
Table 11 Training and Education Market Size, By Region, 2015�2022 (USD Thousand)
Table 12 Support and Maintenance Market Size, By Region, 2015�2022 (USD Thousand)
Table 13 Managed Services Market Size, By Region, 2015�2022 (USD Thousand)
Table 14 Software Composition Analysis Market Size, By Deployment Type, 2015�2022 (USD Million)
Table 15 On-Premises: Market Size, By Region, 2015�2022 (USD Million)
Table 16 Cloud: Market Size, By Region, 2015�2022 (USD Million)
Table 17 Market Size, By Organization Size, 2015�2022 (USD Million)
Table 18 Large Enterprises: Market Size, By Region, 2015�2022 (USD Million)
Table 19 Small and Medium-Sized Enterprises: Market Size, By Region, 2015�2022 (USD Million)
Table 20 Market Size, By Vertical, 2015�2022 (USD Million)
Table 21 Banking, Financial Services, and Insurance: Market Size, By Region, 2015�2022 (USD Million)
Table 22 Government and Defense: Market Size, By Region, 2015�2022 (USD Million)
Table 23 Telecom and IT: Market Size, By Region, 2015�2022 (USD Million)
Table 24 Retail and Ecommerce: Market Size, By Region, 2015�2022 (USD Thousand)
Table 25 Healthcare: Market Size, By Region, 2015�2022 (USD Thousand)
Table 26 Manufacturing: Market Size, By Region, 2015�2022 (USD Thousand)
Table 27 Automotive: Market Size, By Region, 2015�2022 (USD Thousand)
Table 28 Others: Market Size, By Region, 2015�2022 (USD Thousand)
Table 29 Software Composition Analysis Market Size, By Region, 2015�2022 (USD Million)
Table 30 North America: Market Size, By Component, 2015�2022 (USD Million)
Table 31 North America: Market Size, By Service, 2015�2022 (USD Million)
Table 32 North America: Market Size, By Professional Service, 2015�2022 (USD Million)
Table 33 North America: Market Size, By Deployment Type, 2015�2022 (USD Million)
Table 34 North America: Market Size, By Organization Size, 2015�2022 (USD Million)
Table 35 North America: Market Size, By Vertical, 2015�2022 (USD Million)
Table 36 North America: Market Size, By Country, 2015�2022 (USD Million)
Table 37 Europe: Software Composition Analysis Market Size, By Component, 2015�2022 (USD Million)
Table 38 Europe: Market Size, By Service, 2015�2022 (USD Million)
Table 39 Europe: Market Size, By Professional Service, 2015�2022 (USD Million)
Table 40 Europe: Market Size, By Deployment Type, 2015�2022 (USD Million)
Table 41 Europe: Market Size, By Organization Size, 2015�2022 (USD Million)
Table 42 Europe: Market Size, By Vertical, 2015�2022 (USD Million)
Table 43 Europe: Market Size, By Country, 2015�2022 (USD Million)
Table 44 Asia Pacific: Software Composition Analysis Market Size, By Component, 2015�2022 (USD Million)
Table 45 Asia Pacific: Market Size, By Service, 2015�2022 (USD Million)
Table 46 Asia Pacific: Market Size, By Professional Service, 2015�2022 (USD Million)
Table 47 Asia Pacific: Market Size, By Deployment Type, 2015�2022 (USD Million)
Table 48 Asia Pacific: Market Size, By Organization Size, 2015�2022 (USD Million)
Table 49 Asia Pacific: Market Size, By Vertical, 2015�2022 (USD Million)
Table 50 Asia Pacific: Market Size, By Country, 2015�2022 (USD Million)
Table 51 Middle East and Africa: Software Composition Analysis Market Size, By Component, 2015�2022 (USD Million)
Table 52 Middle East and Africa: Market Size, By Service, 2015�2022 (USD Million)
Table 53 Middle East and Africa: Market Size, By Professional Service, 2015�2022 (USD Million)
Table 54 Middle East and Africa: Market Size, By Deployment Type, 2015�2022 (USD Million)
Table 55 Middle East and Africa: Market Size, By Organization Size, 2015�2022 (USD Million)
Table 56 Middle East and Africa: Market Size, By Vertical, 2015�2022 (USD Million)
Table 57 Middle East and Africa: Market Size, By Country, 2015�2022 (USD Million)
Table 58 Latin America: Market Size, By Component, 2015�2022 (USD Million)
Table 59 Latin America: Market Size, By Service, 2015�2022 (USD Million)
Table 60 Latin America: Market Size, By Professional Service, 2015�2022 (USD Million)
Table 61 Latin America: Market Size, By Deployment Type, 2015�2022 (USD Million)
Table 62 Latin America: Market Size, By Organization Size, 2015�2022 (USD Million)
Table 63 Latin America: Market Size, By Vertical, 2015�2022 (USD Million)
Table 64 Latin America: Market Size, By Country, 2015�2022 (USD Million)
Table 65 Market Standing, 2017
Table 66 New Product Launches/Product Enhancements, 2017
Table 67 Business Expansions, 2015�2017
Table 68 Partnerships, Agreements, and Collaborations, 2016�2017
Table 69 Mergers and Acquisitions, 2015�2017
List of Figures (46 Figures)
Figure 1 Software Composition Analysis Market: Market Segmentation
Figure 2 Research Design
Figure 3 Breakdown of Primary Interviews: By Company, Designation, and Region
Figure 4 Data Triangulation
Figure 5 Market Size Estimation Methodology: Bottom-Up Approach
Figure 6 Market Size Estimation Methodology: Top-Down Approach
Figure 7 Market Assumptions
Figure 8 Market Size, By Component (2017 vs 2022)
Figure 9 North America is Estimated to Have the Largest Market Share in 2017
Figure 10 Top 3 Revenue Segments of the Market
Figure 11 Increasing Level of Threats in Open-Source Codes is Expected to Drive the Market Growth
Figure 12 Banking, Financial Services, and Insurance Vertical, and North America are Estimated to Have the Largest Market Shares in 2017
Figure 13 Professional Services Segment is Expected to Have the Larger Market Share Throughout the Forecast Period
Figure 14 Support and Maintenance Segment is Estimated to Have the Largest Market Share in 2017
Figure 15 Cloud Deployment Type is Expected to Grow at A Higher CAGR During the Forecast Period
Figure 16 Small and Medium-Sized Enterprises Segment is Expected to Grow at A Higher CAGR During the Forecast Period
Figure 17 Asia Pacific is Expected to Emerge as the Best Market for Investments Over the Next 5 Years
Figure 18 Banking, Financial Services, and Insurance Vertical is Estimated to Have the Largest Market Size in 2017
Figure 19 Software Composition Analysis Market: Drivers, Restraints, Opportunities, and Challenges
Figure 20 Common Vulnerability Scoring System Version 3: Scoring Distribution
Figure 21 Common Vulnerability Scoring System Version 2: Scoring Distribution
Figure 22 Services Segment is Expected to Grow at A Higher CAGR During the Forecast Period
Figure 23 Managed Services Segment is Expected to Grow at A Higher CAGR During the Forecast Period
Figure 24 Support and Maintenance Segment is Expected to Grow at the Highest CAGR During the Forecast Period
Figure 25 Cloud Deployment Type is Expected to Grow at A Higher CAGR During the Forecast Period
Figure 26 Small and Medium-Sized Enterprises Segment is Expected to Grow at A Higher CAGR During the Forecast Period
Figure 27 Retail and Ecommerce Vertical is Expected to Grow at the Highest CAGR During the Forecast Period
Figure 28 Asia Pacific is Expected to Have the Highest CAGR During the Forecast Period
Figure 29 North America: Market Snapshot
Figure 30 Asia Pacific: Market Snapshot
Figure 31 Key Developments By Leading Players in the Software Composition Analysis Market, 2015�2017
Figure 32 Synopsys: Company Snapshot
Figure 33 Synopsys: SWOT Analysis
Figure 34 Sonatype: Company Snapshot
Figure 35 Sonatype: SWOT Analysis
Figure 36 Veracode (CA Technologies): Company Snapshot
Figure 37 Veracode (CA Technologies): SWOT Analysis
Figure 38 Whitehat Security: Company Snapshot
Figure 39 Whitehat Security: SWOT Analysis
Figure 40 Whitesource Software: Company Snapshot
Figure 41 Whitesource Software: SWOT Analysis
Figure 42 Contrast Security: Company Snapshot
Figure 43 Flexera: Company Snapshot
Figure 44 nexB: Company Snapshot
Figure 45 Rogue Wave Software: Company Snapshot
Figure 46 Sourceclear: Company Snapshot


Growth opportunities and latent adjacency in Software Composition Analysis Market