Smart Weapons Market by Product (Missiles, Munitions, Guided Projectile, Guided Rocket, Guided Firearms), platform (Air, Land, Naval), Technology (Laser, Infrared, Radar, GPS, Others) & Region - Global Forecast to 2021


The smart weapons market is projected to grow from USD 11.52 Billion in 2016 to USD 15.64 Billion by 2021, at a CAGR of 6.3% during the period under consideration. This report covers the forecast of the smart weapons market and its dynamics over the next five years, while also recognizing market application gaps, recent developments in the market, and high potential countries. The market has been analyzed primarily on the basis of product (including missiles, munitions, guided projectiles, guided rockets and precision guided firearms) during the forecast period, considering 2015 as the base year.
The smart weapons market is projected to grow from USD 11.52 Billion in 2016 to USD 15.64 Billion by 2021, at a CAGR of 6.3% during the forecast period. Factors, such as armed conflicts, terror activities, cross-border disputes, and increasing military use of smart weapons are expected to fuel the growth of the smart weapons market during the forecast period.
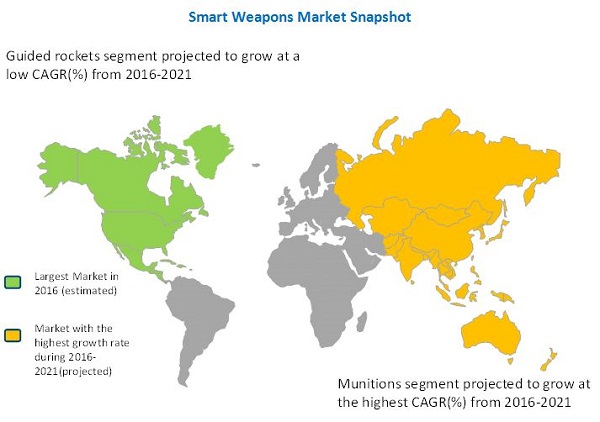
On the basis of product, the given market has been segmented into missiles, munitions, guided projectiles, guided rockets, and precision guided firearms. The munitions segment is projected to grow at the highest CAGR during the forecast period. Rising demand for smart weapons can be attributed to several factors, including use of smart weapons for tactical operations, rising territorial disputes, increasing need of precision munitions, among others.
Procurement of smart weapons by the defense sector has increased considerably in the past few years, mainly driven by increase in terrorist activities globally, especially in North America and Europe. Smart weapons with laser and infrared technologies are being procured in huge number. On the basis of technology, the infrared segment is expected to lead the overall smart weapons market in 2016. The laser segment is anticipated to grow at the highest rate in the coming years. This can be attributed to the rising demand for technologically advanced autonomous weapons.
The land segment dominates the smart weapons market, by platform. The land segment includes guided weapons, which are launched from main battle tanks, artillery, shoulder fired weapons, and precision firearms among others. The land segment is expected to grow at the highest rate during the forecast period. This can be attributed to the increasing demand for anti-tank missile systems by the U.S. government, which serves as a key driver for the growth of the land segment of the market, by platform. The U.S. Department of Defense (DoD) is currently developing the Joint Air-to-Ground Missile (JAGM), which will replace the Hellfire family of missiles. JAGM provides advanced line-of-sight and beyond-line-of-sight capabilities, including precision point and fire-and-forget (active and passive) seeker targeting technologies, increased range, and increased lethality against soft and hard, moving and stationary targets.
The North America region is expected to witness highest growth in the smart weapons market during the forecast period. Need to counter rising terrorist activities and various military equipment modernization programs are the key factors driving the market in North America.
The growth of the smart weapons market could, however, be affected by certain major restraints in the coming years. These factors include declining defense budgets of developed economies of the world, such as the U.S., Canada, the U.K., Germany, and stringent arms transfer rules and regulation laid down for the defense industry. In several countries, munition manufacturers are prohibited from exporting their products, thereby decreasing their chances of catering to the requirements of international customers.
Key players operating in the market are Lockheed Martin (U.S.), Raytheon Company (U.S.), MBDA, Inc. (U.K.), General Dynamics Corporation (U.S.), and Orbital ATK (U.S.). Contracts and acquisitions are the major growth strategies adopted by the top players to strengthen their position in the smart weapons market.
To speak to our analyst for a discussion on the above findings, click Speak to Analyst
 Exclusive indicates content/data unique to MarketsandMarkets and not available with any competitors.
Table of Contents
1 Introduction (Page No. - 20)
1.1 Objectives of the Study
1.2 Market Definition
1.3 Study Scope
1.3.1 Markets Covered
1.3.2 Years Considered for the Study
1.4 Currency & Pricing
1.5 Distribution Channel Participants
1.6 Limitations
1.7 Market Stakeholders
2 Research Methodology (Page No. - 23)
2.1 Research Data
2.1.1 Secondary Data
2.1.1.1 Key Data From Secondary Sources
2.1.2 Primary Data
2.1.2.1 Key Data From Primary Sources
2.1.2.2 Key Industry Insights
2.1.2.3 Breakdown of Primaries
2.2 Factor Analysis
2.2.1 Introduction
2.2.2 Demand-Side Analysis
2.2.2.1 Rising Incidences of Regional Disputes, Terrorism, and Political Conflicts
2.2.2.2 Increase in Military Spending of Developing Countries
2.2.3 Supply-Side Analysis
2.2.3.1 Increase in Supply of Autonomous Weapons
2.3 Market Size Estimation
2.3.1 Bottom-Up Approach
2.3.2 Top-Down Approach
2.4 Market Breakdown & Data Triangulation
2.5 Research Assumptions
3 Executive Summary (Page No. - 34)
4 Premium Insights (Page No. - 38)
4.1 Attractive Opportunities in the Smart Weapons Market, 2016-2021
4.2 Market, By Technology
4.3 Life Cycle Analysis, By Region
4.4 Market for Asia-Pacific
4.5 Global Market, By Region
5 Market Overview (Page No. - 42)
5.1 Introduction
5.2 Market Segmentation
5.2.1 Smart Weapons Market: By Product
5.2.2 Market, By Technology
5.2.3 Market, By Platform
5.2.4 Market, By Region
5.3 Market Dynamics
5.3.1 Drivers
5.3.1.1 Rising Need for Precision Munitions
5.3.1.2 Reducing Logistics Burden
5.3.1.3 Modernization and Replenishment Programs
5.3.2 Restraints
5.3.2.1 Arms Transfer Regulations
5.3.2.2 Declining Defense Budgets of Advanced Economies
5.3.3 Opportunities
5.3.3.1 Growing Demand in Emerging Nations
5.3.3.2 Standardization of Weapons
5.3.3.3 Risk From Terrorism
5.3.4 Challenges
5.3.4.1 Weapon Integration
6 Industry Trends (Page No. - 50)
6.1 Introduction
6.2 Value Chain Analysis
6.3 Strategic Benchmarking
6.3.1 Smart Weapons Market Retention Through Important Contracts
6.4 Technology Trends
6.4.1 Swarmboats, Smart Bombs, and Hypersonic Guns
6.4.2 Target Locking Technology
6.4.3 Infrared Technology
6.4.4 Network-Enabled Weapons
6.4.5 Hybrid Guidance Systems
6.4.6 Millimeter Wave Technology
6.4.7 Self Guided Firearm
6.4.8 Light Weight and Small Sized Weapon Seeker Technology
6.5 Innovation & Patent Registrations
6.6 Key Trend Analysis
7 Smart Weapons Market, By Platform (Page No. - 57)
7.1 Introduction
7.2 Land-Based
7.3 Airborne
7.4 Naval
8 Smart Weapons Market, By Product (Page No. - 62)
8.1 Introduction
8.2 Missiles
8.2.1 Anti-Tank Missiles
8.2.2 Air-To-Air & Air-To-Surface Missiles
8.2.3 Anti-Ship & Anti-Submarine Missiles
8.3 Munitions
8.3.1 Guided Bombs
8.3.2 Target Pods
8.4 Guided Rockets
8.4.1 Anti-Tank & Tactical
8.4.2 Air-To-Air & Air-To-Surface
8.4.3 Anti-Submarine
8.5 Guided Projectiles
8.5.1 Guided Mortar Rounds
8.5.2 Guided Artillery Shells
8.6 Guided Firearms
8.6.1 Small Smart Weapons
8.6.2 Shoulder-Fired Weapons
8.6.3 Smart Guns Weapons
9 Smart Weapons Market, By Technology (Page No. - 73)
9.1 Introduction
9.2 Infrared
9.2.1 IIR Homing
9.2.2 IR Homing
9.3 Lasers
9.4 Global Positioning System (GPS)
9.5 Radar
9.5.1 Active Homing
9.5.2 Passive Homing
9.6 Others
10 Regional Analysis (Page No. - 81)
10.1 Introduction
10.2 North America
10.2.1 By Product
10.2.2 By Platform
10.2.3 By Technology
10.2.4 By Country
10.2.4.1 U.S.
10.2.4.1.1 By Product
10.2.4.1.1.1 By Missiles
10.2.4.1.1.2 By Munitions
10.2.4.1.1.3 By Guided Projectiles
10.2.4.1.1.4 By Guided Rockets
10.2.4.1.1.5 By Guided Firearms
10.2.4.1.2 By Platform
10.2.4.2 Canada
10.2.4.2.1 By Product
10.2.4.2.1.1 By Missiles
10.2.4.2.1.2 By Munitions
10.2.4.2.1.3 By Guided Projectiles
10.2.4.2.1.4 By Guided Rockets
10.2.4.2.1.5 By Guided Firearms
10.2.4.2.2 By Platform
10.3 Europe
10.3.1 By Product
10.3.2 By Platform
10.3.3 By Technology
10.3.4 By Country
10.3.4.1 U.K.
10.3.4.1.1 By Product
10.3.4.1.1.1 By Missiles
10.3.4.1.1.2 By Munitions
10.3.4.1.1.3 By Guided Projectiles
10.3.4.1.1.4 By Guided Rockets
10.3.4.1.1.5 By Guided Firearms
10.3.4.1.2 By Platform
10.3.4.2 Germany
10.3.4.2.1 By Product
10.3.4.2.1.1 By Missiles
10.3.4.2.1.2 By Munitions
10.3.4.2.1.3 By Guided Projectiles
10.3.4.2.1.4 By Guided Rockets
10.3.4.2.1.5 By Guided Firearms
10.3.4.2.2 By Platform
10.3.4.3 France
10.3.4.3.1 By Product
10.3.4.3.1.1 By Missiles
10.3.4.3.1.2 By Munitions
10.3.4.3.1.3 By Guided Projectiles
10.3.4.3.1.4 By Guided Rockets
10.3.4.3.1.5 By Guided Firearms
10.3.4.3.2 By Platform
10.3.4.4 Russia
10.3.4.4.1 By Product
10.3.4.4.1.1 By Missiles
10.3.4.4.1.2 By Munitions
10.3.4.4.1.3 By Guided Projectiles
10.3.4.4.1.4 By Guided Rockets
10.3.4.4.1.5 By Guided Firearms
10.3.4.4.2 By Platform
10.4 Asia-Pacific
10.4.1 By Product
10.4.2 By Platform
10.4.3 By Technology
10.4.4 By Country
10.4.4.1 China
10.4.4.1.1 By Product
10.4.4.1.1.1 By Missiles
10.4.4.1.1.2 By Munitions
10.4.4.1.1.3 By Guided Projectiles
10.4.4.1.1.4 By Guided Rockets
10.4.4.1.1.5 By Guided Firearms
10.4.4.1.2 By Platform
10.4.4.2 Japan
10.4.4.2.1 By Product
10.4.4.2.1.1 By Missiles
10.4.4.2.1.2 By Munitions
10.4.4.2.1.3 By Guided Projectiles
10.4.4.2.1.4 By Guided Rockets
10.4.4.2.1.5 By Guided Firearms
10.4.4.2.2 By Platform
10.4.4.3 India
10.4.4.3.1 By Product
10.4.4.3.1.1 By Missiles
10.4.4.3.1.2 By Munitions
10.4.4.3.1.3 By Guided Projectiles
10.4.4.3.1.4 By Guided Rockets
10.4.4.3.1.5 By Guided Firearms
10.4.4.3.1.6 By Platform
10.4.4.4 Australia
10.4.4.4.1 By Product
10.4.4.4.1.1 By Missiles
10.4.4.4.1.2 By Munitions
10.4.4.4.1.3 By Guided Projectiles
10.4.4.4.1.4 By Guided Rockets
10.4.4.4.1.5 By Guided Firearms
10.4.4.4.2 By Platform
10.5 Middle East
10.5.1 By Product
10.5.2 By Platform
10.5.3 By Technology
10.5.4 By Country
10.5.4.1 UAE
10.5.4.1.1 By Product
10.5.4.1.1.1 By Missiles
10.5.4.1.1.2 By Munitions
10.5.4.1.1.3 By Guided Projectiles
10.5.4.1.1.4 By Guided Rockets
10.5.4.1.1.5 By Guided Firearms
10.5.4.1.2 By Platform
10.5.4.2 Saudi Arabia
10.5.4.2.1 By Product
10.5.4.2.1.1 By Missiles
10.5.4.2.1.2 By Munitions
10.5.4.2.1.3 By Guided Projectiles
10.5.4.2.1.4 By Guided Rockets
10.5.4.2.1.5 By Guided Firearms
10.5.4.2.2 By Platforms
10.5.4.3 Israel
10.5.4.3.1 By Product
10.5.4.3.1.1 By Missiles
10.5.4.3.1.2 By Munitions
10.5.4.3.1.3 By Guided Projectiles
10.5.4.3.1.4 By Guided Rockets
10.5.4.3.1.5 By Guided Firearms
10.5.4.3.1.6 By Platform
10.6 Rest of the World
10.6.1 By Product
10.6.2 By Platform
10.6.3 By Technology
10.6.4 By Region
10.6.4.1 Latin America
10.6.4.1.1 By Product
10.6.4.1.2 By Platform
10.6.4.1.3 By Technology
10.6.4.2 Africa
10.6.4.2.1 By Product
10.6.4.2.2 By Platform
11 Competitive Landscape (Page No. - 142)
11.1 Introduction
11.2 Brand Analysis
11.3 Product Mapping
11.4 Rank Analysis
11.5 Revenue and Contracts-Based Market Share Analysis of Top Companies
11.6 Competitive Situations and Trends
11.6.1 Contracts
11.6.2 New Product Launches
11.6.3 Agreements, Acquisitions, Partnerships, Collaborations, and Joint Ventures
11.6.4 Expansions
12 Company Profiles (Page No. - 156)
12.1 Introduction
12.2 Financials of the Major Players in Smart Weapons Market
(Overview, Financials, Products & Services, Strategy, and Developments)*
12.3 Lockheed Martin Corporation
12.4 Raytheon Company
12.5 MBDA, Inc.
12.6 General Dynamics Corporation
12.7 Orbital ATK
12.8 BAE Systems, PLC.
12.9 The Boeing Company
12.10 L-3 Communications Holdings, Inc.
12.11 Thales Group
12.12 Textron Inc.
12.13 Rheinmetall Ag
*Details on Overview, Financials, Product & Services, Strategy, and Developments Might Not Be Captured in Case of Unlisted Companies.
13 Appendix (Page No. - 193)
13.1 Discussion Guide
13.2 Knowledge Store: Marketsandmarkets’ Subscription Portal
13.3 Introducing RT: Real Time Market Intelligence
13.4 Available Customization
13.4.1 Country-Level Analysis
13.4.2 Additional Company Profiles (Upto 5)
13.5 Related Reports
List of Tables (160 Tables)
Table 1 Smart Weapons Market Drivers: Regional Analysis
Table 2 Factors Affecting Defense Expenditure of Advanced Economies
Table 3 Important Innovation & Patent Registrations, 2008-2014
Table 4 Market Size, By Platform, 2015–2021 (USD Million)
Table 5 Land-Based Smart Weapons Market Size, By Region, 2015–2021 (USD Million)
Table 6 Air-Based Smart Weapons Market Size, By Region, 2015–2021 (USD Million)
Table 7 Naval-Based Smart Weapons Market Size, By Region, 2015–2021 (USD Million)
Table 8 Market Size, By Product, 2015-2021 (USD Million)
Table 9 Missiles Market Size, By Region, 2015-2021 (USD Million)
Table 10 Missiles Market Size, By Product, 2015-2021 (USD Million)
Table 11 Short Range Anti–Tank Missiles
Table 12 Munitions Market Size, By Region, 2015-2021 (USD Million)
Table 13 Munitions Market Size, By Product, 2015-2021 (USD Million)
Table 14 Guided Rockets Market Size, By Region, 2015-2021 (USD Million)
Table 15 Guided Rockets Market Size, By Product, 2015-2021 (USD Million)
Table 16 Guided Projectiles Market Size, By Region, 2015-2021 (USD Million)
Table 17 Guided Projectiles Market, By Product, 2015-2021 (USD Million)
Table 18 Precision Guided Firearms Market Size, By Region, 2015-2021 (USD Million)
Table 19 Precision Guided Firearms Market Size, By Product, 2015-2021 (USD Million)
Table 20 Market Size, By Technology, 2015-2021 (USD Million)
Table 21 Infrared-Based Market Size, By Region, 2015-2021 (USD Million)
Table 22 Infrared-Based Market Size, By Subsegment, 2015-2021 (USD Million)
Table 23 Laser-Based Market Size, By Region, 2015-2021 (USD Million)
Table 24 GPS-Based Market Size, By Region, 2015-2021 (USD Million)
Table 25 Radar-Based Market Size, By Region, 2015-2021 (USD Million)
Table 26 Radar-Based Market Size, By Subsegment, 2015-2021 (USD Million)
Table 27 Others Technology-Based Market Size, By Region, 2015-2021 (USD Million)
Table 28 North America: Market Size, By Product, 2015–2021 (USD Million)
Table 29 North America: Market Size, By Platform, 2015–2021 (USD Million)
Table 30 North America: Market Size, By Technology, 2015–2021 (USD Million)
Table 31 North America: Market Size, By Country, 2015–2021 (USD Million)
Table 32 U.S.: Missiles Portfolio Overview (2015)
Table 33 U.S.: Smart Weapons Market Size, By Product, 2015–2021 (USD Million)
Table 34 U.S.: Market Size, By Subsegment, 2015–2021 (USD Million)
Table 35 U.S.: Market Size, By Subsegment, 2015–2021 (USD Million)
Table 36 U.S.: Market Size, By Subsegment, 2015–2021 (USD Million)
Table 37 U.S.: Market Size, By Subsegment, 2015–2021 (USD Million)
Table 38 U.S.: Market Size, By Subsegment, 2015–2021 (USD Million)
Table 39 U.S.: Market Size, By Platform, 2015–2021 (USD Million)
Table 40 Canada: Smart Weapons Market Size, By Product, 2015–2021 (USD Million)
Table 41 Canada: Market Size, By Subsegment, 2015–2021 (USD Million)
Table 42 Canada: Market Size, By Subsegment, 2015–2021 (USD Million)
Table 43 Canada: Market Size, By Subsegment, 2015–2021 (USD Million)
Table 44 Canada: Market Size, By Subsegment, 2015–2021 (USD Million)
Table 45 Canada: Market Size, By Subsegment, 2015–2021 (USD Million)
Table 46 Canada: Market Size, By Platform, 2015–2021 (USD Million)
Table 47 Europe: Smart Weapons Market Size, By Product, 2015–2021 (USD Million)
Table 48 Europe: Market Size, By Platform, 2015–2021 (USD Million)
Table 49 Europe: Market Size, By Technology, 2015–2021 (USD Million)
Table 50 Europe: Market Size, By Country, 2015–2021 (USD Million)
Table 51 U.K.: Missiles Portfolio Overview (2015)
Table 52 U.K.: Smart Weapons Market Size, By Product, 2015–2021 (USD Million)
Table 53 U.K.: Market Size, By Subsegment, 2015–2021 (USD Million)
Table 54 U.K.: Market Size, By Subsegment, 2015–2021 (USD Million)
Table 55 U.K.: Market Size, By Subsegment, 2015–2021 (USD Million)
Table 56 U.K.: Market Size, By Subsegment, 2015–2021 (USD Million)
Table 57 U.K.: Market Size, By Subsegment, 2015–2021 (USD Million)
Table 58 U.K.: Market Size, By Platform, 2015–2021 (USD Million)
Table 59 Germany: Missiles Portfolio Overview (2015)
Table 60 Germany: Smart Weapons Market Size, By Product, 2015–2021 (USD Million)
Table 61 Germany: Market Size, By Subsegment, 2015–2021 (USD Million)
Table 62 Germany: Market Size, By Subsegment, 2015–2021 (USD Million)
Table 63 Germany: Market Size, By Subsegment, 2015–2021 (USD Million)
Table 64 Germany: Market Size, By Subsegment, 2015–2021 (USD Million)
Table 65 Germany: Market Size, By Subsegment, 2015–2021 (USD Million)
Table 66 Germany: Market Size, By Platform, 2015–2021 (USD Million)
Table 67 France: Missiles Portfolio Overview (2015)
Table 68 France: Smart Weapons Market Size, By Product, 2015–2021 (USD Million)
Table 69 France: Market Size, By Subsegment, 2015–2021 (USD Million)
Table 70 France: Market Size, By Subsegment, 2015–2021 (USD Million)
Table 71 France: Market Size, By Subsegment, 2015–2021 (USD Million)
Table 72 France: Market Size, By Subsegment, 2015–2021 (USD Million)
Table 73 France: Market Size, By Subsegment, 2015–2021 (USD Million)
Table 74 France: Market Size, By Platform, 2015–2021 (USD Million)
Table 75 Russia: Missiles Portfolio Overview (2015)
Table 76 Russia: Smart Weapons Market Size, By Product, 2015–2021 (USD Million)
Table 77 Russia: Market Size, By Subsegment, 2015–2021 (USD Million)
Table 78 Russia: Market Size, By Subsegment, 2015–2021 (USD Million)
Table 79 Russia: Market Size, By Subsegment, 2015–2021 (USD Million)
Table 80 Russia: Market Size, By Subsegment, 2015–2021 (USD Million)
Table 81 Russia: Market Size, By Subsegment, 2015–2021 (USD Million)
Table 82 Russia: Market Size, By Platform, 2015–2021 (USD Million)
Table 83 APAC: Missiles Portfolio Overview (2015)
Table 84 APAC: Smart Weapons Market Size, By Product, 2015–2021 (USD Million)
Table 85 APAC: Market Size, By Platform, 2015–2021 (USD Million)
Table 86 APAC: Market Size, By Technology, 2015–2021 (USD Million)
Table 87 APAC: Market Size, By Country, 2015–2021 (USD Million)
Table 88 China: Missiles Portfolio Overview (2015)
Table 89 China: Market Size, By Product, 2015-2021 (USD Million)
Table 90 China: Market Size, By Subsegment, 2015-2021 (USD Million)
Table 91 China: Market Size, By Subsegment, 2015-2021 (USD Million)
Table 92 China: Market Size, By Subsegment, 2015-2021 (USD Million)
Table 93 China : Market Size, By Subsegment, 2015-2021 (USD Million)
Table 94 China: Market Size, By Subsegment, 2015-2021 (USD Million)
Table 95 China: Market Size, By Platform, 2015-2021 (USD Million)
Table 96 Japan: Market Size, By Product, 2015-2021 (USD Million)
Table 97 Japan: Market Size, By Subsegment, 2015-2021 (USD Million)
Table 98 Japan: Market Size, By Subsegment, 2015-2021 (USD Million)
Table 99 Japan: Market Size, By Subsegment, 2015-2021 (USD Million)
Table 100 Japan: Smart Weapons Market Size, By Subsegment, 2015-2021 (USD Million)
Table 101 Japan: Market Size, By Subsegment, 2015-2021 (USD Million)
Table 102 Japan: Market Size, By Platform, 2015-2021 (USD Million)
Table 103 India: Missiles Portfolio Overview (2015)
Table 104 India: Market Size, By Product, 2015-2021 (USD Million)
Table 105 India: Market Size, By Subsegment, 2015-2021 (USD Million)
Table 106 Short Range Missiles in India
Table 107 India: Market Size, By Subsegment, 2015-2021 (USD Million)
Table 108 India: Market Size, By Subsegment, 2015-2021 (USD Million)
Table 109 India: Market Size, By Subsegment, 2015-2021 (USD Million)
Table 110 India: Market Size, By Subsegment, 2015-2021 (USD Million)
Table 111 India: Market Size, By Platform, 2015-2021 (USD Million)
Table 112 Future Outlook for the Next Five Years
Table 113 Australia : Market Size, By Product, 2015-2021 (USD Million)
Table 114 Australia : Market Size, By Subsegment, 2015-2021 (USD Million)
Table 115 Australia: Market Size, By Subsegment, 2015-2021 (USD Million)
Table 116 Australia: Market Size, By Subsegment, 2015-2021 (USD Million)
Table 117 Australia: Market Size, By Subsegment, 2015-2021 (USD Million)
Table 118 Australia: Market Size, By Subsegment, 2015-2021 (USD Million)
Table 119 Australia: Market Size, By Platform, 2015-2021 (USD Million)
Table 120 Middle East: Missiles Portfolio Overview (2015)
Table 121 Middle East: Market Size, By Product, 2015–2021 (USD Million)
Table 122 Middle East: Market Size, By Platform, 2015–2021 (USD Million)
Table 123 Middle East: Market Size, By Technology, 2015–2021 (USD Million)
Table 124 Middle East: Market Size, By Country, 2015–2021 (USD Million)
Table 125 UAE: Missiles Portfolio Overview (2015)
Table 126 UAE: Market Size, By Product, 2015–2021 (USD Million)
Table 127 UAE: Market Size, By Subsegment, 2015–2021 (USD Million)
Table 128 UAE: Smart Weapons Market Size, By Subsegment, 2015–2021 (USD Million)
Table 129 UAE: Market Size, By Subsegment, 2015–2021 (USD Million)
Table 130 UAE: Market Size, By Subsegment, 2015–2021 (USD Million)
Table 131 UAE: Market Size, By Subsegment, 2015–2021 (USD Million)
Table 132 UAE: Market Size, By Platform, 2015–2021 (USD Million)
Table 133 Saudi Arabia: Market Size, By Product, 2015–2021 (USD Million)
Table 134 Saudi Arabia: Market Size, By Subsegment, 2015–2021 (USD Million)
Table 135 Saudi Arabia: Market Size, By Subsegment, 2015–2021 (USD Million)
Table 136 Saudi Arabia: Market Size, By Subsegment, 2015–2021 (USD Million)
Table 137 Saudi Arabia: Market Size, By Subsegment, 2015–2021 (USD Million)
Table 138 Saudi Arabia: Market Size, By Subsegment, 2015–2021 (USD Million)
Table 139 Saudi Arabia: Market Size, By Platform, 2015–2021 (USD Million)
Table 140 Israel: Market Size, By Product, 2015–2021 (USD Million)
Table 141 Israel: Market Size, By Subsegment, 2015–2021 (USD Million)
Table 142 Israel: Market Size, By Subsegment, 2015–2021 (USD Million)
Table 143 Israel: Market Size, By Subsegment, 2015–2021 (USD Million)
Table 144 Israel: Market Size, By Subsegment, 2015–2021 (USD Million)
Table 145 Israel: Market Size, By Subsegment, 2015–2021 (USD Million)
Table 146 Israel: Market Size, By Platform, 2015–2021 (USD Million)
Table 147 RoW: Missiles Portfolio Overview (2015)
Table 148 Rest of the World: Market Size, By Product, 2015–2021 (USD Million)
Table 149 Rest of the World: Market Size, By Platform, 2015–2021 (USD Million)
Table 150 Rest of the World: Market Size, By Technology, 2015–2021 (USD Million)
Table 151 Rest of the World: Market Size, By Region, 2015–2021 (USD Million)
Table 152 Latin America: Market Size, By Product, 2015–2021 (USD Million)
Table 153 Latin America : Market Size, By Platform, 2015–2021 (USD Million)
Table 154 Latin America : Market Size, By Technology, 2015–2021 (USD Million)
Table 155 Africa: Market Size, By Product, 2015–2021 (USD Million)
Table 156 Africa: Market Size, By Platform, 2015–2021 (USD Million)
Table 157 Contracts, May 2013–June 2016
Table 158 New Product Launches, March 2014–June 2016
Table 159 Agreements, Acquisitions, Partnerships, Collaborations & Joint Ventures, December 2013–July 2016
Table 160 Expansions , July 2014
List of Figures (64 Figures)
Figure 1 Markets Covered: Smart Weapons Market
Figure 2 Global Market: Study Years
Figure 3 Research Flow
Figure 4 Research Design: Market
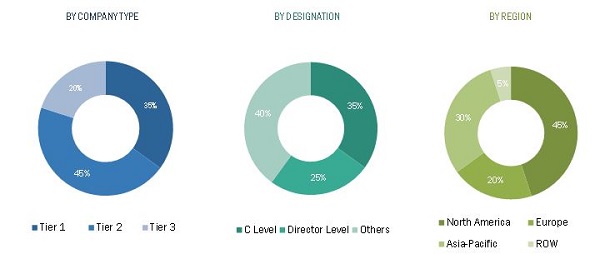
Figure 5 Breakdown of Primary Interviews: By Company Type, Designation, & Region
Figure 6 Military Expenditure of Countries
Figure 7 Market Size Estimation Methodology: Bottom-Up Approach
Figure 8 Market Size Estimation Methodology: Top-Down Approach
Figure 9 Data Triangulation
Figure 10 Assumptions of the Research Study
Figure 11 The Munitions Segment of the Market is Projected to Grow at the Highest CAGR During the Forecast Period
Figure 12 North America is Estimated to Account for the Largest Market Size During the Forecast Period
Figure 13 Contracts and Agreements are Key Growth Strategies of Major Players in the Smart Weapons Market(2012-2015)
Figure 14 Demand for Precision-Guided Munitions is Expected to Fuel the Growth of the Market, 2016-2021
Figure 15 Laser Segment to Grow at the Highest Rate During the Forecast Period
Figure 16 North America is Expected to Be the Fastest-Growing Market During the Forecast Period
Figure 17 GPS Segment Accounted for the Largest Share in the Asia-Pacific Smart Weapons Market in 2015
Figure 18 North America Accounted for the Largest Market Share in the Smart Weapons Market in 2015
Figure 19 Market Segmentation
Figure 20 Market Segmentation: By Product
Figure 21 Market Segmentation: By Technology
Figure 22 Market Segmentation: By Platform
Figure 23 Market Segmentation: By Region
Figure 24 Need for Precision Munitions to Drive the Market
Figure 25 Defense Spending of Advanced Economies, 2011-2015 (USD Million)
Figure 26 Value Chain Analysis: Major Value is Added During the Production and Assembly Phase of the Smart Weapons Manufacturing
Figure 27 Strategic Benchmarking: Lockheed Martin Largely Adopted the Market Retention Strategy
Figure 28 Technological Trends
Figure 29 Key Trend Analysis
Figure 30 Land-Based Segment Projected to Grow at the Highest CAGR During the Forecast Period
Figure 31 Munitions Segment is Expected to Grow at the Highest CAGR During the Forecast Period
Figure 32 Laser Based Smart Weapons Estimated to Grow at the Highest CAGR During the Forecast Period
Figure 33 The IIR Homing Sub Segment Estimated to Lead the Infrared-Based Smart Weapons Market in 2016
Figure 34 The Active Homing Sub Segment in Radar-Based Market Estimated to Grow at the Highest CAGR During the Forecast Period
Figure 35 Regional Snapshot : Growth Rate Analysis, 2016-2021
Figure 36 Market Snapshot: North America
Figure 37 Market Snapshot: Europe
Figure 38 Market Snapshot: APAC
Figure 39 Companies Adopted Contracts as Key Growth Strategy From January 2011 to June 2016
Figure 40 Brand Analysis of Top Players in the Smart Weapons Market
Figure 41 Product Mapping of Top Players in the Market
Figure 42 Revenue, Contracts and Product-Based Rank Analysis of Top Players in the Smart Weapons Market
Figure 43 Revenue and Product -Based Market Share Analysis for the Market
Figure 44 Market Evolution Framework, 2013 to 2015
Figure 45 Contracts and Agreements, Collaborations, Partnerships, & Joint Ventures Were the Key Growth Strategies( 2012-2016)
Figure 46 Geographical Revenue Mix, 2015
Figure 47 Financials of the Major Players in Market
Figure 48 Lockheed Martin Corporation: Company Snapshot
Figure 49 Lockheed Martin Corporation: SWOT Analysis
Figure 50 Raytheon Company: Company Snapshot
Figure 51 Raytheon Company: SWOT Analysis
Figure 52 MBDA, Inc.: SWOT Analysis
Figure 53 General Dynamics Corporation: Company Snapshot
Figure 54 General Dynamics Corporation: SWOT Analysis
Figure 55 Orbital ATK: Company Snapshot
Figure 56 Orbital ATK: SWOT Analysis
Figure 57 BAE Systems, PLC.: Company Snapshot
Figure 58 BAE Systems, PLC.: SWOT Analysis
Figure 59 The Boeing Company : Company Snapshot
Figure 60 L-3 Communication Holdings, Inc. : Company Snapshot
Figure 61 Thales Group: Company Snapshot
Figure 62 Textron Inc.: Company Snapshot
Figure 63 Rheinmetall Ag: Company Snapshot
Figure 64 Segmentation: Market
Market size estimations for various segments and subsegments of this market were arrived at through extensive secondary research and government sources, such as the U.S. Department of Defense (DoD), the U.S. Air Force website, company website, corporate filings, such as annual reports, investor presentations, and financial statements, and trade, business, and professional associations, among others. orroboration with primaries and further market triangulation with the help of statistical techniques using econometric tools were carried out. All percentage shares, splits, and breakdowns were determined using secondary sources and verified through primary sources. All possible parameters that affect the market covered in this research study have been accounted for, viewed in extensive detail, verified through primary research, and analyzed to get the final quantitative and qualitative data. This data is consolidated and added with detailed inputs and analysis from MarketsandMarkets, and presented in this report.
To know about the assumptions considered for the study, download the pdf brochure
The ecosystem of the smart weapons market comprises manufacturers, distributors, and end users. The key end user of the market is the defense sector. Technology providers smart weapons are Raytheon Company (U.S.), Israel Aerospace Industries (Israel.), L-3 Communications Ltd (U.S.), and Northrop Grumman Corporation (U.S.), among others. Key manufacturers of smart weapons are Lockheed Martin (U.S.), MBDA, Inc. (U.K.), Orbital ATK (U.S.), General Dynamics Corporation (U.S.), BAE Systems (U.K.), The Boeing Co. (U.S.), and Textron, Inc. (U.S.) among others.
“Study answers several questions for stakeholders, primarily, which segments to focus on over the next five years for prioritizing efforts and investments.”
Target Audience
- Original Equipment Manufacturers (OEMs)
- Regulatory Bodies
- Component Suppliers
- Military
- Technology Providers
- Distributors
Scope of the Report
This research report categorizes the smart weapons market into the following segments and subsegments:
-
Smart Weapons Market, By Product
-
Missiles
- Anti-tank Missiles & Standoff Missiles
- Air-to-Air & Air-to–Surface Missile
- Anti-Ship & Anti-Submarine Missile
-
Munitions
- Guided Bombs
- Target Pods
-
Guided Projectiles
- Artillery Shells
- Mortar Rounds
-
Guided Rockets
- Anti-tank & Tactical rockets
- Air-to-Air & Air-to-Surface
- Anti-Submarine
-
Precision Guided Firearms
- Small Smart Weapons
- Shoulder Fired Weapons
- Smart Guns
-
Missiles
-
Smart Weapons Market, By Technology
- Laser
-
Radar
- Active Homing
- Passive Homing
- GPS
-
Infrared
- IIR Homing
- IR Homing
-
Others
- Wire-guided
- Satellite
- Optical
- Micro computing
-
Smart Weapons Market, By Platform
- Air
- Land
- Naval
-
Smart Weapons Market, By Region
- North America
- Europe
- Asia-Pacific
- Middle East
- Rest of the World
Customizations available for the report
With the given market data, MarketsandMarkets offers customizations as per specific needs of a company. The following customization options are available for the report:
-
Country-level Analysis
- Comprehensive market projections for countries categorized under Rest of Europe, Rest of Asia-Pacific, Rest of Middle East, and Rest of the World
-
Company Information
- Detailed analysis and profiling of additional market players (Upto 5)


Growth opportunities and latent adjacency in Smart Weapons Market