Shortenings Market by Key Ingredient (Oil, Butter, Lard, Tallow), Source (Vegetable, Animal), Variant (Solid, Liquid, All-purpose, Cake/Icing), Application (Bakery, Confectionery, Snacks & Savory), and Region - Global Forecast to 2022


[165 Pages Report] The global shortenings market is projected to reach USD 4.57 Billion by 2022 in terms of value, at a CAGR of 4.2% from 2017. The objective of this study is to define, segment, and project the size of the market based on of key ingredient, source, variant, application, and region, and to provide detailed information about the crucial factors influencing market dynamics (drivers, restraints, opportunities, and industry-specific challenges). The market opportunities and competitive landscape of market leaders are also studied for the stakeholders. Competitive developments such as expansions & investments, partnerships, agreements, joint ventures & collaborations, new product launches, and acquisitions in the market are covered in the study.
The years considered for the study are as follows:
- Historic year: 2015
- Base year: 2016
- Estimated year: 2017
- Forecast year: 2022
Research Methodology
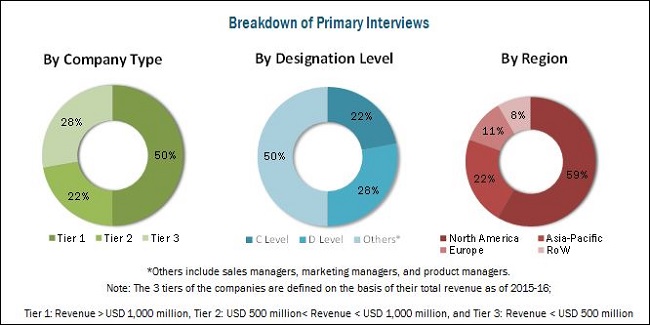
This report includes estimations of market sizes in terms of value (USD million). Both top-down and bottom-up approaches have been used to estimate and validate the size of the shortenings market and various other dependent submarkets in the overall market. Key players in the market have been identified through secondary research, and their market share in respective regions has been determined through primary and secondary research. All percentage shares, splits, and breakdowns have been determined using secondary sources, such as reports published by as reports published by the Institute of Shortening and Edible Oils (ISEO), the American Oil Chemists' Society (AOCS), and the Argentina Association of Fats and Oils (ASAGA) have been verified through primary sources.
To know about the assumptions considered for the study, download the pdf brochure
Market Ecosystem
The various contributors involved in the value chain of shortenings include oilseed growers, fat & oil processors, manufacturers, suppliers, distributors, intermediaries, and end-use industries. Various types of oilseed grow in different regions Asia-Pacific countries are major suppliers of palm oil- and palm kernel oil-based specialty fats and oils, while European and North American countries are large-scale suppliers of rapeseed oil- and soybean oil-based specialty fats & oils, respectively. The leading players in the market prefer a vertically integrated business model, which includes procuring the oilseed, crushing, refining, processing, blending, and byproduct production such as oleochemicals and feed. Maximum value addition is observed in the stages such as oil fractionation process, oil blending, and packaging.
The market is dominated by key players such as Archer Daniels Midland Company (U.S.), Cargill (U.S.), AAK AB (Sweden), Wilmar International Limited (Singapore), and Bunge Limited (U.S.). Other players in this segment include Manildra Group (Australia), Associated British Foods (U.K.), Ventura Foods, LLC (U.S.), ConAgra Brands (U.S.), and International Foodstuff Company Holdings Limited (UAE).
Target Audience:
- Raw material suppliers/growers
- Oilseed suppliers/growers
- Fat and/or oil processors/manufacturers
-
Intermediary suppliers
- Wholesalers
- Retailers
- Dealers
-
Consumers
- Processed food manufacturers
- Chocolate & confectionery manufacturers
- Bakery & dairy manufacturers
- Feed additive manufacturers
- Personal care & cosmetic companies
- Research institutes and organizations
- Government bodies, venture capitalists, and private equity firms
Scope of the report
Based on Key Ingredient, the market has been segmented as follows:
- Oil
- Butter
- Tallow
- Lard
- Others
Based on Source, the market has been segmented as follows:
- Vegetable
- Animal
Based on Variant, the market has been segmented as follows:
- Solid
- Liquid
- Cake/Icing
- All-purpose
- Others
Based on Application, the market has been segmented as follows:
- Bakery products
- Confectionery products
- Snacks & savory products
- Others
Based on Region, the market has been segmented as follows:
- North America
- Europe
- Asia-Pacific
- RoW
Available Customizations
With the given market data, MarketsandMarkets offers customizations according to the client-specific needs.
The following customization options are available for the report:
Product Analysis
- Product matrix, which gives a detailed comparison of the product portfolio of each company
Application Analysis
- Application analysis, which gives a detailed analysis of food and non-food applications in shortenings
Regional Analysis
- Further breakdown of the Rest of Europe shortenings market into the Netherlands, Ireland, Sweden, Turkey, Belgium, and Western European countries
- Further breakdown of the Rest of Asia-Pacific shortenings market into Indonesia, New Zealand, Thailand, and Malaysia
- Further breakdown of the RoW shortenings market into the Middle East countries
Company Information
- Detailed analysis and profiling of additional market players (up to five)
The shortenings market is projected to grow at a CAGR of 4.2%, in terms of value, from 2017 to reach a projected value of USD 4.57 Billion by 2022. Shortenings find a wide range of applications in the confectionery, bakery, and snacks & savory sectors. The factors such as increase in demand for shortenings in various food applications, and rise in demand for bakery and confectionery products has fueled the growth in the market. Affordability, convenience, and health benefits are the main factors that drive the baked foods market. The market for products such as breads, cereal, cakes, biscuits, and pastries is well-established in Europe. Whereas, demand for bakery and confectionery products is increasing in the Asia-Pacific region with the growing per capita consumption of breads and baked goods.
On the basis of key ingredient, the global shortenings market is segmented into oil, butter, lard, tallow, and others. The oil segment dominated the market owing to its major use in the production of various shortening products and wider availability.
On the basis of source, the global market is segmented into vegetable and animal. The vegetable segment dominated the market. The high market demand for vegetable shortenings in the industry can be attributed to the increase in awareness for healthy, fortified, non-hydrogenated trans-free vegetable shortenings.
The shortenings market is segmented on the basis of application into bakery products, confectionery products, and snacks & savory products, and others including sauces, gravies, and soups. The bakery products segment accounted for the largest share in the market. The change in consumer preferences toward the trans-fat-free products has led to the increase in demand for shortening products made with modern processes such as interesterification.
The market is segmented on the basis of variant into solid, liquid, cake/icing, all-purpose, and others. The solid segment dominated the market in 2016, whereas the all-purpose segment is projected to grow at the highest CAGR followed by the cake/icing segment. All-purpose shortenings are in demand owing to their versatile nature and multi-functional characteristics. This versatility helps them to blend well with other ingredients and give a rich and uniform taste and texture to cakes, cookies, biscuits, pie crusts, and pastries.
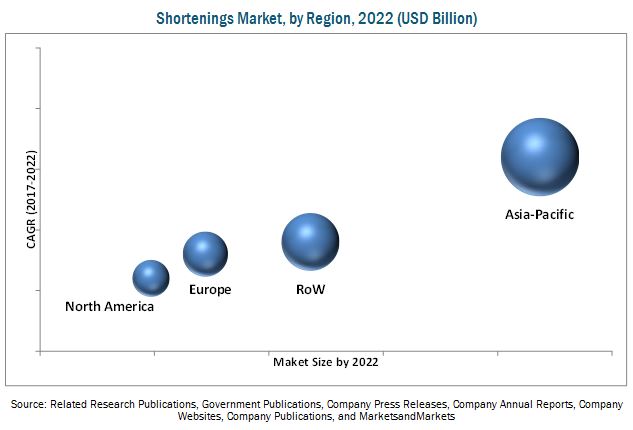
The Asia-Pacific region dominated the market and accounted for the largest share, in terms of both value and volume, in the global market, in 2016. The Asia-Pacific region comprises developing economies such as India, China, Malaysia, and Indonesia. With the rise in population and improvements in the purchasing power of consumers in developing countries such as China and India, the market in this region is expected to witness a high growth in the future. The changes in eating habits of consumers in this region have resulted in a rise in the consumption of bakery products and snacks. These factors drive the shortenings market in the Asia-Pacific region.
The consumption of trans-fatty acids is strongly associated with an increased risk of cardiovascular diseases and cancer. As a result, additional regulations are laid down on the usage of liquid oils directly in sweet goods and icings. Thus, awareness regarding the negative health effects of trans-fatty acids is affecting the confectionery ingredients industry, and in turn, the shortenings market.
The market is dominated by key players such as Archer Daniels Midland Company (U.S.), Cargill (U.S.), AAK AB (Sweden), Wilmar International Limited (Singapore), and Bunge Limited (U.S.). Other players in this segment include Manildra Group (Australia), Associated British Foods (U.K.), Ventura Foods, LLC (U.S.), ConAgra Brands (U.S.), and International Foodstuff Company Holdings Limited (UAE). The key players adopted strategic developments such as new product launches, acquisitions, joint ventures, expansions, collaborations & partnerships, and agreement & investments, in order to explore the market in new geographies.
To speak to our analyst for a discussion on the above findings, click Speak to Analyst
 Exclusive indicates content/data unique to MarketsandMarkets and not available with any competitors.
Table of Contents
1 Introduction (Page No. - 14)
1.1 Objectives of the Study
1.2 Market Definition
1.3 Study Scope
1.3.1 Geographic Scope
1.4 Periodization Considered
1.5 Currency
1.6 Unit
1.7 Stakeholders
1.8 Limitations
2 Research Methodology (Page No. - 19)
2.1 Research Data
2.1.1 Secondary Data
2.1.1.1 Key Data From Secondary Sources
2.1.2 Primary Data
2.1.2.1 Key Data From Primary Sources
2.1.2.2 Breakdown of Primaries By Company Type, Designation & Region
2.2 Market Size Estimation
2.3 Market Breakdown & Data Triangulation
2.4 Research Assumptions
2.5 Macroeconomic Indicators
2.5.1 Developing Economies With Emerging Middle-Income Population and Increasing Per Capita Income & Consumption
3 Executive Summary (Page No. - 31)
4 Premium Insights (Page No. - 35)
4.1 Overview of Global Market
4.2 Key Shortening Markets
4.3 Shortenings Market, By Key Ingredient
4.4 Asia-Pacific Dominated Global Shortenings Market
4.5 Market for F&B, By Sub-Segment
5 Market Overview (Page No. - 41)
5.1 Introduction
5.2 Market Segmentation
5.3 Market Dynamics
5.3.1 Drivers
5.3.1.1 Rise in Demand for Shortenings in Bakery Products Due to Increasing Demand for Baked Foods
5.3.1.1.1 Changing Lifestyles Causing Rise in Demand for Bakery Products
5.3.1.1.2 Rise in Demand for Shortenings in Bakery Products
5.3.2 Restraints
5.3.2.1 Health Concerns Related to Excessive Consumption of Fats & Oils
5.3.3 Opportunities
5.3.3.1 Demand for Low-Calorie Products From Consumers
5.3.3.2 Emerging Applications of Baking Ingredients
5.3.4 Challenges
5.3.4.1 Increase in Usage of Substitutes for Shortenings
5.3.4.2 Demand for Clean Label Products From Consumers
6 Industry Trends (Page No. - 47)
6.1 Introduction
6.2 Value Chain Analysis
6.2.1 International Patents for Shortenings
7 Shortenings Market, By Source (Page No. - 53)
7.1 Introduction
7.2 Vegetable Shortenings
7.3 Animal Shortenings
8 Shortenings Market, By Key Ingredient (Page No. - 58)
8.1 Introduction
8.2 Oil
8.3 Butter
8.4 Lard
8.5 Tallow
8.6 Others
9 Shortenings Market, By Variant (Page No. - 67)
9.1 Introduction
9.2 Solid Shortening
9.3 Liquid Shortening
9.4 Cake/Icing Shortening
9.5 All-Purpose Shortening
9.6 Other Shortening Variants
10 Shortenings Market, By Application (Page No. - 74)
10.1 Introduction
10.2 Bakery Products
10.3 Snacks & Savory Products
10.4 Confectionery Products
10.5 Other Applications
11 Shortenings Market, By Region (Page No. - 81)
11.1 Introduction
11.2 North America
11.3 Europe
11.4 Asia-Pacific
11.5 Rest of the World
12 Shortenings, By Process (Page No. - 103)
12.1 Introduction
12.2 Edible Oil Production Process
12.3 Hydrogenation
12.4 Fractionation
12.5 Interesterification
13 Shortenings, By Brand (Page No. - 106)
13.1 Introduction
13.2 Novalipid
13.3 Extend
13.4 Clear Valley
13.5 Wesson
13.6 Sanstrans
14 Competitive Landscape (Page No. - 108)
14.1 Overview
14.2 Shortening Market Share Analysis
14.3 Competitive Situation & Trends
14.3.1 Expansions & Investments
14.3.2 Acquisitions
14.3.3 Joint Ventures, Collaborations, Agreements, and Partnerships
14.3.4 New Product Launches
15 Company Profiles (Page No. - 119)
(Business Overview, Products Offered, Recent Developments, SWOT Analysis, MnM View)*
15.1 Introduction
15.2 Cargill
15.3 Bunge Limited
15.4 Conagra Brands
15.5 Wilmar International Limited
15.6 Archer Daniels Midland Company
15.7 International Foodstuff Company Holdings Limited (IFFCO)
15.8 Ventura Foods, LLC
15.9 Manildra Group
15.10 AAK AB
15.11 Associated British Foods PLC (ABF)
*Details on Business Overview, Products Offered, Recent Developments, SWOT Analysis, MnM View Might Not Be Captured in Case of Unlisted Companies.
16 Appendix (Page No. - 157)
16.1 Key Industry Insights
16.2 Discussion Guide
16.3 Knowledge Store: Marketsandmarkets’ Subscription Portal
16.4 Introducing RT: Real-Time Market Intelligence
16.5 Available Customizations
16.6 Author Details
List of Tables (83 Tables)
Table 1 International Patents Related to Shortenings, 1919 to 2013
Table 2 Shortenings Market Size, By Source, 2015–2022 (USD Million)
Table 3 Market Size, By Source, 2015–2022 (KT)
Table 4 Vegetable Shortenings Market Size, By Region, 2015–2022 (USD Million)
Table 5 Vegetable Shortenings Market Size, By Region, 2015–2022 (KT)
Table 6 Animal Shortenings Market Size, By Region, 2015–2022 (USD Million
Table 7 Animal Shortenings Market Size, By Region, 2015–2022 (KT)
Table 8 Shortenings Market Size, By Key Ingredient, 2015–2022 (USD Million)
Table 9 Market Size, By Key Ingredient, 2015–2022 (KT)
Table 10 Oil-Based Shortenings Market Size, By Region, 2015–2022 (USD Million)
Table 11 Oil-Based Shortenings Market Size, By Region, 2015–2022 (KT)
Table 12 Butter-Based Shortenings Market Size, By Region, 2015–2022 (USD Million)
Table 13 Butter-Based Shortenings Market Size, By Region, 2015–2022 (KT)
Table 14 Lard-Based Shortenings Market Size, By Region, 2015–2022 (USD Million)
Table 15 Lard-Based Shortenings Market Size, By Region, 2015–2022 (KT)
Table 16 Tallow-Based Shortenings Market Size, By Region, 2015–2022 (USD Million)
Table 17 Tallow-Based Shortenings Market Size, By Region, 2015–2022 (KT)
Table 18 Others: Shortenings Market Size, By Region, 2015–2022 (USD Million)
Table 19 Others: Shortenings Market Size, By Region, 2015–2022 (KT)
Table 20 Typical Solid Fat Content (SFC) Values for Shortenings
Table 21 Shortenings Market Size, By Variant, 2015–2022 (USD Million)
Table 22Market Size, By Variant, 2015-2022 (KT)
Table 23 Solid Shortenings Market Size, By Region, 2015–2022 (USD Million)
Table 24 Liquid Shortenings Market Size, By Region, 2015–2022 (USD Million)
Table 25 Cake/Icing Shortenings Market Size, By Region, 2015–2022 (USD Million)
Table 26 All-Purpose Shortenings Market Size, By Region, 2015–2022 (USD Million)
Table 27 Other Shortening Variants Market Size, By Region, 2015–2022 (USD Million)
Table 28 Shortenings Market Size, By Application, 2015–2022 (USD Million)
Table 29Market Size, By Application, 2015–2022 (KT)
Table 30 Bakery Shortenings Market Size, By Region, 2015–2022 (USD Million)
Table 31 Bakery Shortenings Market Size, By Region, 2015–2022 (KT)
Table 32 Snacks & Savory Shortenings Market Size, By Region, 2015–2022 (USD Million)
Table 33 Snacks & Savory Shortenings Market Size, By Region, 2015–2022 (KT)
Table 34 Confectionery Shortenings Market Size, By Region, 2015–2022 (USD Million)
Table 35 Confectionery Shortenings Market Size, By Region, 2015–2022 (KT)
Table 36 Other Applications Market Size, By Region, 2015–2022 (USD Million)
Table 37 Other Applications Market Size, By Region, 2015–2022 (KT)
Table 38 Global Shortenings Market Size, By Region, 2015–2022 (USD Million)
Table 39 Global Market Size, By Region, 2015–2022 (KT)
Table 40 North America: Shortenings Market Size, By Country, 2015–2022 (USD Million)
Table 41 North America: Market Size, By Country, 2015–2022 (KT)
Table 42 North America: Market Size, By Source, 2015–2022 (USD Million)
Table 43 North America: Market Size, By Source, 2015–2022 (KT)
Table 44 North America: Market Size, By Key Ingredient, 2015–2022 (USD Million)
Table 45 North America: Market Size, By Key Ingredient, 2015–2022 (KT)
Table 46 North America: Market Size, By Variant, 2015–2022 (USD Million)
Table 47 North America: Market Size, By Variant, 2015-2022 (KT)
Table 48 North America: Market Size, By Application, 2015–2022 (USD Million)
Table 49 North America: Shortenings Market Size, By Application, 2015–2022 (KT)
Table 50 Europe: Shortenings Market Size, By Country, 2015–2022 (USD Million)
Table 51 Europe: Market Size, By Country, 2015–2022 (KT)
Table 52 Europe: Market Size, By Source, 2015–2022 (USD Million)
Table 53 Europe: Market Size, By Source, 2015–2022 (KT)
Table 54 Europe: Market Size, By Key Ingredient, 2015–2022 (USD Million)
Table 55 Europe: Market Size, By Key Ingredient, 2015–2022 (KT)
Table 56 Europe: Market Size, By Variant, 2015–2022 (USD Million)
Table 57 Europe: Shortenings Market Size, By Variant, 2015–2022 (KT)
Table 58 Europe: Market Size, By Application, 2015–2022 (USD Million)
Table 59 Europe: Market Size, By Application, 2015–2022 (KT)
Table 60 Asia-Pacific: Shortenings Market Size, By Country, 2015–2022 (USD Million)
Table 61 Asia-Pacific: Market Size, By Country, 2015–2022 (KT)
Table 62 Asia-Pacific: Market Size, By Source, 2015–2022 (USD Million)
Table 63 Asia-Pacific: Market Size, By Source, 2015–2022 (KT)
Table 64 Asia-Pacific: Market Size, By Key Ingredient, 2015–2022 (USD Million)
Table 65 Asia-Pacific: Market Size, By Key Ingredient, 2015–2022 (KT)
Table 66 Asia-Pacific: Market Size, By Variant, 2015–2022 (USD Million)
Table 67 Asia-Pacific: Market Size, By Variant, 2015–2022 (KT)
Table 68 Asia-Pacific: Shortenings Market Size, By Application, 2015–2022 (USD Million)
Table 69 Asia-Pacific: Shortenings Market Size, By Application, 2015–2022 (KT)
Table 70 RoW: Shortenings Market Size, By Country, 2015–2022 (USD Million)
Table 71 RoW: Market Size, By Country, 2015–2022 (KT)
Table 72 RoW: Market Size, By Source, 2015–2022 (USD Million)
Table 73 RoW: Market Size, By Source, 2015–2022 (KT)
Table 74 RoW: Market Size, By Key Ingredient, 2015–2022 (USD Million)
Table 75 RoW: Market Size, By Key Ingredient, 2015–2022 (KT)
Table 76 RoW: Market Size, By Variant, 2015–2022 (USD Million)
Table 77 RoW: Market Size, By Variant, 2015–2022 (KT)
Table 78 RoW: Market Size, By Application, 2015–2022 (USD Million)
Table 79 RoW: Shortenings Market Size, By Application, 2015–2022 (KT)
Table 80 Expansions & Investments, 2012–2016
Table 81 Acquisitions, 2012–2016
Table 82 Joint Ventures, Collaborations, Agreements, and Partnerships, 2012–2016
Table 83 New Product Launches, 2012–2016
List of Figures (45 Figures)
Figure 1 Market Segmentation
Figure 2Research Design
Figure 3 Market Size Estimation Methodology: Bottom-Up Approach
Figure 4 Market Size Estimation Methodology: Top-Down Approach
Figure 5 Data Triangulation Methodology
Figure 6 Global GDP at Current Prices From 2010 to 2020 (USD Billion)
Figure 7 U.S., China, Japan, Germany & U.K. the Top Five Economies Based on GDP (Ppp) in 2015
Figure 8 Asia-Pacific Middle-Class to Hold Largest Share in Global Population By 2030
Figure 9 Increase in Global Per Capita Disposable Income, 2010–2014
Figure 10 Global Shortenings Market Size, By Region, 2017–2022 (USD Million)
Figure 11 Oil to Hold Largest Share of Shortenings Market, By Key Ingredient, During 2017–2022 (USD Million)
Figure 12 Bakery Products to Account for Largest Share of Shortenings Application Market During 2017-2022
Figure 13 Asia-Pacific to Record Highest Growth in Global Shortenings Market During 2017–2022
Figure 14 Favorable Functionalities and Growth in Developing Regions Driving Shortenings Market
Figure 15 Emerging Markets to Drive Growth of Global Shortenings Market
Figure 16 Asia-Pacific Shortenings Market Poised for Robust Growth During 2017-2022
Figure 17 Oil Segment to Record Highest Growth in Shortenings Market, By Key Ingredient, During 2017-2022
Figure 18 Oil Segment Holds Largest Share in Asia-Pacific Shortenings Market, By Key Ingredient, in 2016
Figure 19 Bakery Products to Hold Largest Share in F&B Shortenings Market During 2017-2022 (USD Million)
Figure 20 Shortenings Market Segmentation
Figure 21 Rising Demand for Bakery & Confectionery Products and Processed Foods the Key Driver of Shortenings Market
Figure 22 European Per Capita Consumption of Fine Baked Goods During 2009-2014 (Kilograms)
Figure 23 Value Chain Analysis: Major Value Addition Takes Place During Manufacturing and Assembly
Figure 24 Shortenings: International Patents Filing Trend
Figure 25 Shortenings Market Size, By Source, 2017 vs 2022 (USD Million)
Figure 26 Market Size, By Key Ingredient, 2017 vs 2022 (USD Million)
Figure 27 Market Size, By Variant, 2017 vs 2022 (USD Million )
Figure 28 Shortenings Market Size, By Application, 2017 vs 2022 (USD Million)
Figure 29 Geographic Snapshot: Emerging New Hotspots for Shortenings Market, CAGR% (2017–2022)
Figure 30 Asia-Pacific Shortenings Market Snapshot
Figure 31 Expansions & Investments the Most Preferred Strategy Among Companies in Shortenings Market During 2012–2016
Figure 32 Shortenings Market Share (Developments), By Key Player, 2015 - 2016
Figure 33 Expansions & Investments and Acquisitions Fueled Growth & Innovation in the Shortenings Market During 2012-2016
Figure 34 Geographic Revenue Mix of Top Five Shortenings Producers
Figure 35 Cargill: Company Snapshot
Figure 36 Cargill: SWOT Analysis
Figure 37 Bunge Limited: Company Snapshot
Figure 38 Bunge Limited: SWOT Analysis
Figure 39 Conagra Brands: Company Snapshot
Figure 40 Wilmar International Limited: Company Snapshot
Figure 41 Wilmar International Limited: SWOT Analysis
Figure 42 Archer Daniels Midland Company: Company Snapshot
Figure 43 Archer Daniels Midland Company: SWOT Analysis
Figure 44 AAK AB: Company Snapshot
Figure 45 Associated British Foods PLC: Company Snapshot


Growth opportunities and latent adjacency in Shortenings Market