Serious Game Market by Vertical (Education, Corporate, Healthcare, Retail, Media and Advertising), Application (Training, Sales, Human Resource, Marketing), Platform, End-User (Enterprise, Consumer), and Region - Forecast to 2020


Serious game simulates the real world into a virtual world scenario. They are basically designed to provide education and training related services. The serious game market is witnessing rapid growth. Potential benefits of serious games include improved self-monitoring, enhanced problem recognition and problem solving abilities, and increased social skills such as collaboration, negotiation, and decision making. Serious games can be applied to a broad spectrum of industry verticals such as military, government, education, corporate, and healthcare.
Serious games cater to various applications across industry verticals. The serious game market has been segmented based on vertical into aerospace & defense, automotive, corporate, education, energy, government, healthcare, retail, media & advertising, and others. The education and corporate segments account for the major share of the market and are also expected to grow at the highest CAGR between 2015 and 2020.
The report profiles the major companies in the serious game market. It also provides the competitive landscape of key players along with, detailing their growth strategy in the serious game market. The report also covers the entire value chain of the market, including an in-depth analysis of the same. The market is expected to grow at a CAGR of 16.38% between 2015 and 2020.
The report also details the market dynamics such as drivers, restraints, challenges, and opportunities. It also provides Porter�s Five Forces analysis with a description of each of its forces and their respective impact on the market. The major players in the serious game market include IBM Corp. (U.S.), Cisco Systems Inc. (U.S.), Microsoft Corp. (U.S.), Nintendo Co. Ltd. (Japan), BreakAway Games (U.S.), and Serious Game International (U.K.) among others. The detailed explanation of the different market segments has been given below:
Market by Vertical:
The serious game market has been segmented based on vertical into aerospace & defence, automotive, corporate, education, energy, government, healthcare, retail, media & advertising, and others (research, tourism, and agriculture).
Market by Application:
The serious game market has been segmented based on application into emergency services, human resources, marketing, product development, sales, training, and support.
Market by Platform:
The serious game market has been segmented on the basis of platform into hand-held, mobile-based, PC-based, and web-based.
Market by End User:
The serious game market includes two main end users, namely, consumer and enterprise.
Market by Region:
The serious game market has been segmented into four different regions, namely, North America, Europe, Asia-Pacific (APAC), and the rest of the world (RoW).
Serious game is a game that has a purpose beyond pure entertainment. The market for these games has been growing rapidly over a decade. Serious games have huge potential in various domains including education, corporate, defence, healthcare, and advertising. For a serious game to be successful, the game designer needs to accomplish a balance between the fun element and the main purpose of the game. Moreover, the designer needs to understand the customer needs while designing a game. Serious games are being used for training, marketing, sales, product development, emergency services, recruitment, and support.
They have found application in various industry verticals such as aerospace & defence, automotive, corporate, education, energy, government, healthcare, retail, media & advertising, and others (research, tourism, and agriculture). Verticals such as corporate, education, and media & advertising are expected to record high growth rate between 2015 and 2020. However, the education sector accounts for the major share of the said market.
This report describes the market trends, drivers, and challenges for the serious game market and forecasts the market between 2015 and 2020 on the basis of vertical, application, platform, end user, and region. The factors driving the market include the high return on investment, increased need for user engagement across enterprises and consumer brands, growing usage of mobile-based educational games, and improved learning outcomes.
Serious Game Market, 2014-2020
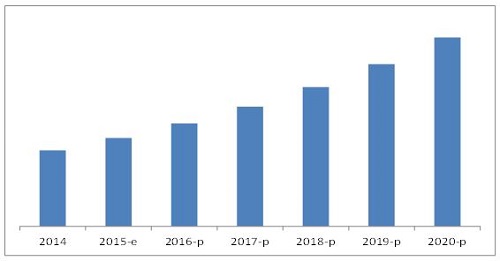
E � Estimated; P � Projected
Source: Press Releases, Investor Relation Presentations, Annual Reports, Expert Interviews, and MarketsandMarkets Analysis
The serious game market is expected to grow at $5,448.82 Million by 2020, CAGR of 16.38% between 2015 and 2020. The education segment accounts for the major share of the market. This segment accounted for a market share of ~18% in 2014 and is expected to grow at a CAGR of 17.62% between 2015 and 2020. The corporate segment is expected to be the highest growing industry vertical during the forecast period and is projected to grow at a CAGR of 18.37% between 2015 and 2020.
APAC is expected to be the fastest-growing region in the serious game market at a CAGR of 18.06% between 2015 and 2020. In APAC, China accounted for a major market share of ~40% in 2014 and countries such as India and South Korea are expected to grow at the highest CAGR between 2015 and 2020. The growing interest of manufacturers in serious games and the increasing emphasis on the development of serious games are propelling the growth of the market in the APAC region.
The major players involved in the development of serious game market include IBM Corp. (U.S.), Cisco Systems Inc. (U.S.), Microsoft Corp. (U.S.), Nintendo Co. Ltd. (Japan), BreakAway Games (U.S.), and Serious Game International (U.K.) among others.
 Exclusive indicates content/data unique to MarketsandMarkets and not available with any competitors.
Table of Contents
1 Introduction (Page No. - 14)
1.1 Objectives of the Study
1.2 Market Definition
1.3 Scope of the Study
1.3.1 Market By Vertical, Application, Platform, and End-User
1.3.2 Region Analysis
1.3.3 Years Considered for the Study
1.4 Currency & Pricing
1.5 Limitations
1.6 Stakeholders
2 Research Methodology (Page No. - 18)
2.1 Research Data
2.1.1 Secondary Data
2.1.1.1 Key Data From Secondary Sources
2.1.2 Primary Data
2.1.2.1 Key Data From Primary Sources
2.1.2.2 Key Industry Insights
2.1.2.3 Breakdown of Primaries
2.2 Demand-Side Analysis
2.2.1 Introduction
2.2.1.1 the Implementation of Serious Game Would Greatly Help in Cost Saving
2.2.1.2 Death Due to Medical Errors
2.2.1.3 Increasing Proliferation of Mobile Devices and Social Media
2.3 Market Size Estimation
2.3.1 Bottom-Up Approach
2.3.2 Top-Down Approach
2.4 Market Breakdown & Data Triangulation
2.5 Research Assumptions
3 Executive Summary (Page No. - 28)
4 Premium Insight � Serious Game Market (Page No. - 29)
4.1 Market, 2015-2020 (Million USD)
4.2 Market- Application Segment (2015-2020)
4.3 Market, By Region and Platform (2014)
4.4 Market, By Country (2015)
4.5 Top Five Application in Market (2015)
4.6 Market, By Asia-Pacific � 2020
5 Market Overview (Page No. - 35)
5.1 Introduction
5.2 Evolution
5.3 Market Segmentation
5.3.1 By Vertical
5.3.2 By Application
5.3.3 By Platform
5.3.4 By End User
5.3.5 By Region
5.4 Market Dynamics
5.4.1 Drivers
5.4.1.1 Serious Game Drives Real Roi (Return on Investment)
5.4.1.2 Increased Need for User Engagement Across Enterprises and Consumer Brands
5.4.1.3 Growing Usage of Mobile-Based Educational Games
5.4.1.4 Improved Learning Outcomes is Expected to Increase the Adoption of Serious Game Among End Users
5.4.2 Restraints
5.4.2.1 Improper Game Design Could Hinder the Market Growth
5.4.2.2 Lack of Awareness About Serious Game
5.4.2.3 Lack of Assessment Tools to Measure Serious Game Effectiveness
5.4.3 Opportunities
5.4.3.1 Explosion of the Digital World
5.4.3.2 Emergence of Social Networks to Pave New Growth Avenues
5.4.4 Challenges
5.4.4.1 Unavailability of Direct-To-Consumer Based Serious Game
6 Industry Trend (Page No. - 47)
6.1 Introduction
6.2 Value Chain Analysis
6.3 Porter�s Five Forces Analysis
6.3.1 Intensity of Rivalry
6.3.2 Threat of Substitutes
6.3.3 Bargaining Power of Buyers
6.3.4 Bargaining Power of Suppliers
6.3.5 Threat of New Entrants
6.1 Strategic Benchmarking
6.1.1 Technology Integration and Product Enhancement
7 Market Analysis, By Vertical (Page No. - 55)
7.1 Introduction
7.2 Aerospace and Defence
7.3 Automotive
7.4 Corporate
7.5 Education
7.6 Energy
7.7 Government
7.8 Healthcare
7.9 Retail
7.10 Media and Advertising
7.11 Others
8 Market Analysis, By Application (Page No. - 77)
8.1 Introduction
8.2 Emergency Services
8.3 Human Resources
8.4 Marketing
8.5 Product Development
8.6 Sales
8.7 Training
8.8 Support
9 Platform Analysis (Page No. - 79)
9.1 Introduction
9.2 Hand-Held
9.3 Mobile-Based
9.4 PC-Based
9.5 Web-Based
10 End User Analysis (Page No. - 83)
10.1 Introduction
10.2 Consumer
10.3 Enterprise
11 Regional Analysis (Page No. - 93)
11.1 Introduction
11.2 North America
11.3 Europe
11.4 Asia-Pacific (APAC)
11.5 Rest of the World (RoW)
12 Competitive Landscape (Page No. - 115)
12.1 Overview
12.2 Competitive Situation and Trends
12.2.1 Partnerships, Agreements, and Contracts
12.2.2 New Product Development
12.2.3 New Product Launch
12.2.4 Other Developments
13 Company Profiles (Page No. - 123)
13.1 Introduction
13.2 Cisco Systems Inc.
13.2.1 Business Overview
13.2.2 Product Portfolio
13.2.3 MnM View
13.2.3.1 SWOT Analysis
13.3 IBM Corporation
13.3.1 Business Overview
13.3.2 Products and Services
13.3.3 MnM View
13.3.3.1 SWOT Analysis
13.4 Microsoft Corporation.
13.4.1 Business Overview
13.4.2 Products and Services
13.4.3 Recent Developments
13.4.4 MnM View
13.4.4.1 SWOT Analysis
13.5 Nintendo Co. Ltd.
13.5.1 Business Overview
13.5.2 Product Portfolio
13.5.3 Recent Developments
13.5.4 MnM View
13.5.4.1 SWOT Analysis
13.6 Serious Game International
13.6.1 Business Overview
13.6.2 Product and Services
13.6.3 Recent Developments
13.6.4 MnM View
13.6.4.1 SWOT Analysis
13.7 Applied Research Associate Inc.
13.7.1 Business Overview
13.7.2 Product Portfolio
13.7.3 Recent Developments
13.8 Breakaway Ltd.
13.8.1 Business Overview
13.8.2 Products and Services
13.9 Ccs Digital Education
13.9.1 Business Overview
13.9.2 Product and Services
13.10 Designing Digitally Inc.
13.10.1 Business Overview
13.10.2 Product Portfolio
13.10.3 Recent Developments
13.11 Serious Game Interactive
13.11.1 Business Overview
13.11.2 Product Portfolio
14 Appendix (Page No. - 148)
14.1 Insights of Industry Experts
14.2 Discussion Guide
14.3 Introducing RT: Real Time Market Intelligence
14.4 Available Customizations
14.5 Related Reports
List of Tables (70 Tables)
Table 1 Regional Share of Smart Devices and Connections (% of the Regional Total), 2014 vs. 2019
Table 2 High Return on Investment is Propelling the Growth of the Market
Table 3 Improper Game Design is Restraining the Market Growth
Table 4 Explosion of Digital World is Expected to Boost the Market
Table 5 Unavailability of Direct-To-Consumer Based Serious Game is Expected to Be A Challenge for End Users
Table 6 Market, By Vertical, 2014�2020 (Million USD)
Table 7 Aerospace and Defense: Market, By Application, 2014�2020 (Million USD)
Table 8 Aerospace and Defense: Market, By Region, 2014�2020 (Million USD)
Table 9 Automotive: Market, By Application, 2014�2020 (Million USD)
Table 10 Automotive: Market, By Region, 2014�2020 (Million USD)
Table 11 Corporate: Market, By Application, 2014�2020 (Million USD)
Table 12 Corporate: Market, By Region, 2014�2020 (Million USD)
Table 13 Education: Market, By Application, 2014�2020 (Million USD)
Table 14 Education: Market, By Region, 2014�2020 (Million USD)
Table 15 Energy: Market, By Application, 2014�2020 (Million USD)
Table 16 Energy: Market, By Region, 2014�2020 (Million USD)
Table 17 Government: Market, By Application, 2014�2020 (Million USD)
Table 18 Government: Serious Game Market, By Region, 2014�2020 (Million USD)
Table 19 Healthcare: Market, By Application, 2014�2020 (Million USD)
Table 20 Healthcare: Market, By Region, 2014�2020 (Million USD)
Table 21 Retail: Market, By Application, 2014�2020 (Million USD)
Table 22 Retail: Market, By Region, 2014�2020 (Million USD)
Table 23 Media & Advertising :Market, By Application, 2014�2020 (Million USD)
Table 24 Media & Advertising : Market, By Region, 2014�2020 (Million USD)
Table 25 Other Serious Game Market, By Application, 2014�2020 (Million USD)
Table 26 Other Market, By Region, 2014�2020 (Million USD)
Table 27 Market, By Application, 2014-2020 (Million USD)
Table 28 Emergency Services: Serious Game Market, By Vertical, 2014�2020 (Million USD)
Table 29 Emergency Services: Market, By End�User, 2014�2020 (Million USD)
Table 30 Human Resources: Market, By Vertical, 2014�2020 (Million USD)
Table 31 Human Resources: Market, By End�User, 2014�2020 (Million USD)
Table 32 Marketing: Market, By Vertical, 2014�2020 (Million USD)
Table 33 Marketing: Serious Game Market, By End�User, 2014�2020 (Million USD)
Table 34 Product Development: Serious Game Market, By Vertical, 2014�2020 (Million USD)
Table 35 Product Development: Market, By End�User, 2014�2020 (Million USD)
Table 36 Sales: Market, By Vertical, 2014�2020 (Million USD)
Table 37 Sales: Market, By End�User, 2014�2020 (Million USD)
Table 38 Training: Market, By Vertical, 2014�2020 (Million USD)
Table 39 Training: Market, By End�User, 2014�2020 (Million USD)
Table 40 Support: Serious Game Market, By Vertical, 2014�2020 (Million USD)
Table 41 Support: Market, By End�User, 2014�2020 (Million USD)
Table 42 Serious Game Market, By Platform, 2014�2020 (Million USD)
Table 43 Market, By End User, 2014�2020 (Million USD)
Table 44 Consumer End User: Serious Game Market, By Vertical, 2014�2020 (Million USD)
Table 45 Consumer End User: Market, By Application, 2014�2020 (Million USD)
Table 46 Consumer End User: Market, By Region, 2014�2020 (Million USD)
Table 47 Enterprise End User: Market, By Vertical, 2014�2020 (Million USD)
Table 48 Enterprise End User: Market, By Application, 2014�2020 (Million USD)
Table 49 Enterprise End User: Market, By Region, 2014�2020 (Million USD)
Table 50 Market, By Region, 2014�2020 (Million USD)
Table 51 North America: Serious Game Market, By Country, 2014�2020 (Million USD)
Table 52 North America: Market, By Vertical, 2014�2020 (Million USD)
Table 53 North America: Market, By Platform, 2014�2020 (Million USD)
Table 54 North America: Market, By End User, 2014�2020 (Million USD)
Table 55 Europe: Serious Game Market, By Country, 2014�2020 (Million USD)
Table 56 Europe: Market, By Vertical, 2014�2020 (Million USD)
Table 57 Europe: Market, By Platform, 2014�2020 (Million USD)
Table 58 Europe: Market, By End User, 2014�2020 (Million USD)
Table 59 APAC: Market, By Country, 2014�2020 (Million USD)
Table 60 APAC: Market, By Vertical, 2014�2020 (Million USD)
Table 61 APAC: Market, By Platform, 2014�2020 (Million USD)
Table 62 APAC: Market, By End User, 2014�2020 (Million USD)
Table 63 RoW: Serious Game Market, By Country, 2014�2020 (Million USD)
Table 64 RoW: Market, By Vertical, 2014�2020 (Million USD)
Table 65 RoW: Market, By Platform, 2014�2020 (Million USD)
Table 66 RoW: Market, By End User, 2014�2020 (Million USD)
Table 67 Partnerships, Agreements, Collaborations, and Contracts, 2011-2014
Table 68 New Product Development, 2012 - 2015
Table 69 New Product Launch, 2012 - 2015
Table 70 Other Developments, 2012-2015
List of Figures (67 Figures)
Figure 1 Serious Game Market, By Vertical
Figure 2 Research Design
Figure 3 Bottom-Up Approach
Figure 4 Top-Down Approach
Figure 5 Data Triangulation
Figure 6 Assumptions of the Research Study
Figure 7 Attractive Opportunity in the Market
Figure 8 Training Application Accounted for the Highest Market Share in Serious Game Market
Figure 9 Mobile-Based Serious Game Accounted for the Highest Market Share
Figure 10 The U.S. Had the Highest Share in the Market in 2015
Figure 11 The Serious Game in Corporate and Education Sector is Expected to Be the Highest in North America
Figure 12 India is Expected to Grow at A Higher CAGR Between 2015 and 2020
Figure 13 Evolution of Serious Game
Figure 14 Serious Game Market Segmentation: By Vertical
Figure 15 Market Segmentation: By Application
Figure 16 Market Segmentation: By Platform
Figure 17 Market Segmentation: By End User
Figure 18 Market Segmentation: By Region
Figure 19 The Return on Investment is Expected to Spur the Demand for the Serious Game Market
Figure 20 Value Chain Analysis: Major Value is Added During the Development of Serious Game
Figure 21 Porter�s Five Forces Analysis
Figure 22 Intensity of Rivalry
Figure 23 Threat of Substitutes
Figure 24 Bargaining Power of Buyers
Figure 25 Bargaining Power of Suppliers
Figure 26 Threat of New Entrants
Figure 27 Strategic Benchmarking: Microsoft and Nintendo Largely Adopted Organic Growth Strategies for Technology Integration and Product Enhancement
Figure 28 Serious Game Market Segmentation: By Vertical
Figure 29 North America Dominated the Aerospace and Defense Serious Game Market
Figure 30 Sales Application is Expected to Grow at A Higher CAGR Between 2015 and 2020 in Corporate Sector
Figure 31 APAC is Expected to Grow at the Highest CAGR During the Forecast Period in Education Sector
Figure 32 Training Application is Expected to Dominate the Government Sector Between 2015 and 2020
Figure 33 Sales Application is Expected to Grow at A Higher CAGR During 2015 and 2020 in Retail Sector
Figure 34 North America Accounted for A Major Market Share of the Media and Advertising Serious Game Market
Figure 35 Serious Game Market Segmentation: By Platform
Figure 36 Mobile-Based Games are Expected to Dominate the Serious Game Market During Forecast Period
Figure 37 Market Segmentation: By End User
Figure 38 Education Dominates the Consumer End User Market Between 2015 and 2020
Figure 39 Sales Application Accounted for A Major Market Share of the Enterprise End User Market
Figure 40 Geographic Snapshot (2014) � Rapid Growth Markets are Emerging as New Hot Spots
Figure 41 North America Dominates the Serious Game Market During 2015 and 2020
Figure 42 North America Snapshot (2014-2020): Demand Will Be Driven By Strong Support From U.S. Government
Figure 43 Enterprise Segment is Expected to Dominate North American Serious Game Market
Figure 44 Web-Based Serious Games are Expected to Grow at A Higher CAGR in the European Market
Figure 45 Asia Pacific Serious Game Market Snapshot - China is the Most Lucrative Market
Figure 46 Healthcare Dominates the APAC Serious Game Market Between 2015 and 2020
Figure 47 South America is Expected to Dominate as Well as Grow at A Higher Rate During 2015 and 2020
Figure 48 Mobile-Based Serious Game Accounted for A Major Market Share of the RoW Market
Figure 49 Companies Adopted Partnerships, Agreements, and Contracts as Key Growth Strategies During 2012 and 2015
Figure 50 Microsoft Corp. Grew at the Fastest Rate Between 2012 and 2014
Figure 51 Market Evolution Framework-Significant Partnerships, Agreements, and Contracts Have Fuelled the Growth and Innovation in 2014
Figure 52 Battle for Market Share: Partnerships, Agreements, and Contracts Was the Key Strategy
Figure 53 Geographic Revenue Mix of Top Five Market Players
Figure 54 Cisco Systems Inc.: Company Snapshot
Figure 55 Cisco Systems Inc.: SWOT Analysis
Figure 56 IBM Corporation: Company Snapshot
Figure 57 IBM Corporation: SWOT Analysis
Figure 58 Microsoft Corporation: Company Snapshot
Figure 59 Microsoft Corporation: SWOT Analysis
Figure 60 Nintendo Co. Ltd.: Company Snapshot
Figure 61 Nintendo Co. Ltd.: SWOT Analysis
Figure 62 Serious Game International: Company Snapshot
Figure 63 Serious Game International: SWOT Analysis
Figure 64 Applied Research Associate Inc.: Company Snapshot
Figure 65 Breakaway Ltd.: Company Snapshot
Figure 66 Designing Digitally Inc.: Company Snapshot
Figure 67 Serious Game Interactive: Company Snapshot


Growth opportunities and latent adjacency in Serious Game Market