Security Paper Market by Component (Substrates, Watermarks, Threads, and Holograms), Application (Banknotes, Passports, Identity Cards, Certificates, Legal & Government Documents, Cheques, and Stamps), and Region - Global Forecast to 2023


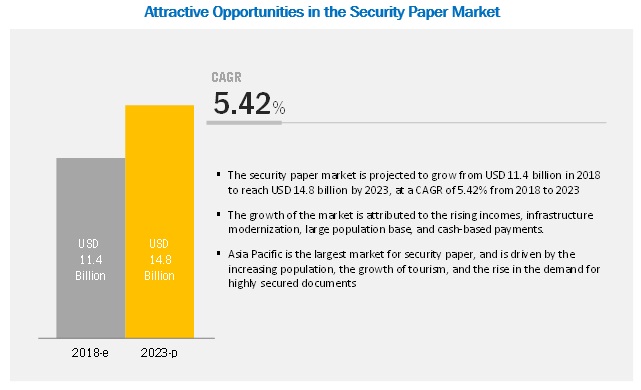
[156 Pages Report] The security paper market is projected to grow from USD 11.4 billion to reach USD 14.8 billion by 2023, at a CAGR of 5.42% from 2018 to 2023. The growth of this market is attributed to the rising incomes, infrastructure modernization, large population base, and cash-based payments. Further, an increase in the number of fraud and counterfeiting cases have boosted the demand for security papers across various applications.
In terms of value and volume, the substrates segment is projected to lead the security paper market from 2018 to 2023.
Based on components, the substrates segment is projected to lead the security paper market, in terms of value, from 2018 to 2023. Polymer substrate is one of the key elements used for manufacturing security paper. The long lifespan of the polymer has contributed to the growing demand for plastic in the manufacture of security papers. Hybrid security papers are another type of substrate, which are special papers with security features containing watermarks, security fibers, and threads, and are used in various types of security documents. Hybrid papers include photographic papers, polymer substrates, and fabric. Hybrid papers are luminescent in UV light and contain special supplements and chemical components, which prevent mechanical and chemical erasures and other types of forgery.
In terms of value, the banknotes segment of the security paper market is projected to grow at the highest CAGR during the forecast period.
Based on application, the banknotes segment of the security paper market is projected to grow at the highest CAGR, in terms of value, during the forecast period. The growth of this segment is attributed to the constant printing, circulation, and reprinting of banknotes, coupled with the rise in a number of cases of counterfeit notes, which are projected to drive the demand for security papers for banknotes. Moreover, the growth in tourism is projected to boost the demand for passports and visas, which in turn, is projected to drive the security paper market. Furthermore, due to the growing concerns toward national security, a number of countries are majorly focusing on developing highly secured ID cards, boosting the usage of security papers in identity cards.
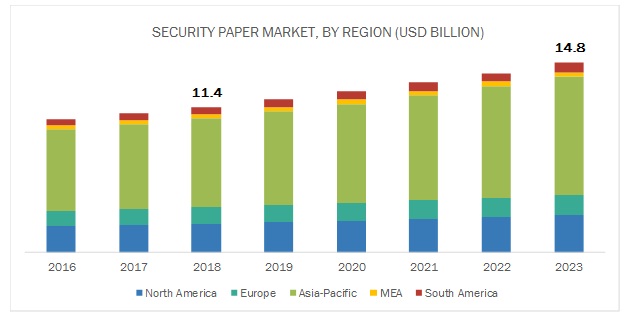
In terms of value, the Asia Pacific security paper market is projected to grow at the highest CAGR during the forecast period.
The Asia Pacific security paper market is projected to grow at the highest CAGR from 2018 to 2023, in terms of value and volume. China is the largest country-wise market in the region and is projected to dominate the market in this region over the next five years. The growth of the security paper market in the Asia Pacific region is attributed to the strong demand for security features such as watermarks, holograms being embedded during the printing stage of banknotes, passports, and stamps, the growing tourism industry, economic stability, increasing incomes, and infrastructure. Furthermore, the growth of the security paper market in the region is also driven by the increasing demand for banknotes due to the population growth and cash-based economy in some countries such as India and Indonesia. High demand for security papers in the region is attributed to the increased spending on legal services such as documentation, litigation, and licensing. This factor, in turn, has boosted the demand for legal documents in the region. Increasing awareness among customers and companies about document security is projected to fuel the growth of the security paper market during the forecast period.
Key Market Players
Giesecke+Devrient (Germany), De La Rue plc (UK), Fedrigoni Group (Italy), Security Printing and Minting Corporation of India Limited (India), Real Casa de la Moneda (Spain), Security Paper Limited (Pakistan), Goznak (Russia), China Banknote Printing and Minting Corporation (China), Drewsen Spezialpapiere GmbH & Co. KG (Germany), and Document Security Systems (US) are the key players operating in the security paper market.
Giesecke+Devrient, one of the leading players in the security paper market, which has a broad business portfolio and wide presence across the globe. This contributes toward its leading share in the security paper market. High revenue and adoption of strategic initiatives such as partnership, joint venture, contract, acquisition, and expansion have ensured its leading position in the market. For instance, Veridos, a subsidiary of Giesecke+Devrient, entered into a partnership with the Iraq Ministry of Interior with the aim to build a high-tech identity document factory in Baghdad, Iraq. The factory produces passports, electronic IDs, and security documents by providing over 100 local jobs. The company also focuses on adopting new technologies and machines, which help in increasing the plant capacity, thus adding to its revenue.
Recent Developments
- In September 2018, Real Casa de la Moneda and the National Factory of Currency offered two series of stamps dedicated to cinema. These stamps were put into circulation from October 2018.
- In May 2018, SPMCIL signed a growth-oriented MOU (Memorandum of Understanding) with the Department of Economic Affairs (DEA) and Ministry of Finance for the year 2018-19. This MOU was based on the principle of growth in a globally competitive market.
- In January 2018, Giesecke+Devrient won a contract of USD 308.3 million in Egypt. The Central Bank of Egypt commissioned Giesecke+Devrient with the planning and development of an integral plant for the production and processing of banknotes in Egypt.
Key Questions Addressed by the Report:
- What are the global trends in the security paper market? Would the market witness an increase or decline in the demand in the coming years?
- What is the estimated demand for different types of security paper products?
- Where will the strategic developments take the industry in the mid to long-term?
- What are the upcoming industry applications and trends for security paper?
- Who are the major players in the security paper market globally?
To speak to our analyst for a discussion on the above findings, click Speak to Analyst
 Exclusive indicates content/data unique to MarketsandMarkets and not available with any competitors.
Table of Contents
1 Introduction (Page No. - 16)
1.1 Objectives of the Study
1.2 Market Definition
1.3 Study Scope
1.3.1 Regional Scope
1.3.2 Periodization Considered for the Study
1.4 Currency Considered
1.5 Units Considered
1.6 Stakeholders
2 Research Methodology (Page No. - 21)
2.1 Research Data
2.1.1 Secondary Data
2.1.1.1 Key Data From Secondary Sources
2.1.2 Primary Data
2.1.2.1 Key Data From Primary Sources
2.1.2.2 Breakdown of Primaries
2.2 Market Size Estimation
2.3 Data Triangulation
2.4 Research Assumptions & Limitations
2.4.1 Assumptions
2.4.2 Limitations
3 Executive Summary (Page No. - 28)
3.1 Introduction
4 Premium Insights (Page No. - 32)
4.1 Attractive Opportunities in the Security Paper Market
4.2 Asia Pacific: Security Paper Market, By Application & Country
4.3 Security Paper Market, By Application
4.4 Security Paper Market, By Country
5 Market Overview (Page No. - 35)
5.1 Introduction
5.2 Market Dynamics
5.2.1 Drivers
5.2.1.1 Increase in Cases of Fraud and Counterfeiting
5.2.1.1.1 The Rise in Awareness Regarding Frauds Among Consumer Groups With the Support of Media:
5.2.1.2 Printing, Circulation, and Reprinting of Banknotes
5.2.1.3 Growth in Tourism to Increase the Demand for Visas and Passports
5.2.1.4 Reprinting of Legal Documents
5.2.2 Restraints
5.2.2.1 Growth in Digitization
5.2.3 Opportunities
5.2.3.1 Technological Advancements & Innovative Features
5.2.3.2 Demonetization of Currency Notes
5.2.4 Challenges
5.2.4.1 Stringent Government Regulations
6 Security Paper Market, By Component (Page No. - 42)
6.1 Introduction
6.2 Substrates
6.2.1 Substrates to Be the Largest Segment of the Security Printing Market
6.3 Watermarks
6.3.1 Watermarks to Be the Leading Security Feature in the Security Paper Market
6.4 Threads
6.4.1 The Increasing Need for Printing New Banknotes and Passports Drives the Demand for Security Threads
6.5 Holograms
6.5.1 Increasing Number of Forging and Duplication Cases to Drive the Demand for Holograms in the Security Paper Market
6.6 Others
6.6.1 The Others Segment is Projected to Record A Stagnant Growth Rate During the Forecast Period
7 Security Paper Market, By Application (Page No. - 47)
7.1 Introduction
7.2 Bank Notes
7.2.1 Banknotes to Lead the Demand for Security Papers
7.3 Passports
7.3.1 Growing Tourism is Expected to Boost the Demand for Security Papers the in Passports Segment
7.4 Identity Cards
7.4.1 Growing Concerns Toward National Security is Expected to Enhance Development of Highly-Secured Identity Cards
7.5 Certificates
7.5.1 Increasing Number of Students in Educational Institutions to Drive the Usage of Security Papers in the Certificates Segment
7.6 Legal & Government Documents
7.6.1 Increasing Counterfeiting Issues to Drive the Demand for Highly Secured Security Papers in Legal Documents
7.7 Cheques
7.7.1 Growing Trend Toward E-Payments is Expected to Hamper the Growth of Security Papers in the Cheques Segment
7.8 Stamps
7.8.1 Stamps to Grow at A Moderate Rate During the Forecast Period
7.9 Others
7.9.1 The Others Segment is Projected to Grow at A Stagnant Rate During the Forecast Period
8 Security Paper Market, By Region (Page No. - 54)
8.1 Introduction
8.2 Asia Pacific
8.2.1 China
8.2.1.1 China is the Largest Country-Level Market for the Security Paper Market in Asia Pacific
8.2.2 India
8.2.2.1 India is the Fastest-Growing Country-Level Market for Security Papers in Asia Pacific
8.2.3 Japan
8.2.3.1 The Growing Tourism Industry in Japan is Driving the Demand for Security Paper in Visas and Passports
8.2.4 Indonesia
8.2.4.1 Increasing Demand for Banknotes has Led to the Growing Need for Security Papers
8.2.5 Rest of Asia Pacific
8.2.5.1 Printing, Circulation, and Reprinting of Banknotes Along With the Growing Tourism Industry to Drive Security Paper Market in Rest of Asia Pacific
8.3 North America
8.3.1 US
8.3.1.1 The US is the Largest Country-Level Market for Security Paper in North America
8.3.2 Canada
8.3.2.1 Rise in the Number of Counterfeited Banknotes has Arisen the Need for High-Security Features
8.3.3 Mexico
8.3.3.1 Printing, Circulation, and Reprinting of Banknotes to Drive the Security Paper Market in Mexico
8.4 Europe
8.4.1 Germany
8.4.1.1 Germany to Be the Second-Largest Market in the European Security Paper Market
8.4.2 UK
8.4.2.1 Growth of Tourism to Drive the UK Security Paper Market
8.4.3 France
8.4.3.1 Increase in Frauds and Counterfeiting is Projected to Drive the Demand for Security Paper in France
8.4.4 Russia
8.4.4.1 Russia to Lead the Security Paper Market in Europe
8.4.5 Rest of Europe
8.4.5.1 Rise in Demand for Highly Secured Documents is Expected to Drive the Security Paper Market in Rest of Europe
8.5 Middle East & Africa
8.5.1 UAE
8.5.1.1 The UAE to Grow at the Highest CAGR in Middle East & Africa Security Paper Market
8.5.2 Saudi Arabia
8.5.2.1 Growing Tourism is Expected to Drive the Security Paper Market in Saudi Arabia
8.5.3 Turkey
8.5.3.1 Turkey to Lead the Security Paper Market in Middle East & Africa
8.5.4 South Africa
8.5.4.1 Increasing Cases of Frauds and Counterfeiting to Drive Security Paper Market in South Africa
8.5.5 Rest of Middle East & Africa
8.5.5.1 Rest of Middle East & Africa is Projected to Grow at A Stagnant Growth Rate
8.6 Latin America
8.6.1 Brazil
8.6.1.1 Brazil to Account for the Largest Market for Security Paper in Latin America
8.6.2 Argentina
8.6.2.1 Increasing Need to Print New Banknotes is Projected to Drive the Security Paper Market in Argentina
8.6.3 Chile
8.6.3.1 The Growth of the Tourism Sector to Drive the Security Paper Market in Chile
8.6.4 Rest of Latin America
8.6.4.1 Banknotes to Remain the Largest Application Area for the Security Paper Market in Rest of Latin America
9 Competitive Landscape (Page No. - 115)
9.1 Overview
9.2 Market Ranking
9.3 Competitive Scenario
9.3.1 New Product Launches/Developments
9.3.2 Partnerships, Agreements, and Joint Ventures
9.3.3 Contracts
9.3.4 Expansions, Investments, and Divestitures
9.3.5 Mergers & Acquisitions
10 Company Profiles (Page No. - 123)
(Business Overview, Products Offered, Recent Developments, SWOT Analysis, MnM View)*
10.1 Giesecke+Devrient
10.2 De La Rue PLC
10.3 Fedrigoni Group
10.4 Security Printing and Minting Corporation of India Limited (SPMCIL)
10.5 Real Casa De La Moneda (FNMT-RCM)
10.6 Security Paper Limited
10.7 Goznak
10.8 China Banknote Printing and Minting Corporation (CBPM)
10.9 Drewsen Spezialpapiere GmbH & Co. Kg
10.10 Document Security Systems
*Details on Business Overview, Products Offered, Recent Developments, SWOT Analysis, MnM View Might Not Be Captured in Case of Unlisted Companies.
10.11 Other Players
10.11.1 Simpson Security Papers
10.11.2 Ciotola SRL
10.11.3 Crane Co.
10.11.4 Pura Group
10.11.5 Shandong Hirun Paper Co., Ltd
10.11.6 EPL House
10.11.7 Security Paper Mill, Inc.
10.11.8 Dipa ZRT.
10.11.9 HG Technology SDN BHD
10.11.10 Gemini Graaphics Pvt. Ltd.
11 Appendix (Page No. - 150)
11.1 Discussion Guide
11.2 Knowledge Store: Marketsandmarkets’ Subscription Portal
11.3 Available Customizations
11.4 Related Reports
11.5 Author Details
List of Tables (102 Tables)
Table 1 USD Conversion Rates, 2014–2017
Table 2 Security Paper Market Size, By Component, 2016–2023 (USD Million)
Table 3 Security Paper Market Size, By Application, 2016–2023 (USD Million)
Table 4 Security Paper Market Size, By Application, 2016–2023 (Thousand Tons)
Table 5 Security Paper Market Size, By Region, 2016–2023 (USD Million)
Table 6 Security Paper Market Size, By Region, 2016–2023 (Thousand Tons)
Table 7 Asia Pacific: By Market Size, By Country, 2016–2023 (USD Million)
Table 8 Asia Pacific: By Market Size, By Country, 2016–2023 (Thousand Tons)
Table 9 Asia Pacific: By Market Size, By Component, 2016–2023 (USD Million)
Table 10 Asia Pacific: By Market Size, By Application, 2016–2023 (USD Million)
Table 11 Asia Pacific: By Market Size, By Application, 2016–2023 (Thousand Tons)
Table 12 China: By Market Size, By Component, 2016–2023 (USD Million)
Table 13 China: By Market Size, By Application, 2016–2023 (USD Million)
Table 14 China: By Market Size, By Application, 2016–2023 (Thousand Tons)
Table 15 India: By Market Size, By Component, 2016–2023 (USD Million)
Table 16 India: By Market Size, By Application, 2016–2023 (USD Million)
Table 17 India: By Market Size, By Application, 2016–2023 (Thousand Tons)
Table 18 Japan: By Market Size, By Component, 2016–2023 (USD Million)
Table 19 Japan: By Market Size, By Application, 2016–2023 (USD Million)
Table 20 Japan: By Market Size, By Application, 2016–2023 (Thousand Tons)
Table 21 Indonesia: By Market Size, By Component, 2016–2023 (USD Million)
Table 22 Indonesia: By Market Size, By Application, 2016–2023 (USD Million)
Table 23 Indonesia: By Market Size, By Application, 2016–2023 (Thousand Tons)
Table 24 Rest of Asia Pacific: By Market Size, By Component, 2016–2023 (USD Million)
Table 25 Rest of Asia Pacific: By Market Size, By Application, 2016–2023 (USD Million)
Table 26 Rest of Asia Pacific: By Market Size, By Application, 2016–2023 (Thousand Tons)
Table 27 North America: By Market Size, By Country, 2016–2023 (USD Million)
Table 28 North America: By Market Size, By Country, 2016–2023 (Thousand Tons)
Table 29 North America: By Market Size, By Component, 2016–2023 (USD Million)
Table 30 North America: By Market Size, By Application, 2016–2023 (USD Million)
Table 31 North America: By Market Size, By Application, 2016–2023 (Thousand Tons)
Table 32 US: By Market Size, By Component, 2016–2023 (USD Million)
Table 33 US: By Market Size, By Application, 2016–2023 (USD Million)
Table 34 US: By Market Size, By Application, 2016–2023 (Thousand Tons)
Table 35 Canada: By Market Size, By Component, 2016–2023 (USD Million)
Table 36 Canada: By Market Size, By Application, 2016–2023 (USD Million)
Table 37 Canada: By Market Size, By Application, 2016–2023 (Thousand Tons)
Table 38 Mexico: By Market Size, By Component, 2016–2023 (USD Million)
Table 39 Mexico: By Market Size, By Application, 2016–2023 (USD Million)
Table 40 Mexico: By Market Size, By Application, 2016–2023 (Thousand Tons)
Table 41 Europe: By Market Size, By Country, 2016–2023 (USD Million)
Table 42 Europe: By Market Size, By Country, 2016–2023 (Thousand Tons)
Table 43 Europe: By Market Size, By Component, 2016–2023 (USD Million)
Table 44 Europe: By Market Size, By Application, 2016–2023 (USD Million)
Table 45 Europe: By Market Size, By Application, 2016–2023 (Thousand Tons)
Table 46 Germany: By Market Size, By Component, 2016–2023 (USD Million)
Table 47 Germany: By Market Size, By Application, 2016–2023 (USD Million)
Table 48 Germany: By Market Size, By Application, 2014–2021 (Thousand Tons)
Table 49 UK: By Market Size, By Component, 2016–2023 (USD Million)
Table 50 UK: By Market Size, By Application, 2016–2023 (USD Million)
Table 51 UK: By Market Size, By Application, 2016–2023 (Thousand Tons)
Table 52 France: By Market Size, By Component, 2016–2023 (USD Million)
Table 53 France: By Market Size, By Application, 2016–2023 (USD Million)
Table 54 France: By Market Size, By Application, 2016–2023 (Thousand Tons)
Table 55 Russia: By Market Size, By Component, 2016–2023 (USD Million)
Table 56 Russia: By Market Size, By Application, 2016–2023 (USD Million)
Table 57 Russia: By Market Size, By Application, 2016–2023 (Thousand Tons)
Table 58 Rest of Europe: By Market Size, By Component, 2016–2023 (USD Million)
Table 59 Rest of Europe: By Market Size, By Application, 2016–2023 (USD Million)
Table 60 Rest of Europe: By Market Size, By Application, 2016–2023 (Thousand Tons)
Table 61 Middle East & Africa: By Market Size, By Country, 2016–2023 (USD Million)
Table 62 Middle East & Africa: By Market Size, By Country, 2016–2023 (Thousand Tons)
Table 63 Middle East & Africa: By Market Size, By Component, 2016–2023 (USD Million)
Table 64 Middle East & Africa: By Market Size, By Application, 2016–2023 (USD Million)
Table 65 Middle East & Africa: By Market Size, By Application, 2016–2023 (Thousand Tons)
Table 66 UAE: By Market Size, By Component, 2016–2023 (USD Million)
Table 67 UAE: By Market Size, By Application, 2016–2023 (USD Million)
Table 68 UAE: By Market Size, By Application, 2016–2023 (Thousand Tons)
Table 69 Saudi Arabia: By Market Size, By Component, 2016–2023 (USD Million)
Table 70 Saudi Arabia: By Market Size, By Application, 2016–2023 (USD Million)
Table 71 Saudi Arabia: By Market Size, By Application, 2016–2023 (Thousand Tons)
Table 72 Turkey: By Market Size, By Component, 2016–2023 (USD Million)
Table 73 Turkey: By Market Size, By Application, 2016–2023 (USD Million)
Table 74 Turkey: By Market Size, By Application, 2016–2023 (Thousand Tons)
Table 75 South Africa: By Market Size, By Component, 2016–2023 (USD Million)
Table 76 South Africa: By Market Size, By Application, 2016–2023 (USD Million)
Table 77 South Africa: By Market Size, By Application, 2016–2023 (Thousand Tons)
Table 78 Rest of Middle East & Africa: By Market Size, By Component, 2016–2023 (USD Million)
Table 79 Rest of Middle East & Africa: By Market Size, By Application, 2016–2023 (USD Million)
Table 80 Rest of Middle East & Africa: By Market Size, By Application, 2016–2023 (Thousand Tons)
Table 81 Latin America: By Market Size, By Country, 2016–2023 (USD Million)
Table 82 Latin America: By Market Size, By Country, 2016–2023 (Thousand Tons)
Table 83 Latin America: By Market Size, By Component, 2016–2023 (USD Million)
Table 84 Latin America: By Market Size, By Application, 2016–2023 (USD Million)
Table 85 Latin America: By Market Size, By Application, 2016–2023 (Thousand Tons)
Table 86 Brazil: By Market Size, By Component, 2016–2023 (USD Million)
Table 87 Brazil: By Market Size, By Application, 2016–2023 (USD Million)
Table 88 Brazil: By Market Size, By Application, 2016–2023 (Thousand Tons)
Table 89 Argentina: By Market Size, By Component, 2016–2023 (USD Million)
Table 90 Argentina: By Market Size, By Application, 2016–2023 (USD Million)
Table 91 Argentina: By Market Size, By Application, 2016–2023 (Thousand Tons)
Table 92 Chile: By Market Size, By Component, 2016–2023 (USD Million)
Table 93 Chile: By Market Size, By Application, 2016–2023 (USD Million)
Table 94 Chile: By Market Size, By Application, 2016–2023 (Thousand Tons)
Table 95 Rest of Latin America By Market Size, By Component, 2016–2023 (USD Million)
Table 96 Rest of Latin America: By Market Size, By Application, 2016–2023 (USD Million)
Table 97 Rest of Latin America: By Market Size, By Application, 2016–2023 (Thousand Tons)
Table 98 New Product Development
Table 99 Partnerships, Agreements, and Joint Ventures
Table 100 Contracts
Table 101 Expansions, Investments, and Divestitures
Table 102 Merger & Acquisitions
List of Figures (37 Figures)
Figure 1 Security Paper Market Segmentation
Figure 2 Security Paper Market, By Region
Figure 3 Security Paper Market: Research Design
Figure 4 Market Size Estimation Methodology: Bottom-Up Approach
Figure 5 Market Size Estimation Methodology: Top-Down Approach
Figure 6 Security Paper: Data Triangulation
Figure 7 The Substrates Segment is Estimated to Lead the Security Paper Market During the Forecast Period
Figure 8 The Banknotes Segment is Estimated to Lead the Security Paper Market in 2018
Figure 9 Asia Pacific Led the Security Paper Market in 2017
Figure 10 Substrates Led the Asia Pacific Security Paper Market in 2017
Figure 11 Printing, Reprinting, and Circulation of Banknotes is Expected to Drive Security Paper Market
Figure 12 China Was the Largest Market for Security Paper in Asia Pacific in 2017
Figure 13 Banknotes are Projected to Lead the Security Paper Market During the Forecast Period
Figure 14 The Security Paper Market in India is Projected to Grow at the Highest CAGR From 2018 to 2023
Figure 15 Security Paper Market Dynamics
Figure 16 Counterfeited Euro Banknotes Withdrawn From Circulation (2016-2017)
Figure 17 International Tourism - Number of Arrivals Across Regions (Million)
Figure 18 Security Paper Market, By Component, 2018 vs 2023 (USD Million)
Figure 19 Security Paper Market, By Application, 2018 vs 2023 (USD Million)
Figure 20 Geographic Snapshot (2018–2023): India is Projected to Register Highest Growth Rate, in Terms of Value
Figure 21 Asia Pacific Security Paper Market Snapshot
Figure 22 Asia Pacific Security Paper Market: Key Countries (2017)
Figure 23 North America: Security Paper Market Snapshot, 2017 (USD Million)
Figure 24 Companies Adopted Various Growth Strategies From, 2015 to 2018
Figure 25 Market Ranking of Key Players, 2017
Figure 26 Giesecke+Devrient: Company Snapshot
Figure 27 Giesecke+Devrient: SWOT Analysis
Figure 28 De La Rue PLC: Company Snapshot
Figure 29 De La Rue PLC: SWOT Analysis
Figure 30 Fedrigoni Group: Company Snapshot
Figure 31 Fedrigoni Group: SWOT Analysis
Figure 32 SPMCIL: Company Snapshot
Figure 33 SPMCIL: SWOT Analysis
Figure 34 Real Casa De La Moneda: Company Snapshot
Figure 35 Real Casa De La Moneda: SWOT Analysis
Figure 36 Security Paper Limited: Company Snapshot
Figure 37 Document Security Systems: Company Snapshot
The study involved four major activities for estimating the current global size of the security paper market. The exhaustive secondary research was carried out to collect information on the market, the peer market, and the parent market. The next step was to validate these findings, assumptions, and sizes with the industry experts across the value chain of security paper through primary research. Both, top-down and bottom-up approaches were employed to estimate the overall size of the security paper market. Thereafter, market breakdown and data triangulation procedures were used to estimate the size of different segments and subsegments of the market.
Secondary Research
In the secondary research process, various secondary sources such as Hoovers, Bloomberg BusinessWeek, and Dun & Bradstreet were referred to, so as to identify and collect information for this study on the security paper market. These secondary sources included annual reports, press releases & investor presentations of companies, white papers, certified publications, articles by recognized authors, gold & silver standard websites, food safety organizations, regulatory bodies, trade directories, and databases.
Primary Research
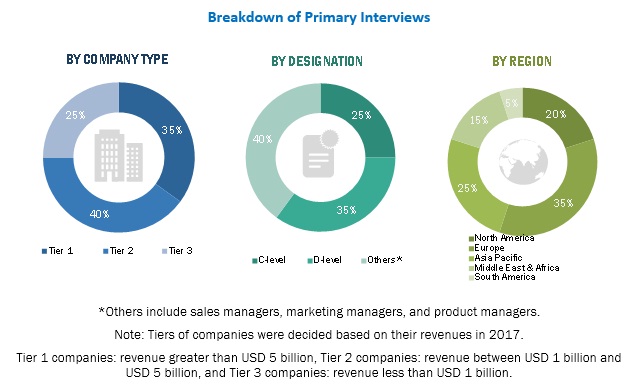
Various primary sources from both, the supply- and demand-side of the market were interviewed to obtain qualitative and quantitative information. The primary sources from the supply-side included industry experts such as Chief Executive Officers (CEOs), vice presidents, marketing directors, sales professionals, and related key executives from various leading companies and organizations operating in the security paper market. The primary sources from the demand-side included key executives from the banks, government organizations, and educational institutions. The breakdown of profiles of primary respondents is as follows:
To know about the assumptions considered for the study, download the pdf brochure
Market Size Estimation
Both, top-down and bottom-up approaches were used to estimate and validate the global size of the security paper market. These approaches were also used extensively to estimate the size of various dependent segments of the market. The research methodology used to estimate the market size included the following details:
- The key players were identified through extensive secondary research.
- The industry’s supply chain and market size, in terms of value, were determined through primary and secondary research processes.
- All percentage shares, splits, and breakdowns were determined using secondary sources and verified through primary sources.
Data Triangulation
After arriving at the overall market size from the estimation process explained above, the total market was split into several segments and subsegments. The data triangulation and market breakdown procedures were employed, wherever applicable to complete the overall market engineering process and arrive at the exact statistics for all segments and subsegments of the security paper market. The data was triangulated by studying various factors and trends from both, the demand- and supply-side.
Research Objectives
- To define, analyze, and project the size of the security paper market in terms of value and volume based on component, application, and region
- To project the size of the market and its segments in terms of value and volume, with respect to the five main regions, namely, North America, Europe, Asia Pacific, the Middle East & Africa, and Latin America
- To provide detailed information about the key factors such as drivers, restraints, opportunities, and challenges influencing the growth of the market
- To strategically analyze the micromarkets with respect to individual growth trends, future prospects, and their contribution to the total market
- To analyze the opportunities in the market for stakeholders and provide a detailed competitive landscape of the market leaders
- To analyze the competitive developments such as new product launches, expansions, investments, contracts, acquisitions, partnerships, agreements, and joint ventures in the security paper market
- To strategically profile the key players operating in the market and comprehensively analyze their market shares and core competencies
Scope of the Report
|
Report Metric |
Details |
|
Market size available for years |
2016–2023 |
|
Base year considered |
2017 |
|
Forecast period |
2018–2023 |
|
Forecast units |
Value (USD) and Volume (Thousand Tons) |
|
Segments covered |
Component, Application, and Region |
|
Geographies covered |
North America, Asia Pacific, Europe, Latin America, and the Middle East & Africa |
|
Companies covered |
Giesecke+Devrient (Germany), De La Rue plc (UK), Fedrigoni Group (Italy), Security Printing and Minting Corporation of India Limited (India), Real Casa de la Moneda (Spain), Security Paper Limited (Pakistan), Goznak (Russia), China Banknote Printing and Minting Corporation (China), Drewsen Spezialpapiere GmbH & Co. KG (Germany), and Document Security Systems (US) Total 20 market players covered in this report |
This research report categorizes the security paper market based on component, application, and region.
On the basis of component the security paper market has been categorized as follows:
- Substrates
- Watermarks
- Holograms
- Threads
- Others (include inks, taggants, and RFID chips)
On the basis of application the security paper market has been categorized as follows:
- Banknotes
- Legal & government documents
- Certificates
- Identity cards
- Passports
- Cheques
- Stamps
- Others (include prescription papers and ticketing)
On the basis of region, the security paper market has been categorized as follows:
- North America
- Europe
- Asia Pacific
- Middle East & Africa
- Latin America
Available Customizations
With the given market data, MarketsandMarkets offers customizations according to client-specific needs.
The following customization options are available for the security paper report:
Product Analysis
- Product matrix, which offers a detailed comparison of the product portfolio of companies
Regional Analysis
- Further analysis of the security paper market for additional countries
Company Information
- Detailed analysis and profiling of additional market players (up to 5)


Growth opportunities and latent adjacency in Security Paper Market
Interested in more details on Security paper market.
Interested in European Flexible Plastic Packaging market
Information in counterfeit protection market and anti-counterfeit packaging market
Security paper market by type and application
Looking for orders for security papers business expension
Security paper market report
Security paper market