Runtime Application Self-Protection Market by Solution (Web Applications, Mobile Applications, Others (Packaged Software, Embedded Software, Hosted Software)), Service, Deployment Mode, Organization Size, Vertical, and Region - Global Forecast to 2022


[132 Pages Report] The runtime application self protection market size is expected to grow from USD 249.5 Million in 2016 to USD 1,240.1 Million by 2022, at a Compound Annual Growth Rate (CAGR) of 33.3% during the forecast period. The base year for the study is 2016 and the forecast period is 2017 to 2022. The objective of the study is to define, describe, and forecast the market on the basis of solutions, services, deployment modes, organization sizes, verticals, and regions. It also analyzes recent developments, such as partnerships, strategic alliances, mergers and acquisitions, new product developments, and Research and Development (R&D) in the global market.
The research methodology used to estimate and forecast the runtime application self protection market begins with the collection and analysis of data on key vendor revenues through secondary sources, such as company websites, press releases, annual reports, TechTarget reports, Cloud Security Alliance reports, SC magazine, and SANS Institute studies. The vendor offerings have also been taken into consideration to determine the market segmentation. The bottom-up procedure was employed to arrive at the total market size of the global market from the revenues of the key players. After arriving at the overall market size, the total market was split into several segments and subsegments, which were then verified through primary research by conducting extensive interviews with key people, such as Chief Executive Officers (CEOs), Vice Presidents (VPs), directors, and executives. The data triangulation and market breakdown procedures were employed to complete the overall market engineering process and to arrive at the exact statistics for all the segments and subsegments. The breakdown of profiles of the primary is depicted in the figure below:
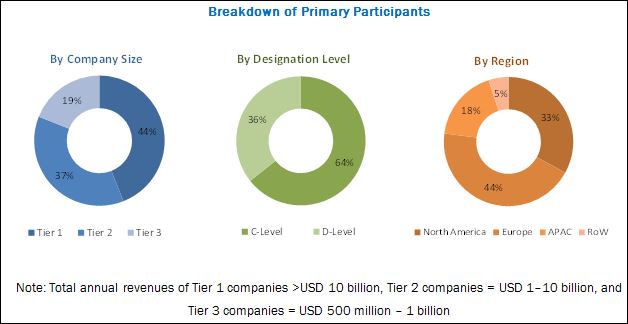
To know about the assumptions considered for the study, download the pdf brochure
The emergence of cloud computing and virtualization is expected to provide significant growth opportunities to the runtime application self protection solution vendors. The runtime application self protection market comprises key vendors, such as Arxan Technologies, Inc. (US), Contrast Security, Inc. (US), Micro Focus International plc (UK), Signal Sciences Corporation (US), VASCO Data Security International, Inc. (US), Veracode, Inc. (US), IMMUN.IO Inc. (Canada), Pradeo Security Systems (France), Prevoty, Inc. (US), and Waratek Ltd. (Ireland). The market also includes various key innovators such as Promon (Norway), RunSafe Security (US), and GuardSquare NV (Belgium). These vendors provide runtime application self protection solutions and services to end-users to cater to their unique business requirements, and compliance and security needs.
Key Target Audience
- Government agencies
- Runtime Application Self Protection vendors
- Independent software vendors
- Consulting firms
- System integrators
- Value-Added Resellers (VARs)
- Information Technology (IT) security agencies
- Managed Security Service Providers (MSSPs)
�Study answers several questions for the stakeholders, primarily which market segments to focus over the next 2�5 years for prioritizing the efforts and investments.�
Scope of the Report
The research report segments the runtime application self protection market into the following submarkets:
By Component:
- Solutions
- Services
By Solution:
- Web applications
- Mobile applications
- Others (packaged software, embedded software, and hosted software)
By Service:
- Professional services
- Managed services
By Deployment Mode:
- On-premises
- Cloud
By Organization Size:
- Small and Medium-sized Enterprises (SMEs)
- Large enterprises
By Vertical:
- Banking, Financial Services, and Insurance (BFSI)
- IT and telecommunications
- Government and defense
- Energy and utilities
- Manufacturing
- Healthcare
- Retail
- Others (media and entertainment, transport and logistics, and education)
By Region:
- North America
- Europe
- Asia Pacific (APAC)
- Middle East and Africa (MEA)
- Latin America
MarketsandMarkets expects the global runtime application self protection market size to grow from USD 294.7 Million in 2017 to USD 1,240.1 Million by 2022, at a Compound Annual Growth Rate (CAGR) of 33.3% during the forecast period. The constant pressure of managing sensitive applications and data of consumers, along with the need to manage stringent compliances, has led enterprises of all sizes to adopt runtime application self protection solutions for protecting critical business applications. Moreover, cloud-based deployment is gaining high traction in the market, as it requires less capital investment, helps decrease the operational and maintenance costs, and reduces the management�s efforts. Cloud runtime application self protection solutions are available according to customer�s demand, wherein a customer can start or stop any service, at will. Runtime application self protection solutions help organizations protect their sensitive applications and comply with stringent regulations.
Runtime application self protection solutions are available for web applications, mobile applications, and others (packaged software, embedded software, and hosted software). The runtime application self protection for web applications is expected to dominate the runtime application self protection market and is estimated to hold the largest market share in 2017. The runtime application self protection for mobile applications is expected to play a key role in changing the market landscape and is projected to grow at the highest CAGR during the forecast period, as global organizations are highly proactive toward protecting their sensitive business applications.
The cloud deployment mode is expected to grow at a faster rate in the runtime application self protection market, as it benefits organizations with increased scalability, speed, 24/7 services, and enhanced management capabilities. Small and Medium-sized Enterprises (SMEs) continue to opt for the cloud deployment mode, as it helps them avoid costs pertaining to hardware, software, storage, and technical staff.
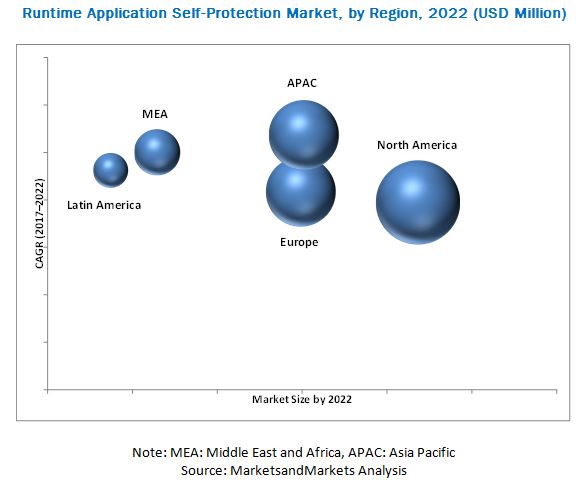
North America is estimated to hold the largest market size in 2017. Increasing penetration of internet and growth in the incidents of attacks on enterprise applications are driving the need of runtime application self protection solutions. Furthermore, rapid economic growth in the developing countries, along with improved regulatory reforms and economic stability is driving the runtime application self protection market growth in APAC. In Latin America, SMEs as well as large enterprises, belonging to a range of verticals, such as Banking, Financial Services, and Insurance (BFSI); government and defense; and IT and telecommunications, are expected to increase their investments in runtime application self protection solutions and services.
Limited budget in organizations to deploy cutting-edge security solutions is becoming a major restraint for the growth of the market. The Research and Development (R&D) expenses to develop advanced runtime application self protection solutions are very high, which lead to high pricing of the security solutions. As the frequency of security breaches has increased over the past 5 years, organizations have increased their IT security investments to protect against advanced threats. However, for many enterprises, including SMEs, these investment costs are a matter of concern. Furthermore, for strong and advanced security, the cost of innovation is still high, and many organizations view budgetary constraints as a barrier to growth in the runtime application self protection market.
Available Customizations
With the given market data, MarketsandMarkets offers customizations as per the company�s specific needs. The following customization options are available for the report:
Product Analysis
- Product matrix that gives a detailed comparison of product portfolio of each company
Geographic Analysis
- Further breakdown of the North American runtime application self protection market
- Further breakdown of the European market
- Further breakdown of the APAC market
- Further breakdown of the MEA market
- Further breakdown of the Latin American market
Company Information
- Detailed analysis and profiling of additional market players
To speak to our analyst for a discussion on the above findings, click Speak to Analyst
 Exclusive indicates content/data unique to MarketsandMarkets and not available with any competitors.
Table of Contents
1 Introduction (Page No. - 14)
1.1 Objectives of the Study
1.2 Market Definition
1.3 Market Scope
1.4 Years Considered for the Study
1.5 Currency
1.6 Stakeholders
2 Research Methodology (Page No. - 17)
2.1 Research Data
2.1.1 Secondary Data
2.1.2 Primary Data
2.1.2.1 Breakdown of Primary Interviews
2.2 Market Size Estimation
2.3 Research Assumptions
2.4 Limitations
3 Executive Summary (Page No. - 25)
4 Premium Insights (Page No. - 29)
4.1 Attractive Market Opportunities in the Runtime Application Self Protection Market
4.2 Market By Component, 2017 vs 2022
4.3 Market By Solution, 2017 vs 2022
4.4 Market By Professional Service, 2017 vs 2022
4.5 Market By Deployment Mode, 2017 vs 2022
4.6 Market By Organization Size, 2017 vs 2022
4.7 Market By Industry Vertical, 2017 vs 2022
4.8 Market By Region, 2017 vs 2022
5 Runtime Application Self Protection Market Overview (Page No. - 33)
5.1 Market Dynamics
5.1.1 Drivers
5.1.1.1 Growing Need to Protect Critical Applications and Data in Organizations
5.1.1.2 Non-Involvement of Security Professionals During Sdlc
5.1.1.3 Strict Regulatory Compliances to Protect the Sensitive Information
5.1.2 Restraints
5.1.2.1 Limited Security Budget
5.1.2.2 Each Application Can Be Protected Individually
5.1.3 Opportunities
5.1.3.1 Emergence of Cloud Computing and Virtualization
5.1.3.2 Growing Number of Mobile and Web Application Users Across the Globe
5.1.3.3 Integrating Runtime Application Self Protection With Other Security Technologies
5.1.4 Challenges
5.1.4.1 Lack of Technical Expertise Among the Enterprise Workforce for the Development of Advanced Runtime Application Self Protection Solutions
5.1.4.2 Lack of Awareness About Advanced Cyber Threats and Growing Security Concerns
5.2 Regulatory Landscape
5.2.1 International Organization for Standardization (ISO) 27001
5.2.2 European Union (EU) Model Clauses
5.2.3 Health Insurance Portability and Accountability Act (HIPAA)
5.2.4 Federal Information Security Management Act (FISMA)
5.2.5 Sarbanes�Oxley Act (SOX)
5.2.6 Gramm�Leach�Bliley Act (GLBA)
5.2.7 General Data Protection Regulation (GDPR)
5.2.8 Cloud Security Alliance (CSA) Security, Trust and Assurance Registry (STAR)
5.3 Innovation-Spotlight
6 Market, By Component (Page No. - 40)
6.1 Introduction
6.2 Solutions
6.3 Services
7 Market, By Solution (Page No. - 44)
7.1 Introduction
7.2 Web Applications
7.3 Mobile Applications
7.4 Others
8 Runtime Application Self Protection Market, By Service (Page No. - 49)
8.1 Introduction
8.2 Professional Services
8.2.1 Consulting
8.2.2 System Integration and Implementation
8.2.3 Training and Education
8.2.4 Support and Maintenance
8.3 Managed Services
9 Market, By Deployment Mode (Page No. - 56)
9.1 Introduction
9.2 On-Premises
9.3 Cloud
10 Market, By Organization Size (Page No. - 60)
10.1 Introduction
10.2 Small and Medium-Sized Enterprises
10.3 Large Enterprises
11 Runtime Application Self Protection Market, By Industry Vertical (Page No. - 64)
11.1 Introduction
11.2 Banking, Financial Services, and Insurance
11.3 IT and Telecommunications
11.4 Government and Defense
11.5 Energy and Utilities
11.6 Manufacturing
11.7 Healthcare
11.8 Retail
11.9 Others
12 Market, By Region (Page No. - 73)
12.1 Introduction
12.2 North America
12.3 Europe
12.4 Asia Pacific
12.5 Middle East and Africa
12.6 Latin America
13 Competitive Landscape (Page No. - 95)
13.1 Overview
13.2 Prominent Players Operating in the Runtime Application Self Protection Market
13.3 Competitive Scenario
13.3.1 Partnerships, Agreements, and Collaborations
13.3.2 New Product Launches
13.3.3 Mergers and Acquisitions
14 Company Profiles (Page No. - 100)
(Business Overview, Services Offered, Recent Developments, MnM View, Key Strategies, SWOT Analysis)*
14.1 Micro Focus
14.2 Veracode
14.3 Contrast Security
14.4 Vasco
14.5 Arxan
14.6 Immunio
14.7 Prevoty
14.8 Waratek
14.9 Pradeo
14.10 Signal Sciences
*Details on Business Overview, Services Offered, Recent Developments, MnM View, Key Strategies, SWOT Analysis Might Not Be Captured in Case of Unlisted Companies.
14.11 Key Innovators
14.11.1 Runsafe Security
14.11.2 Guardsquare
14.11.3 Promon
15 Appendix (Page No. - 122)
15.1 More Developments
15.1.1 Partnerships, Agreements, and Collaborations
15.1.2 New Product Launches
15.2 Discussion Guide
15.3 Knowledge Store: Marketsandmarkets� Subscription Portal
15.4 Introducing RT: Real Time Market Intelligence
15.5 Available Customizations
15.6 Related Reports
15.7 Author Details
List of Tables (71 Tables)
Table 1 Runtime Application Self Protection Market Size and Growth Rate, 2015�2022 (USD Million, Y-O-Y %)
Table 2 Innovation Spotlight: Latest Runtime Application Self Protection Innovations
Table 3 Market Size, By Component, 2015�2022 (USD Million)
Table 4 Solutions: Market Size, By Region, 2015�2022 (USD Million)
Table 5 Services: Market Size, By Region, 2015�2022 (USD Million)
Table 6 Market Size, By Solution, 2015�2022 (USD Million)
Table 7 Web Applications: Market Size, By Region, 2015�2022 (USD Million)
Table 8 Mobile Applications: Market Size, By Region, 2015�2022 (USD Million)
Table 9 Others: Market Size, By Region, 2015�2022 (USD Million)
Table 10 Runtime Application Self Protection Market Size, By Service, 2015�2022 (USD Million)
Table 11 Professional Services: Market Size By Region, 2015�2022 (USD Million)
Table 12 Professional Services: Market Size By Type, 2015�2022 (USD Million)
Table 13 Consulting: Market Size By Region, 2015�2022 (USD Million)
Table 14 System Integration and Implementation: Market Size, By Region, 2015�2022 (USD Million)
Table 15 Training and Education: Market Size By Region, 2015�2022 (USD Million)
Table 16 Support and Maintenance: Market Size By Region, 2015�2022 (USD Million)
Table 17 Managed Services: Market Size By Region, 2015�2022 (USD Million)
Table 18 Runtime Application Self Protection Market Size, By Deployment Mode, 2015�2022 (USD Million)
Table 19 On-Premises: Market Size By Region, 2015�2022 (USD Million)
Table 20 Cloud: Market Size By Region, 2015�2022 (USD Million)
Table 21 Market Size, By Organization Size, 2015�2022 (USD Million)
Table 22 Small and Medium-Sized Enterprises: Market Size By Region, 2015�2022 (USD Million)
Table 23 Large Enterprises: Market Size By Region, 2015�2022 (USD Million)
Table 24 Market Size, By Industry Vertical, 2015�2022 (USD Million)
Table 25 Banking, Financial Services, and Insurance: Market Size, By Region, 2015�2022 (USD Million)
Table 26 IT and Telecommunications: Market Size By Region, 2015�2022 (USD Million)
Table 27 Government and Defense: Market Size By Region, 2015�2022 (USD Million)
Table 28 Energy and Utilities: Market Size By Region, 2015�2022 (USD Million)
Table 29 Manufacturing: Market Size By Region, 2015�2022 (USD Million)
Table 30 Healthcare: Market Size By Region, 2015�2022 (USD Million)
Table 31 Retail: Market Size By Region, 2015�2022 (USD Million)
Table 32 Others: Market Size, By Region, 2015�2022 (USD Million)
Table 33 Runtime Application Self Protection Market Size, By Region, 2015�2022 (USD Million)
Table 34 North America: Market Size By Component, 2015�2022 (USD Million)
Table 35 North America: Market Size By Solution, 2015�2022 (USD Million)
Table 36 North America: Market Size By Service, 2015�2022 (USD Million)
Table 37 North America: Market Size By Professional Service, 2015�2022 (USD Million)
Table 38 North America: Market Size By Deployment Mode, 2015�2022 (USD Million)
Table 39 North America: Market Size By Organization Size, 2015�2022 (USD Million)
Table 40 North America: Market Size By Industry Vertical, 2015�2022 (USD Million)
Table 41 Europe: Market Size By Component, 2015�2022 (USD Million)
Table 42 Europe: Market Size By Solution, 2015�2022 (USD Million)
Table 43 Europe: Market Size By Service, 2015�2022 (USD Million)
Table 44 Europe: Market Size By Professional Service, 2015�2022 (USD Million)
Table 45 Europe: Market Size By Deployment Mode, 2015�2022 (USD Million)
Table 46 Europe: Market Size By Organization Size, 2015�2022 (USD Million)
Table 47 Europe: Market Size By Industry Vertical, 2015�2022 (USD Million)
Table 48 Asia Pacific: Runtime Application Self Protection Market Size, By Component, 2015�2022 (USD Million)
Table 49 Asia Pacific: Market Size By Solution, 2015�2022 (USD Million)
Table 50 Asia Pacific: Market Size By Service, 2015�2022 (USD Million)
Table 51 Asia Pacific: Market Size By Professional Service, 2015�2022 (USD Million)
Table 52 Asia Pacific: Market Size By Deployment Mode, 2015�2022 (USD Million)
Table 53 Asia Pacific: Market Size By Organization Size, 2015�2022 (USD Million)
Table 54 Asia Pacific: Market Size By Industry Vertical, 2015�2022 (USD Million)
Table 55 Middle East and Africa: Runtime Application Self Protection Market Size, By Component, 2015�2022 (USD Million)
Table 56 Middle East and Africa: Market Size By Solution, 2015�2022 (USD Million)
Table 57 Middle East and Africa: Market Size By Service, 2015�2022 (USD Million)
Table 58 Middle East and Africa: Market Size By Professional Service, 2015�2022 (USD Million)
Table 59 Middle East and Africa: Market Size By Deployment Mode, 2015�2022 (USD Million)
Table 60 Middle East and Africa: Market Size By Organization Size, 2015�2022 (USD Million)
Table 61 Middle East and Africa: Market Size By Industry Vertical, 2015�2022 (USD Million)
Table 62 Latin America: Market Size By Component, 2015�2022 (USD Million)
Table 63 Latin America: Market Size By Solution, 2015�2022 (USD Million)
Table 64 Latin America: Market Size By Service, 2015�2022 (USD Million)
Table 65 Latin America: Market Size By Professional Service, 2015�2022 (USD Million)
Table 66 Latin America: Market Size By Deployment Mode, 2015�2022 (USD Million)
Table 67 Latin America: Market Size By Organization Size, 2015�2022 (USD Million)
Table 68 Latin America: Runtime Application Self Protection Market Size, By Industry Vertical, 2015�2022 (USD Million)
Table 69 Partnerships, Agreements, and Collaborations, 2017
Table 70 New Product Launches, 2017
Table 71 Mergers and Acquisitions, 2015�2017
List of Figures (36 Figures)
Figure 1 Global Runtime Application Self Protection Market Segmentation
Figure 2 Global Market: Research Design
Figure 3 Data Triangulation
Figure 4 Market Size Estimation Methodology: Bottom-Up Approach
Figure 5 Market Size Estimation Methodology: Top-Down Approach
Figure 6 Market Assumptions
Figure 7 Market By Industry Vertical
Figure 8 Market By Region
Figure 9 Increasing Instances of Web Application-Targeted Attacks and Need for Compliance are Expected to Boost the Runtime Application Self Protection Market
Figure 10 Services Segment is Expected to Grow at A Higher CAGR During the Forecast Period
Figure 11 Mobile Applications Solution is Expected to Grow at the Highest CAGR During the Forecast Period
Figure 12 Consulting Segment is Expected to Grow at the Highest CAGR During the Forecast Period
Figure 13 Cloud Deployment Mode is Expected to Grow at A Higher CAGR During the Forecast Period
Figure 14 Small and Medium-Sized Enterprises Segment is Expected to Grow at A Higher CAGR During the Forecast Period
Figure 15 IT and Telecommunications Industry Vertical is Expected to Grow at the Highest CAGR During the Forecast Period
Figure 16 Asia Pacific is Expected to Grow at the Highest CAGR During the Forecast Period
Figure 17 Runtime Application Self Protection Market: Drivers, Restraints, Opportunities, and Challenges
Figure 18 Services Segment is Expected to Grow at A Higher CAGR During the Forecast Period
Figure 19 Mobile Applications Segment is Expected to Grow at the Highest CAGR During the Forecast Period
Figure 20 Managed Services Segment is Expected to Grow at A Higher CAGR During the Forecast Period
Figure 21 Cloud-Based Deployment Mode is Expected to Grow at A Higher CAGR During the Forecast Period
Figure 22 Small and Medium-Sized Enterprises Segment is Expected to Grow at A Higher CAGR During the Forecast Period
Figure 23 IT and Telecommunications Vertical is Expected to Grow at the Highest CAGR During the Forecast Period
Figure 24 Asia Pacific is Expected to Grow at the Highest CAGR During the Forecast Period
Figure 25 North America is the Emerging Region in the Runtime Application Self Protection Market
Figure 26 North America: Market Snapshot
Figure 27 Asia Pacific: Market Snapshot
Figure 28 Key Developments By Leading Players in the Market for 2015�2017
Figure 29 Market Evaluation Framework
Figure 30 Micro FocUS: Company Snapshot
Figure 31 Micro FocUS: SWOT Analysis
Figure 32 Veracode: SWOT Analysis
Figure 33 Contrast Security: SWOT Analysis
Figure 34 Vasco: Company Snapshot
Figure 35 Vasco: SWOT Analysis
Figure 36 Arxan: SWOT Analysis


Growth opportunities and latent adjacency in Runtime Application Self-Protection Market