Robotic Drilling Market by Application (Onshore and Offshore), Installation (New Builds and Retrofits), Components (Hardware and Software), and Region (North America, Asia Pacific, Europe, Middle East) - Global Forecast to 2023


[111 Pages Report] The global robotic drilling market was valued at USD 615.3 Million in 2017 and is expected to grow at a CAGR of 7.01% during the forecast period, to reach USD 923.2 Million by 2023. The market growth is mainly driven by the increased drilling activities due to the development of unconventional hydrocarbon resources and the adoption of automation and robotics in oil and gas drilling, which results in higher efficiency drilling and improved safety in rigs.
The years considered for the study are as follows:
- Base Year - 2017
- Estimated Year - 2018
- Projected Year - 2023
- Forecast Period - 2018 to 2023
The base year considered for company profiles is 2017. Whenever the information was unavailable for the base year, the prior year has been considered.
Objectives of the Study:
- To define, describe, segment, and forecast the global market segmented on the basis of application, component, installation, and region
- To provide detailed information about the major factors influencing the growth of the market (drivers, restraints, opportunities, and industry-specific challenges)
- To strategically analyze the market with respect to individual growth trends, prospects, and contribution of each segment to the market
- To analyze market opportunities for stakeholders and details of a competitive landscape for market leaders
- To analyze competitive developments such as contracts and agreements, expansions, new product launches and developments, and mergers and acquisitions in the market
- To benchmark players in the market using the proprietary competitive leadership mapping, which analyzes market players on various parameters within the broad categories of business and product strategies
- To strategically profile the key players and comprehensively analyze their market share and core competencies
Research Methodology
This research study involved the use of extensive secondary sources, directories, and databases, such as Hoover�s, Bloomberg Businessweek, Factiva, and OneSource, to identify and collect the information that is useful for a technical, market-oriented, and commercial study of the global market. Primary sources are mainly industry experts from the core and related industries, service providers, technology developers, standards and certification organizations of companies, and organizations operating in the ecosystem of the market. The following points have been taken into consideration while studying the market.
- Study of the annual revenue generated by major players, along with developments made by them in robotic drilling systems
- Assessment of future trends and factors influencing the growth of the market
- Assessment of the market with respect to the demand from each type of reservoir and application
- Analysis of market trends in various regions or countries by studying the new exploration blocks, contracts, and rig data
- Study of market-related contracts and developments made by the key players across different regions
- Finalization of the overall market size by triangulating the supply-side data, which includes product launches and developments and annual revenue of each company providing robotic drilling systems across the world
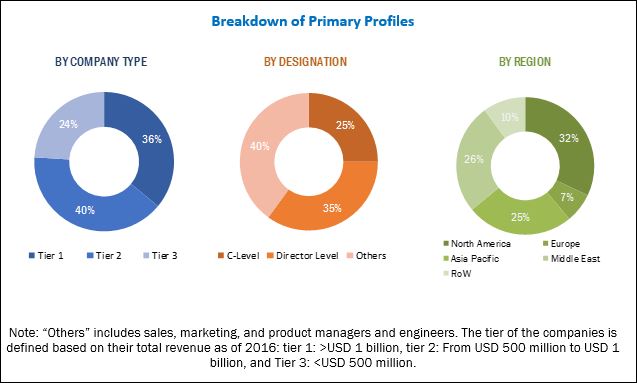
After arriving at the overall market size, the total market has been split into several segments and subsegments. The figure mentioned below illustrates the breakdown of primaries conducted during the research study.
To know about the assumptions considered for the study, download the pdf brochure
Market Ecosystem:
The ecosystem of the robotic drilling market comprises equipment manufacturers/suppliers such as Nabors (US), National Oilwell Varco (US), Precision Drilling (Canada), Huisman (Netherlands), and Weatherford (Switzerland). It also comprises exploration and production companies including Shell (Netherlands), Chevron (US), ExxonMobil (US), British Petroleum (UK), Saudi Aramco (Saudi Arabia), Petrobras (Brazil), and Petronas (Malaysia).
Target Audience:
The target audience of this report includes:
- Drilling equipment manufacturers and suppliers
- Exploration and production companies
- National and international drilling associations
- Oilfield services providers
Scope of the Report:
- By Application
- Onshore
- Offshore
- By Installation
- Retrofit
- New Builds
- By Component
- Hardware
- Software
- By Region
- North America
- Asia Pacific
- Europe
- Middle East
- Rest of the World
Available Customizations:
With the given market data, MarketsandMarkets offers customizations according to the client�s specific needs. The following customization options are available for this report:
Regional Analysis:
Further breakdown of the region or country-specific analysis
Company Information:
Detailed analysis and profiling of additional market players (up to 5)
The global robotic drilling market is estimated to grow at a CAGR of 7.01% from 2018 to 2023, to reach at an estimated market size of USD 923.2 Million by 2023 from USD 658.0 Million in 2018 The increased drilling activities due to the development of unconventional hydrocarbon resources and the adoption of automation and robotics in oil and gas drilling, which results in higher efficiency drilling and improved safety in rigs are the major factors driving the market growth.
In the report, the market based on application has been segmented into onshore and offshore. The onshore application accounted for a larger market share in 2017 as the installation of drill floor automation in onshore rigs is less complex compared to offshore rigs. Moreover, offshore drilling requires higher capital investments, and offshore rigs operate in dynamic and harsh environments.
The robotic drilling based on installation has been segmented into new builds and retrofit. The retrofit segment is expected to account for a larger market share due to the increasing need to improve safety and efficiency of the existing rigs, coupled with the increased focus on low human intervention during drilling.
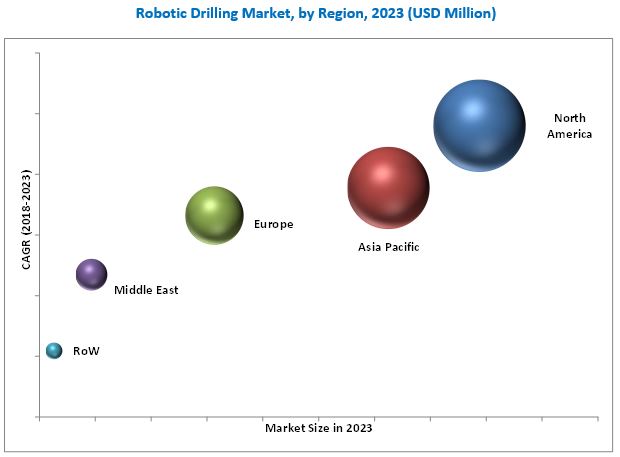
In this report, the market has been analyzed with respect to 5 regions, namely, North America, Europe, Asia Pacific, Middle East, and Rest of the World. North America is expected to dominate the global market during the forecast period due to the rise in the shale gas production and the higher safety and efficiency norms provided by drilling contractors. North America is also expected to be the fastest-growing market, followed by Asia Pacific.
The major factors restraining the growth of the market are the lack of interoperability of rig control systems used in robotic drilling and issues related to cybersecurity for automated systems.
Some of the leading players in the robotic drilling market include Nabors (US), Precision Drilling (Canada), Weatherford (Switzerland), Huisman (the Netherlands), and National Oilwell Varco (US). Contracts and new product launches were the most common strategies adopted by top players, followed by mergers and collaborations.
To speak to our analyst for a discussion on the above findings, click Speak to Analyst
 Exclusive indicates content/data unique to MarketsandMarkets and not available with any competitors.
Table of Contents
1 Introduction (Page No. - 13)
1.1 Objectives of the Study
1.2 Market Definition
1.3 Market Scope
1.3.1 Markets Covered
1.3.2 Regional Scope
1.3.3 Years Considered for the Study
1.4 Currency
1.5 Stakeholders
2 Research Methodology (Page No. - 16)
2.1 Research Data
2.1.1 Secondary Data
2.1.1.1 Key Secondary Sources
2.1.2 Primary Data
2.1.2.1 Key Data From Primary Sources
2.1.2.2 Key Industry Insights
2.1.2.3 Breakdown of Primaries
2.2 Market Size Estimation
2.2.1 Bottom-Up Approach
2.2.2 Top-Down Approach
2.3 Market Breakdown & Data Triangulation
2.4 Research Limitations
2.5 Research Assumptions
3 Executive Summary (Page No. - 24)
4 Premium Insights (Page No. - 27)
4.1 Attractive Opportunities in the Robotic Drilling Market During the Forecast Period
4.2 Market, By Application
4.3 Market, By Components
4.4 Market, By Installation
4.5 North American Robotic Drilling, By Application
5 Market Overview (Page No. - 30)
5.1 Introduction
5.1.1 Drivers
5.1.1.1 Increased Adoption of Automation in Oil & Gas Industry
5.1.1.2 Improved Operational Efficiency and Less Human Intervention
5.1.2 Restraints
5.1.2.1 Interoperability of Rig Control Systems
5.1.3 Opportunities
5.1.3.1 Improving Safety in Rigs
5.1.3.2 Increased Exploration Actives in Ultra-Deepwater and Arctic Region
5.1.4 Challenges
5.1.4.1 Increasing Data Privacy & Cybersecurity Risk
6 Robotic Drilling, By Application (Page No. - 35)
6.1 Introduction
6.2 Onshore
6.3 Offshore
7 Robotic Drilling, By Components (Page No. - 39)
7.1 Introduction
7.2 Hardware
7.3 Software
8 Robotic Drilling, By Installation (Page No. - 43)
8.1 Introduction
8.2 New Builds
8.3 Retrofits
9 Robotic Drilling Market, By Region (Page No. - 47)
9.1 Introduction
9.2 North America
9.2.1 US
9.2.2 Canada
9.3 Europe
9.3.1 Russia
9.3.2 UK
9.3.3 Norway
9.3.4 Rest of Europe
9.4 Asia Pacific
9.4.1 China
9.4.2 Malaysia
9.4.3 Australia
9.4.4 Rest of Asia Pacific
9.5 Middle East
9.5.1.1 Saudi Arabia
9.5.1.2 UAE
9.5.1.3 Oman
9.5.1.4 Rest of Middle East
9.6 Rest of the World
9.6.1.1 Brazil
9.6.1.2 Mexico
9.6.1.3 Rest of RoW
10 Competitive Landscape (Page No. - 78)
10.1 Introduction
10.2 Market Shares of Leading Players & Market Structure
10.3 Competitive Scenario
10.3.1 New Product Launches
10.3.2 Mergers & Acquisitions
10.3.3 Investments & Expansions
10.3.4 Contracts & Agreements/ Joint Ventures/Partnerships & Collaborations
11 Company Profile (Page No. - 82)
11.1 Benchmarking
(Business Overview, Products/Services Offered, Recent Developments, MnM View)*
11.2 National Oilwell Varco
11.3 Weatherford International
11.4 Nabors � Rds
11.5 Ensign Energy Services
11.6 Huisman
11.7 Drillmec
11.8 Precision Drilling
11.9 Sekal
11.10 Abraj Energy
11.11 Drillform Technical
11.12 Automated Rig Technologies
11.13 Rigarm
*Details on Business Overview, Products/Services Offered, Recent Developments, MnM View Might Not Be Captured in Case of Unlisted Companies.
12 Appendix (Page No. - 103)
12.1 Insights of Industry Experts
12.2 Discussion Guide
12.3 Knowledge Store: Marketsandmarkets� Subscription Portal
12.4 Introducing RT: Real-Time Market Intelligence
12.5 Available Customizations
12.6 Related Reports
12.7 Author Details
List of Tables (68 Tables)
Table 1 Robotic Drilling Market Snapshot
Table 2 Market, By Application, 2016�2023 (USD Million)
Table 3 Onshore Application: Market Size, By Region, 2016�2023 (USD Million)
Table 4 Offshore Application: Market Size, By Region, 2016�2023 (USD Million)
Table 5 Market, By Components, 2016�2023 (USD Million)
Table 6 Hardware: Market Size, By Region, 2016�2023 (USD Million)
Table 7 Software: Market Size, By Region, 2016�2023 (USD Million)
Table 8 Market, By Installation, 2016�2023 (USD Million)
Table 9 Ratio of New Builds to Active Rigs in US (2014-2016)
Table 10 Market Size, By Region, 2016�2023 (USD Million)
Table 11 Market Size, By Country (Top 5), 2016�2023 (USD Million)
Table 12 Fastest Growing Market Size, By Country (Top 5), 2016�2023 (USD Million)
Table 13 Fastest Growing Hardware Market Size, By Components (Top 5), 2016�2023 (USD Million)
Table 14 North America: Market Size, By Application, 2016�2023 (USD Million)
Table 15 North America: Market Size, By Components, 2016�2023 (USD Million)
Table 16 North America: Market Size, By Country, 2016�2023 (USD Million)
Table 17 US: Market Size, By Application, 2016�2023 (USD Million)
Table 18 US: Market Size, By Components, 2016�2023 (USD Million)
Table 19 Canada: Market Size, By Application, 2016�2023 (USD Million)
Table 20 Canada: Market Size, By Components, 2016�2023 (USD Million)
Table 21 Europe: Market Size, By Application, 2016�2023 (USD Million)
Table 22 Europe: Market Size, By Components, 2016�2023 (USD Million)
Table 23 Europe: Market Size, By Country, 2016�2023 (USD Million)
Table 24 Russia: Market Size, By Application, 2016�2023 (USD Million)
Table 25 Russia: Market Size, By Components, 2016�2023 (USD Million)
Table 26 UK: Market Size, By Application, 2016�2023 (USD Million)
Table 27 UK: Market Size, By Components, 2016�2023 (USD Million)
Table 28 Norway: Market Size, By Application, 2016�2023 (USD Million)
Table 29 Norway: Market Size, By Components, 2016�2023 (USD Million)
Table 30 Rest of Europe: Market Size, By Application, 2016�2023 (USD Millions)
Table 31 Rest of Europe: Market Size, By Components, 2016�2023 (USD Millions)
Table 32 Asia Pacific: Market Size, By Application, 2016�2023 (USD Million)
Table 33 Asia Pacific: Market Size, By Components, 2016�2023 (USD Million)
Table 34 Asia Pacific: Market Size, By Country, 2016�2023 (USD Million)
Table 35 China: Market Size, By Application, 2016�2023 (USD Million)
Table 36 China: Market Size, By Components, 2016�2023 (USD Million)
Table 37 Malaysia: Market Size, By Application, 2016�2023 (USD Million)
Table 38 Malaysia: Market Size, By Components, 2016�2023 (USD Million)
Table 39 Australia: Market Size, By Application, 2016�2023 (USD Million)
Table 40 Australia: Market Size, By Components, 2016�2023 (USD Million)
Table 41 Rest of Asia Pacific: Market Size, By Application, 2016�2023 (USD Million)
Table 42 Rest of Asia Pacific: Market Size, By Components, 2016�2023 (USD Million)
Table 43 Middle East: Market Size, By Application, 2016�2023 (USD Million)
Table 44 Middle East: Market Size, By Components, 2016�2023 (USD Million)
Table 45 Middle East: Market Size, By Country, 2016�2023 (USD Million)
Table 46 Saudi Arabia: Market Size, By Application, 2016�2023 (USD Million)
Table 47 Saudi Arabia: Market Size, By Components, 2016�2023 (USD Million)
Table 48 UAE: Market Size, By Components, 2016�2023 (USD Million)
Table 49 UAE: Market Size, By Application, 2016�2023 (USD Million)
Table 50 Oman: Market Size, By Application, 2016�2023 (USD Million)
Table 51 Oman: Market Size, By Components, 2016�2023 (USD Million)
Table 52 Rest of Middle East: Market Size, By Application, 2016�2023 (USD Million)
Table 53 Rest of Middle East: Market Size, By Components, 2016�2023 (USD Million)
Table 54 Rest of the World: Market Size, By Application, 2016�2023 (USD Million)
Table 55 Rest of the World: Market Size, By Components, 2016�2023 (USD Million)
Table 56 Rest of the World: Market Size, By Country, 2016�2023 (USD Million)
Table 57 Brazil: Market Size, By Application, 2016�2023 (USD Million)
Table 58 Brazil: Market Size, By Components, 2016�2023 (USD Million)
Table 59 Mexico: Market Size, By Application, 2016�2023 (USD Million)
Table 60 Mexico: Market Size, By Components, 2016�2023 (USD Million)
Table 61 Rest of RoW: Market Size, By Application, 2016�2023 (USD Million)
Table 62 Rest of RoW: Market Size, By Components, 2016�2023 (USD Million)
Table 63 Nabors Led the Market in 2017
Table 64 Market Developments, 2014�2018
Table 65 New Product Launches, 2014�2018
Table 66 Mergers & Acquisitions, 2014�2018
Table 67 Investments & Expansions, 2014�2018
Table 68 Contracts & Agreements/ Joint Ventures/Partnerships & Collaborations, 2014�2018
List of Figures (30 Figures)
Figure 1 Robotic Drillings Market: Research Design
Figure 2 Bottom-Up Approach
Figure 3 Top-Down Approach
Figure 4 Data Triangulation Methodology
Figure 5 Assumptions of the Research Study
Figure 6 Robotic Drilling, By Region (Value), 2018
Figure 7 Market, By Application, 2018�2023 (USD Billion)
Figure 8 Market, By Region, 2018�2023 (USD Billion)
Figure 9 Growing Adoption of Automation in Drilling Activities Drives the Market, 2018�2023
Figure 10 Onshore Segment is Leading the Robotic Drilling Industry 2018�2023
Figure 11 Hardware Segment Led the Market in 2017
Figure 12 Retrofit Segment is Expected to Lead the Robotic Drilling During Forecasted Period
Figure 13 US Led the North American Market in 2017
Figure 14 Robotic Drilling Industry: Drivers, Restraints, Opportunities, & Challenges
Figure 15 West Texas Intermediate (WTI) Crude Oil Price, 2013�2017
Figure 16 World Crude Oil Annual Production vs Consumption, 2011�2016
Figure 17 The Onshore Segment is Expected to Have the Largest Market Share During the Forecast Period
Figure 18 The Hardware Segment is Expected to Have the Largest Market Share During the Forecast Period
Figure 19 The Retrofit Segment is Expected to Have the Largest Market Share During the Forecast Period
Figure 20 Regional Snapshot (2017): North America Led the Robotic Drilling Industry
Figure 21 North America: the Fastest Growing Market, 2018�2023
Figure 22 North America: Market Overview
Figure 23 Asia Pacific: Drilling Market Overview
Figure 24 Saudi Arabia Accounts for the Major Share in the Middle East Robotic Drilling, 2017
Figure 25 Key Developments in the Robotic Drilling, 2014�2018
Figure 26 National Oilwell Varco, Inc.: Company Snapshot
Figure 27 Weatherford International: Company Snapshot
Figure 28 Nabors �RDS: Company Snapshot
Figure 29 Ensign Energy Services: Company Snapshot
Figure 30 Precision Drilling: Company Snapshot


Growth opportunities and latent adjacency in Robotic Drilling Market