Production Chemicals Market by Type (Demulsifiers, Corrosion Inhibitors, Scale Inhibitors, Asphaltene Inhibitors, Biocides, Scavengers, Surfactants, and others), by Oilfield Type (Onshore and Offshore), and Region - Global Trend & Forecast to 2020


Production chemicals are used for enhancing the recovery of hydrocarbons from the well. Various categories of production chemicals include corrosion inhibitors, scale inhibitors, asphaltene inhibitors, biocides, demulsifies, scavengers, surfactants, and others. These chemicals are added in production to achieve the optimum performance and enhance the effectiveness of the oil recovery.
Recent boom in the shale oil and gas industry in North America is driving the demand for production chemicals. The factors driving growth in the production chemicals market are increasing production of crude oil, growing drilling activities, and pursuing production from ageing fields. The market is projected to witness huge growth due to enormous potential offered by these drivers. Many of the oil and gas companies are headquartered in this region which boosts the oil and gas industry of North America and the neighboring Latin American region.
The manufacturers of production chemicals mainly focus on mergers and acquisitions to expand their product portfolio for various applications as well as deepen their market reach. The pending acquisition of Baker Hughes by Halliburton is a major example of an acquisition in this market. The acquisition of Nalco Holdings (U.K.) and Champion Technologies (U.K.) by Ecolab (U.K.) was another significant example in this market. Expansion was also a preferred strategy of the companies. Expansion into growing markets such as Asia-Pacific, Brazil, and the Middle East has been and will be the key success for production chemicals producers if they intend to increase their overall sales and revenue.
The report covers the global production chemicals market in major regions namely North America, Europe, the Middle East and Africa, Asia-Pacific, and Latin America. This report analyzes different marketing trends and establishes the most effective growth strategy in the market. It identifies market dynamics such as drivers, restraints, opportunities, and winning imperatives. Major companies such as Akzonobel NV (The Netherlands), BASF SE (Germany), Croda PLC (U.S.), DuPont (U.S.), Baker Hughes (U.S.), Halliburton, and Schlumberger Limited (U.S.) are profiled.
Global production chemicals market is estimated at $ 4,452.0 Million in 2014 and projected to reach a market size of $ 6,173.5 Million in 2020, registering a CAGR of 5% to 6% during the same period.
Production chemicals are used in the oilfield operations mainly to improve production maintenance & transport and eventually the recovery from reserves. Increasing oil production, extraction of oils from technologically challenging hydrocarbon geologies, and necessity of better extraction are boosting interest in the market.
This market is driven by increasing production of crude oil, growing drilling activities, and pursuing development and production from established/ageing Fields. The demand for production chemicals is increasing in enhanced oil recovery application as EOR activities are rising globally to enhance crude oil production from mature or declining reserves. The Asia-Pacific region is estimated to be the fastest-growing region as increasing number of oilfields are being explored and turned over in this region. Countries such as China, Malaysia, Thailand, and Indonesia are registering a high growth in the region.
The Middle Eastern and African region dominated the production chemicals market in 2014, globally. The U.S., Saudi Arabia, Iran, and Russia are the major countries with a huge demand for production chemicals. Latin America is projected to witness the highest growth rate of 6.9% between 2015 and 2020 for the market.
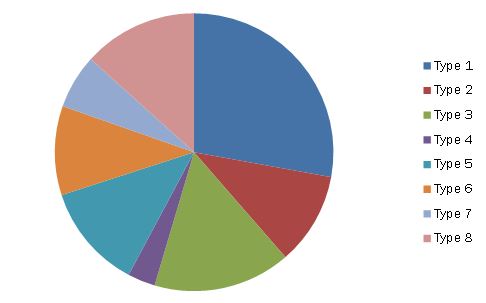
Production Chemicals Market, by Type, 2014
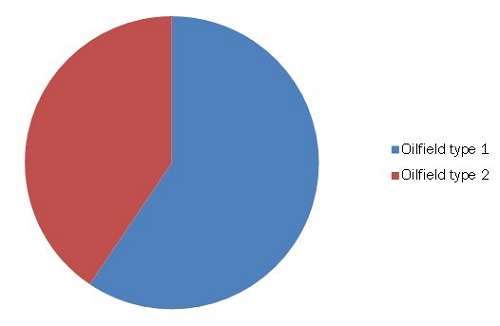
Production Chemicals Market, by Type of Oilfield, 2014
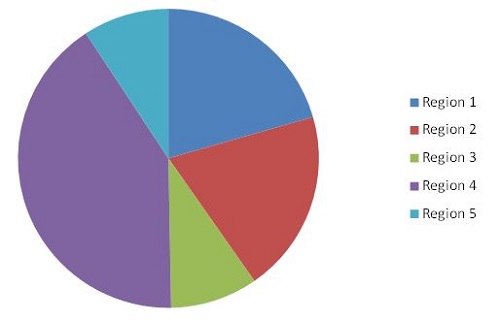
Production Chemicals Market, by Region, 2014
Source: Secondary Research, Expert Interviews, and MarketsandMarkets Analysis
 Exclusive indicates content/data unique to MarketsandMarkets and not available with any competitors.
Table of Contents
1 Introduction (Page No. - 14)
1.1 Objectives of the Study
1.2 Market Definition
1.3 Market Scope
1.3.1 Markets Covered
1.3.2 Years Considered in the Report
1.4 Currency and Pricing
1.5 Package Size
1.6 Limitation
1.7 Stakeholders
2 Research Methodology (Page No. - 17)
2.1 Research Data
2.1.1 Secondary Data
2.1.1.1 Key Data From Secondary Sources
2.1.2 Primary Data
2.1.2.1 Key Data From Primary Sources
2.1.2.2 Key Industry Insights
2.1.2.3 Breakdown of Primaries
2.2 Market Size Estimation
2.2.1 Bottom-Up Approach
2.2.2 Top-Down Approach
2.3 Market Breakdown & Data Triangulation
2.4 Research Assumptions
2.4.1 Assumptions
3 Executive Summary (Page No. - 25)
4 Premium Insights (Page No. - 28)
4.1 Attractive Market Opportunity for Production Chemicals
4.2 Middle East & Africa Anticipated to Dominate the Market
4.3 Asia-Pacific and Latin America: Lucrative Markets for Production Chemicals Players
4.4 Life Cycle Analysis, By Region
4.5 Demulsifier Market Share, By Region
5 Market Overview (Page No. - 33)
5.1 Introduction
5.2 Market Segmentation
5.2.1 Production Chemicals Market, By Type
5.2.2 Production Chemicals Market, By Oilfield Type
5.2.3 Production Chemicals Market, By Region
5.3 Market Dynamics
5.3.1 Drivers
5.3.1.1 Increasing Crude Oil Production
5.3.1.2 Pursuing Development and Production From Established/Aging Fields Adding to the Production Chemicals Market
5.3.2 Restraints
5.3.2.1 Political Issues in Some of the Major Oil Producing Countries of the Middle East
5.3.2.2 Falling Crude Oil Prices Prompting Companies to Lower Production
5.3.3 Opportunities
5.3.3.1 Increase in Offshore Production Activities Anticipated to Boost the Market
5.3.3.2 Forward Integration of Manufacturers Into Service Providers
5.3.4 Challenges
5.3.4.1 Stringent Environmental Legislations
6 Industry Trends (Page No. - 42)
6.1 Introduction
6.2 Value Chain Analysis
6.3 Raw Material Suppliers
6.4 Production Chemicals Manufacturers
6.4.1 Base Fluids Manufacturer
6.4.2 Additives Manufacturers
6.4.3 Vertically Integrated Production Chemicals Manufacturers
6.5 End-Users
6.6 Porter�s Five Forces Analysis
6.6.1 Bargaining Power of Buyers
6.6.2 Bargaining Power of Suppliers
6.6.3 Threat From New Entrants
6.6.4 Threat From Substitutes
6.6.5 Degree of Competition
7 Global Production Chemicals Market, By Type (Page No. - 48)
7.1 Introduction
7.2 Demulsifiers
7.3 Scale Inhibitors
7.4 Corrosion Inhibitors
7.5 Asphaltene Inhibitors
7.6 Biocides
7.7 Scavengers
7.8 Surfactants
7.9 Others
8 Global Production Chemicals Market, By Oilfield Type (Page No. - 64)
8.1 Introduction
8.2 Onshore
8.3 Offshore
9 Global Production Chemicals Market Size, By Region (Page No. - 70)
9.1 Introduction
9.2 North America
9.2.1 U.S.
9.2.2 Canada
9.2.3 Mexico
9.3 Europe
9.3.1 Russia
9.3.2 Norway
9.3.3 U.K.
9.3.4 Rest of Europe
9.4 Asia-Pacific
9.4.1 China
9.4.2 Indonesia
9.4.3 Malaysia
9.4.4 India
9.4.5 Rest of Asia-Pacific
9.5 Middle East & Africa
9.5.1 Saudi Arabia
9.5.2 Iran
9.5.3 United Arab Emirates (U.A.E)
9.5.4 Nigeria
9.5.5 Other
9.6 Latin America
9.6.1 Brazil
9.6.2 Venezuela
9.6.3 Colombia
9.6.4 Other
10 Competitive Landscape (Page No. - 103)
10.1 Overview
10.2 Mergers & Acquisitions: the Most Popular Growth Strategies
10.3 Maximum Developments in 2014
10.4 Competitive Situation & Trends
10.4.1 Mergers & Acquisitions
10.4.2 New Product Launch
10.4.3 Expansion
10.4.4 Partnerships, Agreements, and Collaborations
11 Company Profiles (Page No. - 109)
(Overview, Financial*, Products & Services, Strategy, and Developments)
11.1 Introduction
11.2 BASF SE
11.3 Clariant AG
11.4 Halliburton Company
11.5 Ecolab Inc.
11.6 Schlumberger Limited
11.7 Akzonobel N.V.
11.8 Baker Hughes Incorporated
11.9 Croda International PLC
11.10 The DOW Chemical Company
*Details Might Not Be Captured in Case of Unlisted Companies
12 Appendix (Page No. - 138)
12.1 Insights of Industry Experts
12.2 Discussion Guide
12.3 Introducing RT: Real Time Market Intelligence
12.4 Available Customizations
12.5 Related Reports
List of Tables (89 Tables)
Table 1 Impact of Global Production Chemicals Market Drivers (2015�2020)
Table 2 Impact of Global Production Chemicals Market Restraints (2015-2020)
Table 3 Global Production Chemicals Market Size, By Type, 2013-2020
Table 4 Global Demulsifiers Market Size ($Million), 2013�2020
Table 5 Scale Inhibitors Used in Oilfield Production
Table 6 Scale Inhibitors Market Size ($Million), 2013�2020
Table 7 Corrosion Inhibitors Used in Oilfields
Table 8 Corossion Inhibitors Market Size ($Million), 2013�2020
Table 9 Asphaltene Inhibitors Market Size ($Million), 2013�2020
Table 10 Biocides Market Size ($Million), 2013�2020
Table 11 Scavengers Market Size ($Million), 2013�2020
Table 12 Surfactants Used in Oil & Gas Production
Table 13 Surfactants Market Size ($Million), 2013�2020
Table 14 Other Production Chemicals Market Size ($Million), 2013-2020
Table 15 Onshore Wells Drilled, By Region (Million Feet)
Table 16 Onshore Production Chemicals Market Size, By Region, 2013�2020 ($Million)
Table 17 Offshore Wells Produced, By Region (Million Feet)
Table 18 Offshore Production Chemicals Market Size, By Region, 2013�2020 ($Million)
Table 19 Production Chemicals Market Size, By Region, 2013-2020 ($Million)
Table 20 North America: Production Chemicals Market Size, By Country, 2013-2020 ($Million)
Table 21 North America: Production Chemicals Market Size , By Type, 2013-2020 ($Million)
Table 22 North America: Production Chemicals Market Size, By Oilfield Type, 2013-2020 ($Million)
Table 23 U.S.: Production Chemicals Market Size, By Type, 2013-2020 ($Million)
Table 24 U.S.: Production Chemicals Market Size, By Type of Oilfield, 2013-2020 ($Million)
Table 25 Canada: Production Chemicals Market Size, By Type, 2013-2020 ($Million)
Table 26 Canada: Production Chemicals Market Size, By Type of Oilfield, 2013-2020 ($Million)
Table 27 Mexico: Production Chemicals Market Size, By Type, 2013-2020 ($Million)
Table 28 Mexico Production Chemicals Market Size, By Type of Oilfield, 2013-2020 ($Million)
Table 29 Europe: Production Chemicals Market Size, By Country, 2013-2020 ($Million)
Table 30 Europe: Production Chemicals Market Size , By Type, 2013-2020 ($Million)
Table 31 Europe: Production Chemicals Market Size, By Type of Oilfield, 2013-2020 ($Million)
Table 32 Russia: Production Chemicals Market Size, By Type, 2013-2020 ($Million)
Table 33 Russia: Production Chemicals Market Size, By Type of Oilfield, 2013-2020 ($Million)
Table 34 Norway: Production Chemicals Market Size, By Type, 2013-2020 ($Million)
Table 35 Norway: Production Chemicals Market Size, By Type of Oilfield, 2013-2020 ($Million)
Table 36 U.K.: Production Chemicals Market Size, By Type, 2013-2020 ($Million)
Table 37 U.K.: Production Chemicals Market Size, By Type of Oilfield, 2013-2020 ($Million)
Table 38 Rest of Europe: Production Chemicals Market Size, By Type, 2013-2020 ($Million)
Table 39 Rest of Europe: Production Chemicals Market Size, By Type of Oilfield, 2013-2020 ($Million)
Table 40 Asia-Pacific: Production Chemicals Market Size, By Country, 2013�2020 ($Million)
Table 41 Asia-Pacific: Production Chemicals Market Size , By Type, 2013-2020 ($Million)
Table 42 Asia-Pacific: Production Chemicals Market Size, By Type of Oilfield, 2013-2020 ($Million)
Table 43 China: Production Chemicals Market Size, By Type, 2013-2020 ($Million)
Table 44 China: Production Chemicals Market Size, By Type of Oilfield, 2013-2020 ($Million)
Table 45 Indonesia: Production Chemicals Market Size, By Type, 2013-2020 ($Million)
Table 46 Indonesia: Production Chemicals Market Size, By Type of Oilfield, 2013-2020 ($Million)
Table 47 Malaysia: Production Chemicals Market Size, By Type, 2013-2020 ($Million)
Table 48 Malaysia: Production Chemicals Market Size, By Type of Oilfield, 2013-2020 ($Million)
Table 49 India: Production Chemicals Market Size, By Type, 2013-2020 ($Million)
Table 50 India: Production Chemicals Market Size, By Type of Oilfield, 2013-2020 ($Million)
Table 51 Rest of Asia-Pacific: Production Chemicals Market Size, By Type, 2013-2020 ($Million)
Table 52 Rest of Asia-Pacific: Production Chemicals Market Size, By Type of Oilfield, 2013-2020 ($Million)
Table 53 Middle East & Africa: Production Chemicals Market Size, By Country, 2012�2019 ($Million)
Table 54 Middle East & Africa: Production Chemicals Market Size , By Type, 2013-2020 ($Million)
Table 55 Middle East & Africa: Production Chemicals Market Size, By Type of Oilfield, 2013-2020 ($Million)
Table 56 Saudi Arabia: Production Chemicals Market Size, By Type, 2013-2020 ($Million)
Table 57 Saudi Arabia: Production Chemicals Market Size, By Type of Oilfield, 2013-2020 ($Million)
Table 58 Iran: Production Chemicals Market Size, By Type, 2013-2020 ($Million)
Table 59 Iran: Production Chemicals Market Size, By Type of Oilfield, 2013-2020 ($Million)
Table 60 UAE: Production Chemicals Market Size, By Type, 2013-2020 ($Million)
Table 61 UAE: Production Chemicals Market Size, By Type of Oilfield, 2013-2020 ($Million)
Table 62 Nigeria: Production Chemicals Market Size, By Type, 2013-2020 ($Million)
Table 63 Nigeria: Production Chemicals Market Size, By Type of Oilfield, 2013-2020 ($Million)
Table 64 Others: Production Chemicals Market Size, By Type, 2013-2020 ($Million)
Table 65 Others: Production Chemicals Market Size, By Type of Oilfield, 2013-2020 ($Million)
Table 66 Latin America: Production Chemicals Market Size, By Country, 2013�2020 ($Million)
Table 67 Middle East & Africa: Production Chemicals Market Size , By Type, 2013-2020 ($Million)
Table 68 Latin America: Production Chemicals Market Size, By Type of Oilfield, 2013-2020 ($Million)
Table 69 Brazil: Production Chemicals Market Size, By Type, 2013-2020 ($Million)
Table 70 Brazil: Production Chemicals Market Size, By Type of Oilfield, 2013-2020 ($Million)
Table 71 Venezuela: Production Chemicals Market Size, By Type, 2013-2020 ($Million)
Table 72 Venezuela: Production Chemicals Market Size, By Type of Oilfield, 2013-2020 ($Million)
Table 73 Colombia: Production Chemicals Market Size, By Type, 2013-2020 ($Million)
Table 74 Colombia: Production Chemicals Market Size, By Type of Oilfield, 2013-2020 ($Million)
Table 75 Others: Production Chemicals Market Size, By Type, 2013-2020 ($Million)
Table 76 Others: Production Chemicals Market Size, By Type of Oilfield, 2013-2020 ($Million)
Table 77 Mergers & Acquisitions, 2010-2014
Table 78 New Product Launch, 2010-2014
Table 79 Expansion, 2010-2014
Table 80 Partnerships, Agreements & Collaborations 2010-2014
Table 81 BASF SE: Products Offered
Table 82 Clariant AG: Products Offered
Table 83 Halliburton: Products Offered
Table 84 Schlumberger Limited: Products Offered
Table 85 Akzonobel: Products Offered
Table 86 Baker Hughes Inc: Products Offered
Table 87 Croda International PLC: Products Offered
Table 88 The DOW Chemical Company: Products & Their Function
Table 89 Ecolab Inc.: Products Offered
List of Figures (46 Figures)
Figure 1 Production Chemical Market Research Design
Figure 2 Break Down of Primary Interviews: By Company Type, Designation, & Region
Figure 3 Market Size Estimation Methodology: Bottom-Up Approach
Figure 4 Market Size Estimation Methodology: Top-Down Approach
Figure 5 Data Triangulation: Production Chemicals Market
Figure 6 Middle East and Africa Led the Production Chemicals Market in 2014, By Value
Figure 7 Production Chemicals, By Type (2015 vs 2020): Scavengers to Grow at the Fastest Rate
Figure 8 Increasing Crude Oil Production Driving Growth for the Production Chemicals Market
Figure 9 The Middle East Commands High Growth Being the Largest Crude Oil Producer Across the Globe
Figure 10 Middle East is the Leading Consumer of Production Chemicals for Offshore Oilfields
Figure 11 Production Chemicals Market Segmentation, By Type of Oilfield
Figure 12 Production Chemicals Market, By Region
Figure 13 Increasing Crude Oil Production Will Drive the Production Chemicals Market
Figure 14 Value Chain: Producton Chemicals Manufacturers & Distributors Act as A Bridge
Figure 15 Porter�s Five Forces Analysis
Figure 16 Various Types of Production Chemicals
Figure 17 The Middle East & Africa Expected to Dominate the Market for Demulsifiers
Figure 18 The Middle East & Africa Market is the Largest Market for Scale Inhibitors (2015-2020)
Figure 19 Europe is the Second-Largest Market in Terms of Market Size for Corrosion Inhibitors (2015-2020)
Figure 20 Europe is the Second-Largest Market for Asphaltene Inhibitors (2015-2020)
Figure 21 The MEA Region is the Largest Market for Biocides, (2015-2020)
Figure 22 The Middle East & Africa is the Largest Market for Scavengers (2015-2020)
Figure 23 Europe is the Second-Largest Market for Surfactants Production Chemicals (2015)
Figure 24 North America is the Second-Largest Market for Other Production Chemicals (2015)
Figure 25 Onshore Oilfield Dominates the Production Chemicals Market (2015-2020)
Figure 26 The Middle East & Africa Expected to Dominate the Market for Production Chemicals in Onshore Oilfields
Figure 27 Europe to Dominate the Market for Production Chemicals in Offshore Production (2015-2020)
Figure 28 Regional Snapshot � Rapid Growth Markets are Emerging as New Hotspots
Figure 29 North American Market Snapshot: Increase in Consumption of Production Chemicals, 2015-2020
Figure 30 Companies Adopted Mergers & Acquisitions as Key Growth Strategies From 2011-2014
Figure 31 Developments in Global Production Chemical Market, 2010�2014
Figure 32 Regional Revenue Mix of Top 5 Companies
Figure 33 BASF SE: Company Snapshot
Figure 34 BASF SE: SWOT Analysis
Figure 35 Clariant AG: Company Snapshot
Figure 36 Clariant AG: SWOT Analysis
Figure 37 Halliburton Company: Company Snapshot
Figure 38 Halliburton: SWOT Analysis
Figure 39 Ecolab Inc.: Company Snapshot
Figure 40 Ecolab Inc.: SWOT Analysis
Figure 41 Schlumberger Limited: Company Snapshot
Figure 42 Schlumberger Limited: SWOT Analysis
Figure 43 Akzonobel N.V.: Company Snapshot
Figure 44 Baker Hughes Incorporated: Company Snapshot
Figure 45 Croda International PLC: Company Snapshot
Figure 46 The DOW Chemical Company: Company Snapshot


Growth opportunities and latent adjacency in Production Chemicals Market