Portable Generator Market: Growth, Size, Share, and Trends

Portable Generator Market by Application (Emergency, Prime/Continuous), Fuel (Gasoline, Diesel, Natural Gas, Others), Power Rating (Below 5 kW, 5 – 10 kW, 10 – 20 kW), Product type, End user and Region - Global Forecast to 2027

Report Code: EP 5879 Jan, 2023, by marketsandmarkets.com

The global portable generator market size was valued at $2.2 billion in 2022 and to reach $2.9 billion by 2027, growing at a compound annual growth rate (CAGR) of 6.0% from 2022 to 2027.

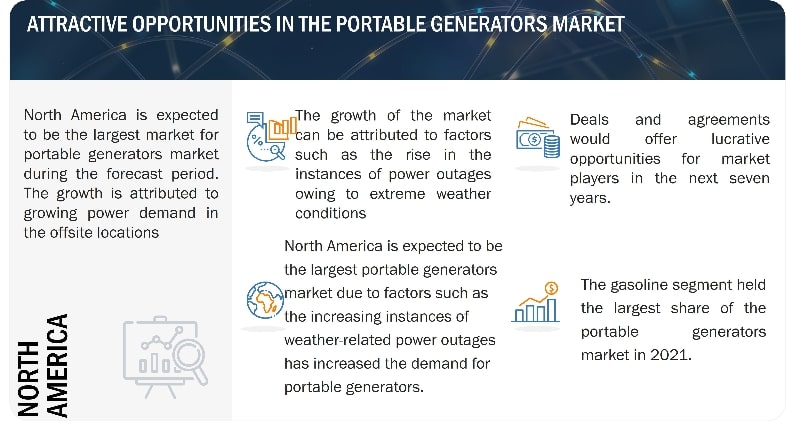
Severe weather conditions like heavy rains, heat waves, storms, hurricanes, and fog disrupt regular supply of electricity, thereby creating demand for backup power supply for different sectors. Portable generators find their applications for camping, tailgating as well as Recreational Vehicles. Long runtime and efficient fuel capacity are some of the features that have increased the demand for portable generators.
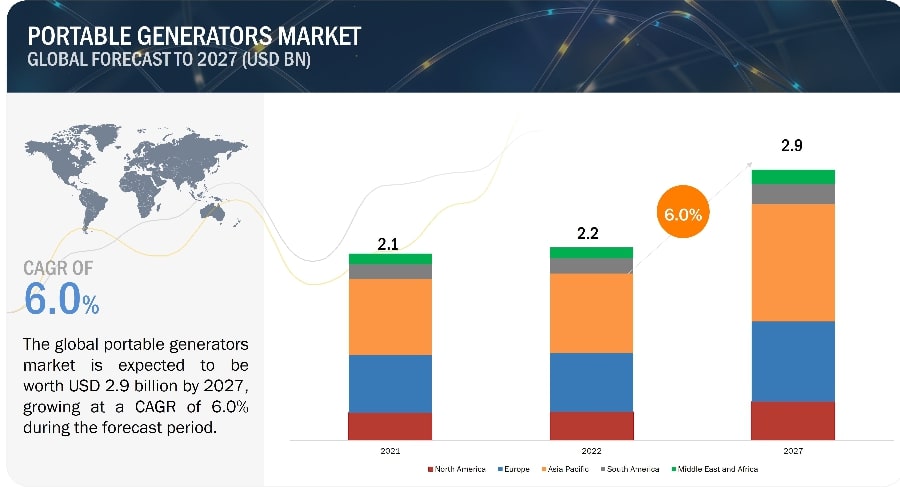
Portable Generator Market

To know about the assumptions considered for the study, Request for Free Sample Report
Packaging Films Market

Portable Generator Market Dynamics

Driver: Rise in the instances of power outages owing to extreme weather conditions

Electricity transmission and distribution is the backbone for the power infrastructure in the country. Transmission systems that are not properly upgraded cannot sustain additional power burden and, in some cases, can also lead to the failure of the system, causing power outage. Transmission and distribution networks in developed countries were laid out quite a while ago, and even with regular maintenance, after a certain age, the infrastructure is bound to weaken. According to the National Association of Regulatory Utility Commissioners US, coal, gas, and nuclear power plants can work efficiently for a span of approximately 40 years. The life span of these power generation sources is reaching the end of their life cycle due to which countries such as the US, the UK, and Germany have been focusing on replacing their aging power generation, transmission, and distribution infrastructure to reduce the power outages.

The extreme weather conditions are also likely to drive demand for portable generators. The electrical infrastructure in the US is prone to unpredictable and frequent power failures. Thus, increasing investments in backup power solutions, apart from growing awareness among consumers toward emergency preparedness, will favor market growth. According to the Department of Energy (DoE) and the North American Electric Reliability Corp. (NERC), a system capable of handling sudden power shots and drops can help in uninterrupted power. The US endures more blackouts than any other developed country as the duration of US power outages lasts more than an hour, and the number has increased steadily over the past few years. These blackouts cost American businesses about USD 150 billion per year.

Restraint: Stringent government regulations pertaining to emissions on generators

Portable generators are used in residential, commercial, and industrial applications. When diesel is burnt in generator, it emits oxides of nitrogen, carbon monoxide, and particulate matter. These emissions are directly released into the atmosphere, and they deteriorate the environment as well as inhabitants. Several regulations have been implemented worldwide to reduce air and noise pollution by generator sets. Consumer Product Safety Commission (CPSC) is a key step toward regulating gas-powered generators, which emit as much as carbon monoxide. Countries focussing on reducing the emissions from the types of fuels used in portable generators. For instance, California has laid down a regulation to ban portable generators in the state. 

Opportunities: Technological advancements such as dual fuels and inverter portable generators

In general, the hybrid generators are internal combustion engines coupled with batteries, which are offered by many OEMs. When the load is high, these hybrid gensets directly power the engine; when the load is low, the battery powers the engine. They have a number of advantages over traditional gensets, including a reduction in running time, fuel consumption, and noise. They are also likely to penetrate the market for mobile gensets, which are primarily employed in residential settings and building sites.

The reliability for the dual fuel generator improves for the standby power applications by combining favorable aspects of both gas and diesel generators. The portable generators which can operate on either gas or diesel are able to run completely on diesel during an emergency. Dual fuel technology has now been used by a number of generator manufacturers for solving different problems appearing in diesel engines.

Challenges: Increasing adoption of renewable energy technologies and energy storage solutions

Over the past several years, the energy storage business has experienced exponential growth. The primary drivers of the energy storage market are the increasing focus on lowering greenhouse gases and the stringent emission reduction targets. These limitations also limit the expansion of the market for portable generators. Prices for solar and batteries have been falling each year and are anticipated to fall even further during the projection period. More people are drawn to renewable energy options because they want to control and lower their electricity bills. In residential applications, battery energy storage systems are utilized to power residential structures. Thus, the rise of fuel-based power generation machinery, such as portable generators, is being constrained by the rising usage of energy storage technology.

Market Trends
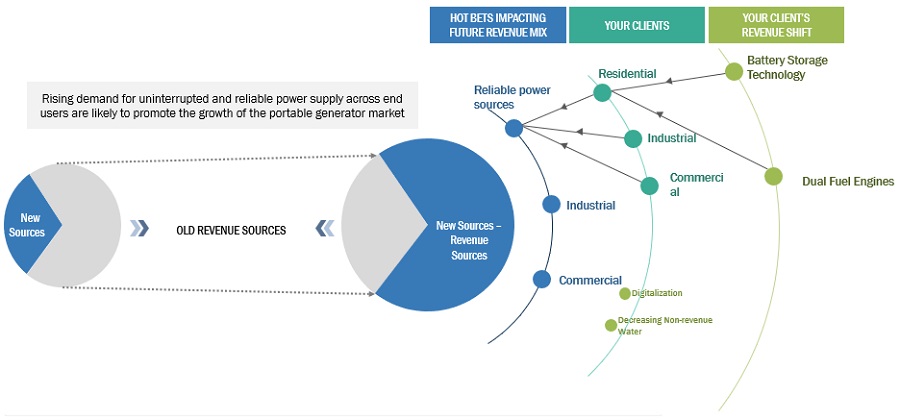
Portable Generator Market

To know about the assumptions considered for the study, download the pdf brochure

5 – 10 kW segment, by power rating, is expected to be the largest market during the forecast period

The 5–10 kW portable generators are used for powering appliances used in households so, majorly used in applications such as residential and camping activities. The rise in the camping activities which require backup portable generators is pushing the demand for this segment. The major camping activities are seen in North American countries such as US, Canada, and Mexico which is boosting the market. The portable generators market is dominated by a few major market players that have a wide regional presence. The key players in the portable generators market are Honda (Japan), Generac (US), Yamaha (Japan), Cummins (US), Atlas Copco (Sweden). In  the last few years, the companies have adopted growth strategies such as sales contracts to capture a larger share of the portable generators market. The increase in camping activities, especially in North America-United States, Canada, and Mexico-has driven the portable generators market development considerably. Accompanied by outdoor adventure tourism, the growth of demand in these countries is for 5–10 kW generators for dependable power supplies in unattended sites. This is further mired with the rise in the number of people going for RV camping, to which these generators generally operate to provide power to the electrical systems of the vehicle and other camping equipment. Major players dominate the market for portable generators with considerable regional presence.

By fuel, the natural gas is expected to be the fastest growing market for the global portable generator market during the forecast period

By fuel , the portable generators market has been segmented into gasoline, diesel, natural gas, and others. Portable generators that run on natural gas are more affordable, easier to use, and better for the environment because natural gas is said to be the eco-friendly fuel. Additionally, noise pollution is reduced by portable generators that run on natural gas. Tanks make it simple to store natural gas for longer periods of time and use it as needed. Such portable generators are increasingly in demand in the worldwide portable generator market because they are utilized frequently during blackouts and in places vulnerable to natural disasters.

“North America: The second fastest portable generator market”

North America is expected to be the second fastest-growing region for the global portable generators market between 2022–2027. Increasing instances of power shortages in countries such as the US and Canada are likely to boost the demand for portable generators. North America is one of the leading manufacturers and consumer of electricity. Due to the massive industrial sector of North America in the countries such as US and Canada has increased the power demand.  Environmental distress, power shortages, investments on the natural gas networks, and peak time electricity costs are expected to help the portable generator market grow in this region. The region has witnessed increasing frequency and intensity of various weather conditions, including hurricanes, wildfires, and winter storms. All such events are ascribable to longer power outages, which drive the residential generator market and commercial sectors to invest in portable generators for backup power.
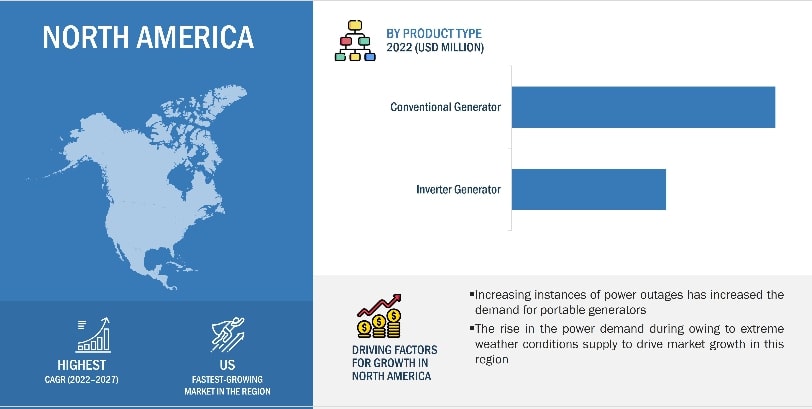
Portable Generator Market Size, and Share

Key Market Players

The portable generators market is dominated by a few major market players that have a wide regional presence. The key players in the portable generators market are Honda (Japan), Generac (US), Yamaha (Japan), Cummins (US), Atlas Copco (Sweden). In  the last few years, the companies have adopted growth strategies such as sales contracts to capture a larger share of the portable generators market. The portable generators market is dominated by a few major players that have a wide regional presence.

Want to explore hidden markets that can drive new revenue in Portable Generator Market?

Scope of the Report

Report Metrics

Details

Market size available for years 2020–2027
Base year considered 2021
Forecast period 2022–2027
Forecast units Value (USD)
Segments covered Fuel, Power rating, application, end user, product type and Region
Geographies covered Asia Pacific, North America, Europe, Middle East & Africa, and South America
Companies covered Honda (Japan), Generac (US), Yamaha (Japan), Cummins (US), Atlas Copco (Sweden), Briggs and Stratton (US), Generac (US), Yamaha, Caterpillar Inc. (US), Honeywell International Inc. (US), Siemens (Germany), Waucker Neuson (Germany), Rato Europe (Italy), Kohler (US), Champion Power Equipment (US), Inmesol (Spain), Himoonsa (Spain), Duromax (California), Loncin (China), Wen portable generators (US), Pulsar products (US)

This research report categorizes the portable generator market by fuel, applications, product type, power rating, end user, and region

Based on fuel:
  • Gasoline
  • Diesel
  • Natural Gas
  • Others
Based on application:
  • Emergency
  • Prime/ Continuous
Based on product type:
  • Inverter generator
  • Conevntional generator
Based on power rating:
  • Below 5kW
  • 5 – 10 kW
  • 10 – 20 KW
Based on end user:
  • Residential
  • Commercial
  • Industrial
Based on region:
  • Asia Pacific
  • Europe
  • North America
  • Middle East & Africa
  • South America

Recent Developments

  • In January 2021, Yamaha has updated its full line of inverter and conventional generators with Carbon Monoxide (CO) Sensor.
  • In October 2021, Generac launched its new products series Guardian 26kW generator provides 26 kilowatts of peak power, while taking up less space and offering thousands of dollars of savings on purchase and installation compared to competitive home standby generators.
  • In September 2019, Honda has launched, Honda My Generator Bluetooth App which allows end users to start (electric start models only), stop, and monitor critical functions of Honda portable generators through a Bluetooth interface on a smartphone.

Frequently Asked Questions (FAQ):

To speak to our analyst for a discussion on the above findings, click Speak to Analyst

Exclusive indicates content/data unique to MarketsandMarkets and not available with any competitors.

TABLE OF CONTENTS
 
1 INTRODUCTION (Page No. - 27)
    1.1 STUDY OBJECTIVES 
    1.2 MARKET DEFINITION 
    1.3 INCLUSIONS AND EXCLUSIONS 
           1.3.1 PORTABLE GENERATOR MARKET, BY PRODUCT TYPE: INCLUSIONS AND EXCLUSIONS
           1.3.2 MARKET, BY APPLICATION: INCLUSIONS AND EXCLUSIONS
           1.3.3 MARKET, BY FUEL: INCLUSIONS AND EXCLUSIONS
           1.3.4 MARKET, BY POWER RATING: INCLUSIONS AND EXCLUSIONS
           1.3.5 MARKET, BY END USER: INCLUSIONS AND EXCLUSIONS
    1.4 MARKET SCOPE 
           1.4.1 MARKET SEGMENTATION
           1.4.2 REGIONAL SCOPE
    1.5 YEARS CONSIDERED 
    1.6 CURRENCY CONSIDERED 
    1.7 LIMITATIONS 
    1.8 STAKEHOLDERS 
    1.9 SUMMARY OF CHANGES 
 
2 RESEARCH METHODOLOGY (Page No. - 32)
    2.1 RESEARCH DATA 
           FIGURE 1 PORTABLE GENERATOR MARKET: RESEARCH DESIGN
    2.2 MARKET BREAKDOWN AND DATA TRIANGULATION 
           FIGURE 2 DATA TRIANGULATION
           2.2.1 SECONDARY DATA
                    2.2.1.1 Key data from secondary sources
           2.2.2 PRIMARY DATA
                    2.2.2.1 Key data from primary sources
                    2.2.2.2 Breakdown of primaries
    2.3 REPORT SCOPE 
           FIGURE 3 METRICS CONSIDERED TO ASSESS DEMAND FOR PORTABLE GENERATORS
    2.4 MARKET SIZE ESTIMATION 
           2.4.1 BOTTOM-UP APPROACH
           FIGURE 4 MARKET SIZE ESTIMATION METHODOLOGY: BOTTOM-UP APPROACH
           2.4.2 TOP-DOWN APPROACH
                    FIGURE 5 MARKET SIZE ESTIMATION METHODOLOGY: TOP-DOWN APPROACH
           2.4.3 DEMAND-SIDE ANALYSIS
                    2.4.3.1 Regional analysis
                    2.4.3.2 Country-level analysis
                    2.4.3.3 Assumptions for demand-side analysis
                    2.4.3.4 Calculations for demand-side analysis
           2.4.4 SUPPLY-SIDE ANALYSIS
                    FIGURE 6 KEY STEPS CONSIDERED TO ASSESS SUPPLY OF PORTABLE GENERATORS
                    FIGURE 7 PORTABLE GENERATOR MARKET: SUPPLY-SIDE ANALYSIS
                    2.4.4.1 Calculations for supply-side analysis
                    2.4.4.2 Assumptions for supply-side analysis
                               FIGURE 8 COMPANY REVENUE ANALYSIS, 2021
           2.4.5 FORECAST
 
3 EXECUTIVE SUMMARY (Page No. - 43)
    TABLE 1 PORTABLE GENERATOR MARKET: SNAPSHOT 
    FIGURE 9 ASIA PACIFIC TO REGISTER HIGHEST CAGR IN MARKET DURING FORECAST PERIOD 
    FIGURE 10 EMERGENCY SEGMENT TO HOLD LARGER SHARE OF MARKET, BY APPLICATION, DURING FORECAST PERIOD 
    FIGURE 11 GASOLINE SEGMENT TO HOLD LARGEST SHARE OF MARKET, BY FUEL, DURING FORECAST PERIOD 
    FIGURE 12 5–10 KW SEGMENT TO HOLD LARGEST SHARE OF MARKET, BY POWER RATING, DURING FORECAST PERIOD 
    FIGURE 13 RESIDENTIAL SEGMENT TO HOLD LARGEST SHARE OF MARKET, BY END USER, DURING FORECAST PERIOD 
    FIGURE 14 CONVENTIONAL GENERATOR SEGMENT TO HOLD LARGER SHARE OF MARKET, BY PRODUCT TYPE, DURING FORECAST PERIOD 
 
4 PREMIUM INSIGHTS (Page No. - 47)
    4.1 ATTRACTIVE OPPORTUNITIES FOR PLAYERS OPERATING IN PORTABLE GENERATOR MARKET 
           FIGURE 15 RISING DEMAND FOR BACKUP POWER SOURCES DURING POWER OUTAGES
    4.2 MARKET, BY REGION 
           FIGURE 16 ASIA PACIFIC TO REGISTER HIGHEST CAGR IN MARKET DURING FORECAST PERIOD
    4.3 NORTH AMERICAN MARKET, BY END USER AND COUNTRY 
           FIGURE 17 RESIDENTIAL SEGMENT AND US DOMINATED NORTH AMERICAN MARKET IN 2021
    4.4 MARKET, BY END USER 
           FIGURE 18 RESIDENTIAL SEGMENT TO DOMINATE MARKET IN 2027
    4.5 MARKET, BY FUEL 
           FIGURE 19 GASOLINE SEGMENT TO DOMINATE MARKET IN 2027
    4.6 MARKET, BY APPLICATION 
           FIGURE 20 EMERGENCY SEGMENT TO DOMINATE MARKET IN 2027
    4.7 MARKET, BY POWER RATING 
           FIGURE 21 5–10 KW SEGMENT TO DOMINATE MARKET IN 2027
    4.8 MARKET, BY PRODUCT TYPE 
           FIGURE 22 CONVENTIONAL GENERATOR SEGMENT TO DOMINATE MARKET IN 2027
 
5 MARKET OVERVIEW (Page No. - 51)
    5.1 INTRODUCTION 
    5.2 MARKET DYNAMICS 
           FIGURE 23 PORTABLE GENERATOR MARKET: DRIVERS, RESTRAINTS, OPPORTUNITIES, AND CHALLENGES
           5.2.1 DRIVERS
                    5.2.1.1 Rising instances of power outages
                               FIGURE 24 COMPARISON OF POWER OUTAGE TREND: WEATHER- AND NON-WEATHER-RELATED CONDITIONS IN US, 2010–2021
                               FIGURE 25 WEATHER-RELATED INSTANCES CAUSING POWER OUTAGES IN US, 2011–2021
                    5.2.1.2 Growing construction activities
                               FIGURE 26 SHARE OF GLOBAL CONSTRUCTION OUTPUT, BY REGION, 2020 VS. 2030
                               FIGURE 27 REGIONAL CONSTRUCTION GROWTH (CAGR), 2021–2030
           5.2.2 RESTRAINTS
                    5.2.2.1 Stringent government regulations pertaining to emissions from generators
                    5.2.2.2 Suitability of portable generators for low-power applications
           5.2.3 OPPORTUNITIES
                    5.2.3.1 Technological advancements such as dual-fuel and inverter portable generators
                    5.2.3.2 Increase in power demand with growing urbanization
                               FIGURE 28 GROWTH IN GLOBAL URBANIZATION, 2010–2050
           5.2.4 CHALLENGES
                    5.2.4.1 Increasing adoption of renewable energy solutions
                    5.2.4.2 Noise and exhaust issues associated with portable generators
    5.3 TRENDS/DISRUPTIONS IMPACTING CUSTOMERS’ BUSINESSES 
           5.3.1 REVENUE SHIFT AND NEW REVENUE POCKETS FOR MARKET PLAYERS
                    FIGURE 29 REVENUE SHIFT FOR PLAYERS IN MARKET
    5.4 VALUE CHAIN ANALYSIS 
           FIGURE 30 MARKET: VALUE CHAIN ANALYSIS
           5.4.1 RAW MATERIAL PROVIDERS/SUPPLIERS
           5.4.2 COMPONENT MANUFACTURERS
           5.4.3 MANUFACTURERS/ASSEMBLERS
           5.4.4 END USERS
           5.4.5 POST-SALES SERVICE PROVIDERS
    5.5 MARKET MAP 
           FIGURE 31 MARKET MAP
           TABLE 2 MARKET: ROLE IN ECOSYSTEM
    5.6 AVERAGE SELLING PRICE ANALYSIS 
           FIGURE 32 AVERAGE SELLING PRICE OF PORTABLE GENERATORS, BY POWER RATING
           TABLE 3 AVERAGE SELLING PRICE OF PORTABLE GENERATORS, BY POWER RATING (USD)
    5.7 TECHNOLOGY ANALYSIS 
           5.7.1 SAFETY TECHNOLOGY FOR PORTABLE GENERATORS
           5.7.2 HYBRID GENERATORS
    5.8 TRADE ANALYSIS 
           5.8.1 EXPORT SCENARIO
                    TABLE 4 EXPORT SCENARIO FOR HS CODE 850161, BY COUNTRY, 2019–2021 (USD THOUSAND)
           5.8.2 IMPORT SCENARIO
                    TABLE 5 IMPORT SCENARIO FOR HS CODE: 8501, BY COUNTRY, 2019–2021 (USD THOUSAND)
    5.9 TARIFF AND REGULATORY LANDSCAPE 
           5.9.1 REGULATORY BODIES, GOVERNMENT AGENCIES, AND OTHER ORGANIZATIONS
                    TABLE 6 NORTH AMERICA: LIST OF REGULATORY BODIES, GOVERNMENT AGENCIES, AND OTHER ORGANIZATIONS
                    TABLE 7 EUROPE: LIST OF REGULATORY BODIES, GOVERNMENT AGENCIES, AND OTHER ORGANIZATIONS
                    TABLE 8 ASIA PACIFIC: LIST OF REGULATORY BODIES, GOVERNMENT AGENCIES, AND OTHER ORGANIZATIONS
                    TABLE 9 ROW: LIST OF REGULATORY BODIES, GOVERNMENT AGENCIES, AND OTHER ORGANIZATIONS
           5.9.2 CODES AND REGULATIONS RELATED TO PORTABLE GENERATORS
                    TABLE 10 NORTH AMERICA: CODES AND REGULATIONS
                    TABLE 11 ASIA PACIFIC: CODES AND REGULATIONS
                    TABLE 12 SOUTH AMERICA: CODES AND REGULATIONS
                    TABLE 13 GLOBAL: CODES AND REGULATIONS
    5.10 PORTER’S FIVE FORCES ANALYSIS 
           FIGURE 33 MARKET: PORTER’S FIVE FORCES ANALYSIS
           TABLE 14 MARKET: PORTER’S FIVE FORCES ANALYSIS
           5.10.1 THREAT OF SUBSTITUTES
           5.10.2 BARGAINING POWER OF SUPPLIERS
           5.10.3 BARGAINING POWER OF BUYERS
           5.10.4 THREAT OF NEW ENTRANTS
           5.10.5 INTENSITY OF COMPETITIVE RIVALRY
    5.11 KEY STAKEHOLDERS AND BUYING CRITERIA 
           5.11.1 KEY STAKEHOLDERS IN BUYING PROCESS
                    FIGURE 34 INFLUENCE OF STAKEHOLDERS ON BUYING PROCESS, BY END USER
                    TABLE 15 INFLUENCE OF STAKEHOLDERS ON BUYING PROCESS FOR TOP END USERS (%)
           5.11.2 BUYING CRITERIA
                    FIGURE 35 KEY BUYING CRITERIA OF TOP END USERS
                    TABLE 16 KEY BUYING CRITERIA, BY END USER
    5.12 INNOVATIONS AND PATENT REGISTRATIONS 
                    TABLE 17 MARKET: INNOVATIONS AND PATENT REGISTRATIONS, 2021
    5.13 CASE STUDY ANALYSIS 
           5.13.1 PR POWER SUPPLIES ITS PORTABLE DIESEL GENERATOR TO SALVATION ARMY FOR EMERGENCY SERVICES
           5.13.2 HONDA POWER EQUIPMENT LAUNCHED CO-MINDER SYSTEM
    5.14 KEY CONFERENCES AND EVENTS, 2022–2023 
                    TABLE 18 MARKET: DETAILED LIST OF CONFERENCES AND EVENTS
 
6 PORTABLE GENERATOR MARKET, BY APPLICATION (Page No. - 77)
    6.1 INTRODUCTION 
           FIGURE 36 MARKET, BY APPLICATION, 2021
           TABLE 19 MARKET, BY APPLICATION, 2020–2027 (USD MILLION)
    6.2 EMERGENCY 
           6.2.1 INCREASING WEATHER-RELATED POWER OUTAGES
                    TABLE 20 EMERGENCY: MARKET, BY REGION, 2020–2027 (USD MILLION)
    6.3 PRIME/CONTINUOUS 
           6.3.1 INCREASING DEMAND FOR RELIABLE POWER FROM SMALL COMMERCIAL ESTABLISHMENTS IN REMOTE LOCATIONS
                    TABLE 21 PRIME/CONTINUOUS: MARKET, BY REGION, 2020–2027 (USD MILLION)
 
7 PORTABLE GENERATOR MARKET, BY FUEL (Page No. - 80)
    7.1 INTRODUCTION 
           FIGURE 37 MARKET, BY FUEL, 2021
           TABLE 22 MARKET, BY FUEL, 2020–2027 (USD MILLION)
    7.2 GASOLINE 
           7.2.1 ABUNDANT AVAILABILITY OF GASOLINE
                    TABLE 23 GASOLINE: MARKET, BY REGION, 2020–2027 (USD MILLION)
    7.3 DIESEL 
           7.3.1 HIGH FUEL EFFICIENCY ASSOCIATED WITH DIESEL-BASED PORTABLE GENERATORS
                    TABLE 24 DIESEL: MARKET, BY REGION, 2020–2027 (USD MILLION)
    7.4 NATURAL GAS 
           7.4.1 GROWING DEMAND FOR ENVIRONMENTALLY FRIENDLY FUELS
                    TABLE 25 NATURAL GAS: MARKET, BY REGION, 2020–2027 (USD MILLION)
    7.5 OTHERS 
           TABLE 26 OTHERS: MARKET, BY REGION, 2020–2027 (USD MILLION)
 
8 PORTABLE GENERATOR MARKET, BY POWER RATING (Page No. - 85)
    8.1 INTRODUCTION 
           FIGURE 38 MARKET, BY POWER RATING, 2021
           TABLE 27 MARKET, BY POWER RATING, 2020–2027 (USD MILLION)
    8.2 BELOW 5 KW 
           8.2.1 RISING USE IN APPLICATIONS REQUIRING LOW POWER
                    TABLE 28 BELOW 5 KW: MARKET, BY REGION, 2020–2027 (USD MILLION)
    8.3 5–10 KW 
           8.3.1 SUITABILITY FOR USE IN RECREATIONAL ACTIVITIES
                    TABLE 29 5–10 KW: MARKET, BY REGION, 2020–2027 (USD MILLION)
    8.4 10–20 KW 
           8.4.1 RISING NEED FOR RELIABLE POWER SUPPLY IN INDUSTRIAL SECTOR
                    TABLE 30 10–20 KW: MARKET, BY REGION, 2020–2027 (USD MILLION)
 
9 PORTABLE GENERATOR MARKET, BY PRODUCT TYPE (Page No. - 89)
    9.1 INTRODUCTION 
           FIGURE 39 MARKET, BY PRODUCT TYPE, 2021
           TABLE 31 MARKET, BY PRODUCT TYPE, 2020–2027 (USD MILLION)
    9.2 INVERTER GENERATOR 
           9.2.1 RISING DEMAND FOR INVERTER GENERATORS IN DIFFERENT APPLICATIONS ATTRIBUTED TO HIGH POWER QUALITY AND FUEL EFFICIENCY FEATURES
                    TABLE 32 INVERTER GENERATOR: MARKET, BY REGION, 2020–2027 (USD MILLION)
    9.3 CONVENTIONAL GENERATOR 
           9.3.1 GROWING ADOPTION OF CONVENTIONAL GENERATORS AS EMERGENCY BACKUP SOURCE
                    TABLE 33 CONVENTIONAL GENERATOR: MARKET, BY REGION, 2020–2027 (USD MILLION)
 
10 PORTABLE GENERATOR MARKET, BY END USER (Page No. - 92)
     10.1 INTRODUCTION 
               FIGURE 40 MARKET, BY END USER, 2021
               TABLE 34 MARKET, BY END USER, 2020–2027 (USD MILLION)
     10.2 RESIDENTIAL 
             10.2.1 INCREASING BLACKOUTS ATTRIBUTED TO AGING GRID INFRASTRUCTURE
                       TABLE 35 RESIDENTIAL: MARKET, BY REGION, 2020–2027 (USD MILLION)
     10.3 COMMERCIAL 
             10.3.1 INCREASING DEMAND FOR RELIABLE POWER FROM SMALL COMMERCIAL ESTABLISHMENTS
                       TABLE 36 COMMERCIAL: MARKET, BY REGION, 2020–2027 (USD MILLION)
     10.4 INDUSTRIAL 
             10.4.1 CONSTRUCTION
                       10.4.1.1 Increasing need for backup power in remote locations
             10.4.2 MINING
                       10.4.2.1 Growing use of portable generators in mining industry attributed to compatible structure
             10.4.3 INDUSTRIAL MANUFACTURING
                       10.4.3.1 Increasing industrialization in developing countries
             10.4.4 OTHERS
                       TABLE 37 INDUSTRIAL: MARKET, BY REGION, 2020–2027 (USD MILLION)
 
11 PORTABLE GENERATOR MARKET, BY REGION (Page No. - 97)
     11.1 INTRODUCTION 
               FIGURE 41 ASIA PACIFIC MARKET TO REGISTER HIGHEST CAGR DURING FORECAST PERIOD
               FIGURE 42 MARKET, BY REGION, 2021
               TABLE 38 MARKET, BY REGION, 2020–2027 (USD MILLION)
               TABLE 39 MARKET, BY REGION, 2020–2027 (THOUSAND UNITS)
     11.2 NORTH AMERICA 
               FIGURE 43 NORTH AMERICA: SNAPSHOT OF PORTABLE GENERATOR MARKET
             11.2.1 NORTH AMERICAN MARKET: RECESSION IMPACT
                       TABLE 40 NORTH AMERICA: MARKET, BY APPLICATION, 2020–2027 (USD MILLION)
                       TABLE 41 NORTH AMERICA: MARKET, BY FUEL, 2020–2027 (USD MILLION)
                       TABLE 42 NORTH AMERICA: MARKET, BY POWER RATING, 2020–2027 (USD MILLION)
                       TABLE 43 NORTH AMERICA: MARKET, BY PRODUCT TYPE, 2020–2027 (USD MILLION)
                       TABLE 44 NORTH AMERICA: MARKET, BY END USER, 2020–2027 (USD MILLION)
                       TABLE 45 NORTH AMERICA: MARKET, BY COUNTRY, 2020–2027 (USD MILLION)
             11.2.2 US
                       11.2.2.1 Increasing demand for portable generators with rising environmental disruptions
                                   TABLE 46 US: MARKET, BY END USER, 2020–2027 (USD MILLION)
             11.2.3 CANADA
                       11.2.3.1 Rising demand for continuous power supply
                                   TABLE 47 CANADA: MARKET, BY END USER, 2020–2027 (USD MILLION)
             11.2.4 MEXICO
                       11.2.4.1 Growing requirement for power in residential and industrial sectors
                                   TABLE 48 MEXICO: MARKET, BY END USER, 2020–2027 (USD MILLION)
     11.3 ASIA PACIFIC 
               FIGURE 44 ASIA PACIFIC: SNAPSHOT OF MARKET
             11.3.1 ASIA PACIFIC MARKET: RECESSION IMPACT
                       TABLE 49 ASIA PACIFIC: MARKET, BY APPLICATION, 2020–2027 (USD MILLION)
                       TABLE 50 ASIA PACIFIC: MARKET, BY FUEL, 2020–2027 (USD MILLION)
                       TABLE 51 ASIA PACIFIC: MARKET, BY POWER RATING, 2020–2027 (USD MILLION)
                       TABLE 52 ASIA PACIFIC: MARKET, BY PRODUCT TYPE, 2020–2027 (USD MILLION)
                       TABLE 53 ASIA PACIFIC: MARKET, BY END USER, 2020–2027 (USD MILLION)
                       TABLE 54 ASIA PACIFIC: MARKET, BY COUNTRY, 2020–2027 (USD MILLION)
             11.3.2 CHINA
                       11.3.2.1 Expanding industrial and real estate sectors
                                   TABLE 55 CHINA: MARKET, BY END USER, 2020–2027 (USD MILLION)
             11.3.3 INDIA
                       11.3.3.1 Government-led initiatives to boost industrialization
                                   TABLE 56 INDIA: MARKET, BY END USER, 2020–2027 (USD MILLION)
             11.3.4 JAPAN
                       11.3.4.1 Renovation of grid infrastructures and rising natural gas production
                                   TABLE 57 JAPAN: MARKET, BY END USER, 2020–2027 (USD MILLION)
             11.3.5 SOUTH KOREA
                       11.3.5.1 Rising power demand with infrastructure developments
                                   TABLE 58 SOUTH KOREA: MARKET, BY END USER, 2020–2027 (USD MILLION)
             11.3.6 AUSTRALIA
                       11.3.6.1 Increasing construction activities
                                   TABLE 59 AUSTRALIA: MARKET, BY END USER, 2020–2027 (USD MILLION)
             11.3.7 REST OF ASIA PACIFIC
                       TABLE 60 REST OF ASIA PACIFIC: MARKET, BY END USER, 2020–2027 (USD MILLION)
     11.4 EUROPE 
             11.4.1 EUROPEAN MARKET: RECESSION IMPACT
                       TABLE 61 EUROPE: MARKET, BY APPLICATION, 2020–2027 (USD MILLION)
                       TABLE 62 EUROPE: MARKET, BY FUEL, 2020–2027 (USD MILLION)
                       TABLE 63 EUROPE: MARKET, BY POWER RATING, 2020–2027 (USD MILLION)
                       TABLE 64 EUROPE: MARKET, BY END USER, 2020–2027 (USD MILLION)
                       TABLE 65 EUROPE: MARKET, BY PRODUCT TYPE, 2020–2027 (USD MILLION)
                       TABLE 66 EUROPE: MARKET, BY COUNTRY, 2020–2027 (USD MILLION)
             11.4.2 GERMANY
                       11.4.2.1 Rising power demand in various sectors
                                   TABLE 67 GERMANY: MARKET, BY END USER, 2020–2027 (USD MILLION)
             11.4.3 FRANCE
                       11.4.3.1 Rising adoption of low carbon strategy and infrastructure developments
                                   TABLE 68 FRANCE: MARKET, BY END USER, 2020–2027 (USD MILLION)
             11.4.4 UK
                       11.4.4.1 Booming construction industry
                                   TABLE 69 UK: MARKET, BY END USER, 2020–2027 (USD MILLION)
             11.4.5 RUSSIA
                       11.4.5.1 Growing investments in public and residential infrastructure development
                                   TABLE 70 RUSSIA: MARKET, BY END USER, 2020–2027 (USD MILLION)
             11.4.6 REST OF EUROPE
                       TABLE 71 REST OF EUROPE: MARKET, BY END USER, 2020–2027 (USD MILLION)
     11.5 MIDDLE EAST & AFRICA 
             11.5.1 MIDDLE EASTERN & AFRICAN MARKET: RECESSION IMPACT
                       TABLE 72 MIDDLE EAST & AFRICA: MARKET, BY APPLICATION, 2020–2027 (USD MILLION)
                       TABLE 73 MIDDLE EAST & AFRICA: MARKET, BY FUEL, 2020–2027 (USD MILLION)
                       TABLE 74 MIDDLE EAST & AFRICA: MARKET, BY POWER RATING, 2020–2027 (USD MILLION)
                       TABLE 75 MIDDLE EAST & AFRICA: MARKET, BY PRODUCT TYPE, 2020–2027 (USD MILLION)
                       TABLE 76 MIDDLE EAST & AFRICA: MARKET, BY END USER, 2020–2027 (USD MILLION)
                       TABLE 77 MIDDLE EAST & AFRICA: MARKET, BY COUNTRY, 2020–2027 (USD MILLION)
             11.5.2 SAUDI ARABIA
                       11.5.2.1 Increasing government-led initiatives to meet rising power demand
                                   TABLE 78 SAUDI ARABIA: MARKET, BY END USER, 2020–2027 (USD MILLION)
             11.5.3 UAE
                       11.5.3.1 Expanding construction and tourism industries
                                   TABLE 79 UAE: MARKET, BY END USER, 2020–2027 (USD MILLION)
             11.5.4 SOUTH AFRICA
                       11.5.4.1 Extreme temperatures and weather disruptions
                                   TABLE 80 SOUTH AFRICA: MARKET, BY END USER, 2020–2027 (USD MILLION)
             11.5.5 NIGERIA
                       11.5.5.1 Inefficient transmission and distribution network
                                   TABLE 81 NIGERIA: MARKET, BY END USER, 2020–2027 (USD MILLION)
             11.5.6 ALGERIA
                       11.5.6.1 Harsh weather-related issues
                                   TABLE 82 ALGERIA: MARKET, BY END USER, 2020–2027 (USD MILLION)
             11.5.7 REST OF MIDDLE EAST & AFRICA
                       TABLE 83 REST OF MIDDLE EAST & AFRICA: MARKET, BY END USER, 2020–2027 (USD MILLION)
     11.6 SOUTH AMERICA 
             11.6.1 SOUTH AMERICAN PORTABLE GENERATOR MARKET: RECESSION IMPACT
                       TABLE 84 SOUTH AMERICA: MARKET, BY APPLICATION, 2020–2027 (USD MILLION)
                       TABLE 85 SOUTH AMERICA: MARKET, BY FUEL, 2020–2027 (USD MILLION)
                       TABLE 86 SOUTH AMERICA: MARKET, BY POWER RATING, 2020–2027 (USD MILLION)
                       TABLE 87 SOUTH AMERICA: MARKET, BY PRODUCT TYPE, 2020–2027 (USD MILLION)
                       TABLE 88 SOUTH AMERICA: MARKET, BY END USER, 2020–2027 (USD MILLION)
                       TABLE 89 SOUTH AMERICA: MARKET, BY COUNTRY, 2020–2027 (USD MILLION)
             11.6.2 BRAZIL
                       11.6.2.1 Increased demand for reliable power
                                   TABLE 90 BRAZIL: MARKET, BY END USER, 2020–2027 (USD MILLION)
             11.6.3 ARGENTINA
                       11.6.3.1 Rising infrastructure development
                                   TABLE 91 ARGENTINA: MARKET, BY END USER, 2020–2027 (USD MILLION)
             11.6.4 CHILE
                       11.6.4.1 Growing need for sustainable and clean energy
                                   TABLE 92 CHILE: MARKET, BY END USER, 2020–2027 (USD MILLION)
             11.6.5 REST OF SOUTH AMERICA
                       TABLE 93 REST OF SOUTH AMERICA: MARKET, BY END USER, 2020–2027 (USD MILLION)
 
12 COMPETITIVE LANDSCAPE (Page No. - 128)
     12.1 KEY STRATEGIES ADOPTED BY MAJOR PLAYERS 
               TABLE 94 STRATEGIES ADOPTED BY KEY MANUFACTURERS OF PORTABLE GENERATORS
     12.2 MARKET SHARE ANALYSIS OF TOP FIVE PLAYERS, 2021 
               FIGURE 45 MARKET SHARE ANALYSIS OF TOP FIVE PLAYERS IN PORTABLE GENERATORS MARKET, 2021
               TABLE 95 MARKET: DEGREE OF COMPETITION
               FIGURE 46 MARKET SHARE ANALYSIS, 2021
     12.3 FIVE-YEAR COMPANY REVENUE ANALYSIS 
               FIGURE 47 REVENUE ANALYSIS OF TOP FIVE PLAYERS IN MARKET FROM 2017 TO 2021
     12.4 COMPANY EVALUATION QUADRANT, 2021 
             12.4.1 STARS
             12.4.2 PERVASIVE PLAYERS
             12.4.3 EMERGING LEADERS
             12.4.4 PARTICIPANTS
                       FIGURE 48 MARKET (GLOBAL): COMPANY EVALUATION QUADRANT, 2021
     12.5 STARTUP/SME EVALUATION QUADRANT 
             12.5.1 PROGRESSIVE COMPANIES
             12.5.2 RESPONSIVE COMPANIES
             12.5.3 DYNAMIC COMPANIES
             12.5.4 STARTING BLOCKS
                       FIGURE 49 MARKET: STARTUP/SMALL AND MEDIUM-SIZED ENTERPRISE (SME) EVALUATION QUADRANT, 2021
     12.6 COMPETITIVE BENCHMARKING 
               TABLE 96 MARKET: DETAILED LIST OF KEY STARTUPS/SMES
               TABLE 97 MARKET: COMPETITIVE BENCHMARKING OF KEY STARTUPS/SMES
     12.7 MARKET: COMPANY FOOTPRINT 
               TABLE 98 FUEL: COMPANY FOOTPRINT
               TABLE 99 END USER: COMPANY FOOTPRINT
               TABLE 100 REGION: COMPANY FOOTPRINT
               TABLE 101 COMPANY FOOTPRINT
     12.8 COMPETITIVE SCENARIO 
               TABLE 102 MARKET: PRODUCT LAUNCHES, JUNE 2018–APRIL 2021
               TABLE 103 MARKET: DEALS, SEPTEMBER 2021
 
13 COMPANY PROFILES (Page No. - 141)
     13.1 KEY PLAYERS 
(Business Overview, Products/Services/Solutions Offered, Recent Developments, and MnM View)*
             13.1.1 ATLAS COPCO
                       TABLE 104 ATLAS COPCO: COMPANY OVERVIEW
                       FIGURE 50 ATLAS COPCO: COMPANY SNAPSHOT
                       TABLE 105 ATLAS COPCO: PRODUCTS/SERVICES/SOLUTIONS OFFERED
                       TABLE 106 ATLAS COPCO: DEALS
             13.1.2 BRIGGS & STRATTON
                       TABLE 107 BRIGGS & STRATTON: COMPANY OVERVIEW
                       TABLE 108 BRIGGS & STRATTON: PRODUCTS/SERVICES/SOLUTIONS OFFERED
                       TABLE 109 BRIGGS & STRATTON: PRODUCT LAUNCHES
                       TABLE 110 BRIGGS & STRATTON: DEALS
             13.1.3 GENERAC
                       TABLE 111 GENERAC: COMPANY OVERVIEW
                       FIGURE 51 GENERAC: COMPANY SNAPSHOT
                       TABLE 112 GENERAC: PRODUCTS/SERVICES/SOLUTIONS OFFERED
                       TABLE 113 GENERAC: DEALS
                       TABLE 114 GENERAC: PRODUCT LAUNCHES
             13.1.4 HONDA
                       TABLE 115 HONDA: COMPANY OVERVIEW
                       FIGURE 52 HONDA: COMPANY SNAPSHOT
                       TABLE 116 HONDA: PRODUCTS/SERVICES/SOLUTIONS OFFERED
                       TABLE 117 HONDA: PRODUCT LAUNCHES
             13.1.5 YAMAHA
                       TABLE 118 YAMAHA: COMPANY OVERVIEW
                       FIGURE 53 YAMAHA: COMPANY SNAPSHOT
                       TABLE 119 YAMAHA: PRODUCTS/SERVICES/SOLUTIONS OFFERED
                       TABLE 120 YAMAHA: PRODUCT LAUNCHES
             13.1.6 CATERPILLAR INC.
                       TABLE 121 CATERPILLAR INC.: COMPANY OVERVIEW
                       FIGURE 54 CATERPILLAR INC.: COMPANY SNAPSHOT
                       TABLE 122 CATERPILLAR INC.: PRODUCTS/SERVICES/SOLUTIONS OFFERED
             13.1.7 CUMMINS
                       TABLE 123 CUMMINS: COMPANY OVERVIEW
                       FIGURE 55 CUMMINS: COMPANY SNAPSHOT
                       TABLE 124 CUMMINS: PRODUCTS/SERVICES/SOLUTIONS OFFERED
             13.1.8 HONEYWELL INTERNATIONAL INC.
                       TABLE 125 HONEYWELL INTERNATIONAL INC.: COMPANY OVERVIEW
                       FIGURE 56 HONEYWELL INTERNATIONAL INC.: COMPANY SNAPSHOT
                       TABLE 126 HONEYWELL INTERNATIONAL INC.: PRODUCTS/SERVICES/SOLUTIONS OFFERED
             13.1.9 SIEMENS
                       TABLE 127 SIEMENS: COMPANY OVERVIEW
                       FIGURE 57 SIEMENS: COMPANY SNAPSHOT
                       TABLE 128 SIEMENS: PRODUCTS/SERVICES/SOLUTIONS OFFERED
                       TABLE 129 SIEMENS: DEALS
             13.1.10 RATO EUROPE
                       TABLE 130 RATO EUROPE: COMPANY OVERVIEW
                       TABLE 131 RATO EUROPE: PRODUCTS/SERVICES/SOLUTIONS OFFERED
             13.1.11 KOHLER
                       TABLE 132 KOHLER: COMPANY OVERVIEW
                       TABLE 133 KOHLER: PRODUCTS/SERVICES/SOLUTIONS OFFERED
                       TABLE 134 KOHLER: PRODUCT LAUNCHES
             13.1.12 INMESOL
                       TABLE 135 INMESOL: COMPANY OVERVIEW
                       TABLE 136 INMESOL: PRODUCTS/SERVICES/SOLUTIONS OFFERED
             13.1.13 HIMOINSA
                       TABLE 137 HIMOINSA: COMPANY OVERVIEW
                       TABLE 138 HIMOINSA: PRODUCTS/SERVICES/SOLUTIONS OFFERED
                       TABLE 139 HIMOINSA: PRODUCT LAUNCHES
             13.1.14 DUROMAX
                       TABLE 140 DUROMAX: COMPANY OVERVIEW
                       TABLE 141 DUROMAX: PRODUCTS/SERVICES/SOLUTIONS OFFERED
             13.1.15 LONCIN
                       TABLE 142 LONCIN: COMPANY OVERVIEW
                       TABLE 143 LONCIN: PRODUCTS/SERVICES/SOLUTIONS OFFERED
* Business Overview, Products/Services/Solutions Offered, Recent Developments, and MnM View might not be captured in case of unlisted companies.
     13.2 OTHER PLAYERS 
             13.2.1 CHAMPION POWER EQUIPMENT
             13.2.2 WEN
             13.2.3 PULSAR PRODUCTS
             13.2.4 WESTINGHOUSE
             13.2.5 WACKER NEUSON
 
14 ADJACENT AND RELATED MARKETS (Page No. - 182)
     14.1 INTRODUCTION 
     14.2 LIMITATIONS 
     14.3 PORTABLE GENERATOR INTERCONNECTED MARKETS 
     14.4 PORTABLE GENERATOR MARKET 
             14.4.1 MARKET DEFINITION
             14.4.2 LIMITATIONS
             14.4.3 MARKET OVERVIEW
             14.4.4 PORTABLE GENERATOR MARKET, BY POWER RATING
                       14.4.4.1 Below 600 W
                                   TABLE 144 BELOW 600 W: MARKET, BY REGION, 2018–2027 (USD MILLION)
                       14.4.4.2 600 W–1 kW
                                   TABLE 145 600 W–1 KW: MARKET, BY REGION, 2018–2027 (USD MILLION)
                       14.4.4.3 1–5 kW
                                   TABLE 146 1–5 KW: MARKET, BY REGION, 2018–2027 (USD MILLION)
                       14.4.4.4 5–20 kW
                                   TABLE 147 5–20 KW: MARKET, BY REGION, 2018–2027 (USD MILLION)
                       14.4.4.5 20–50 kW
                                   TABLE 148 20–50 KW: MARKET, BY REGION, 2018–2027 (USD MILLION)
     14.5 US MARKET 
             14.5.1 OBJECTIVES
             14.5.2 POSITIVE FACTORS
                       14.5.2.1 Growing demand for continuous and reliable power supply during blackouts
                       14.5.2.2 Increasing instances of power outages owing to aging grid infrastructure and extreme weather conditions
                       14.5.2.3 Increasing adoption of dual-fuel and inverter portable generators
             14.5.3 NEGATIVE FACTORS
                       14.5.3.1 Limited power generation capacity of portable generators
                       14.5.3.2 Stringent government regulations pertaining to emissions from diesel engines
                       14.5.3.3 Adoption of energy storage technologies due to price drop
 
15 APPENDIX (Page No. - 187)
     15.1 INSIGHTS FROM INDUSTRY EXPERTS 
     15.2 DISCUSSION GUIDE 
     15.3 KNOWLEDGESTORE: MARKETSANDMARKETS’ SUBSCRIPTION PORTAL 
     15.4 CUSTOMIZATION OPTIONS 
     15.5 RELATED REPORTS 
     15.6 AUTHOR DETAILS 
 

The study involved major activities in estimating the current size of the portable generator market. Exhaustive secondary research was done to collect information on the peer and parent markets. The next step was to validate these findings, assumptions, and sizing with industry experts across the value chain through primary research. Both top-down and bottom-up approaches were employed to estimate the complete market size. Thereafter, market breakdown and data triangulation were used to estimate the market size of the segments and subsegments.

Secondary Research

This research study on the portable generator market involved the use of extensive secondary sources, directories, and databases, such as Hoovers, Bloomberg, Businessweek, Factiva, International Energy Agency, and BP Statistical Review of World Energy, to identify and collect information useful for a technical, market-oriented, and commercial study of the global portable generators market. The other secondary sources included annual reports, press releases, and investor presentations of companies, white papers, certified publications, articles by recognized authors, manufacturer associations, trade directories, and databases.

Primary Research

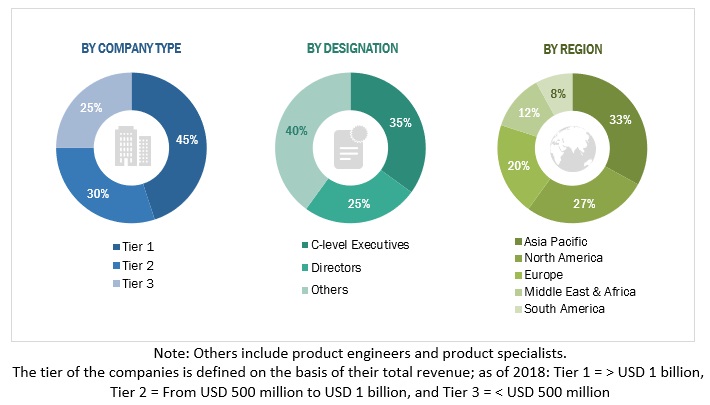
The portable generators market comprises several stakeholders such as portable generators manufacturers, manufacturers of components of portable generators infrastructure, technology providers, and technology support providers in the supply chain. The demand side of this market is characterized by the rising demand for portable generators in the nations to reduce the non-revenue water losses. The supply side is characterized by rising demand for contracts from the residential users, commercial users and mergers and acquisitions among big players. Various primary sources from both the supply and demand sides of the market were interviewed to obtain qualitative and quantitative information. Following is the breakdown of primary respondents:
Portable Generator Market Size, and Share

To know about the assumptions considered for the study, download the pdf brochure

Market Size Estimation

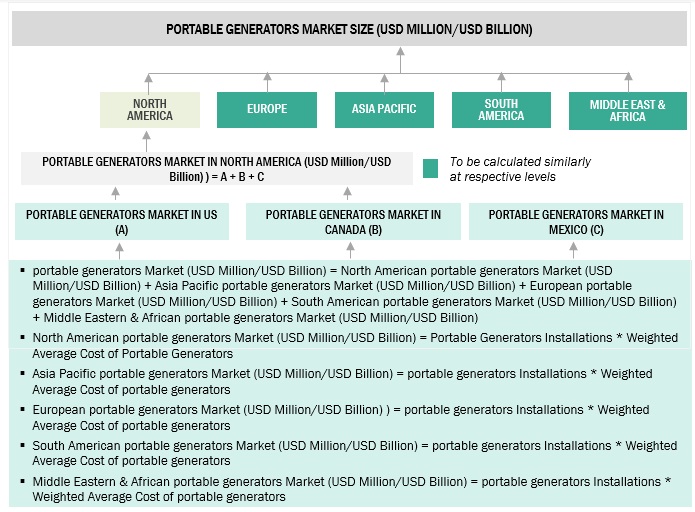
Both top-down and bottom-up approaches were used to estimate and validate the total size of the portable generators market. These methods were also used extensively to estimate the size of various subsegments in the market. The research methodology used to estimate the market size includes the following:

  • The key players in the industry and market have been identified through extensive secondary research, and their market share in the respective regions have been determined through both primary and secondary research.
  • The industry’s value chain and market size, in terms of value, have been determined through primary and secondary research processes.
  • All percentage shares, splits, and breakdowns have been determined using secondary sources and verified through primary sources.

Global Portable generators Market Size: Bottom-up Approach
Portable Generator Market Size, and Share

To know about the assumptions considered for the study, Request for Free Sample Report

Data Triangulation

After arriving at the overall market size from the estimation process explained above, the total market has been split into several segments and subsegments. To complete the overall market engineering process and arrive at the exact statistics for all the segments and subsegments, the data triangulation and market breakdown processes have been employed, wherever applicable. The data has been triangulated by studying various factors and trends from both the demand- and supply sides. Along with this, the market has been validated using both the top-down and bottom-up approaches.

Objectives of the Study

  • To define, describe, segment, and forecast the portable generators market size, by product type, fuel, power rating, end user, and application
  • To provide detailed information on the major drivers, restraints, opportunities, and industry-specific challenges influencing the growth of the portable generators market
  • To strategically analyze the portable generators market with respect to individual growth trends, prospects, and contributions of each segment to the market
  • To analyze market opportunities for stakeholders and provide a detailed competitive landscape for market leaders
  • To forecast the revenue of the market segments with respect to five main regions (along with countries), namely, North America, Europe, Asia Pacific, South America, and the Middle East & Africa
  • To strategically profile key players and comprehensively analyze their market ranking and core competencies
  • To track and analyze competitive developments such as new product developments, contracts & agreements, investments & expansions, and mergers & acquisitions in the portable generators market

Available Customizations:

With the given market data, MarketsandMarkets offers customizations as per the client’s specific needs. The following customization options are available for this report:

Geographic Analysis

  • Further breakdown of region or country-specific analysis

Company Information

  • Detailed analyses and profiling of additional market players (up to 5)
Custom Market Research Services

We will customize the research for you, in case the report listed above does not meet with your exact requirements. Our custom research will comprehensively cover the business information you require to help you arrive at strategic and profitable business decisions.

Request Customization

Instant Answers with GPT - Ask Now!

Ask real questions. Get complete answers !
Report Code
EP 5879
Published ON
Jan, 2023
Choose License Type
BUY NOW
  • SHARE
X
Request Customization
Speak to Analyst
Speak to Analyst
OR FACE-TO-FACE MEETING
PERSONALIZE THIS RESEARCH
  • Triangulate with your Own Data
  • Get Data as per your Format and Definition
  • Gain a Deeper Dive on a Specific Application, Geography, Customer or Competitor
  • Any level of Personalization
REQUEST A FREE CUSTOMIZATION
LET US HELP YOU!
  • What are the Known and Unknown Adjacencies Impacting the Portable Generator Market
  • What will your New Revenue Sources be?
  • Who will be your Top Customer; what will make them switch?
  • Defend your Market Share or Win Competitors
  • Get a Scorecard for Target Partners
CUSTOMIZED WORKSHOP REQUEST
knowledgestore logo

Want to explore hidden markets that can drive new revenue in Portable Generator Market?

Find Hidden Markets
  • Call Us
  • +1-888-600-6441 (Corporate office hours)
  • +1-888-600-6441 (US/Can toll free)
  • +44-800-368-9399 (UK office hours)
CONNECT WITH US
ABOUT TRUST ONLINE
©2024 MarketsandMarkets Research Private Ltd. All rights reserved
DMCA.com Protection Status
Website Feedback