Polyurethane (PU) Microspheres Market by Applications (Encapsulation, Coatings, Adhesives, and Cosmetics) - Global Trends & Forecasts to 2020
[109 Pages Report] The global Polyurethane (PU) microspheres market is expected to reach USD 74.4 Million by 2020 from USD 47.6 Million in 2014, growing at a CAGR of 7.8% from 2015 to 2020. The base year considered for the study is 2014 and the forecast period considered is from 2015 to 2020. This report provides a detailed analysis of the PU microspheres market based on application and region.
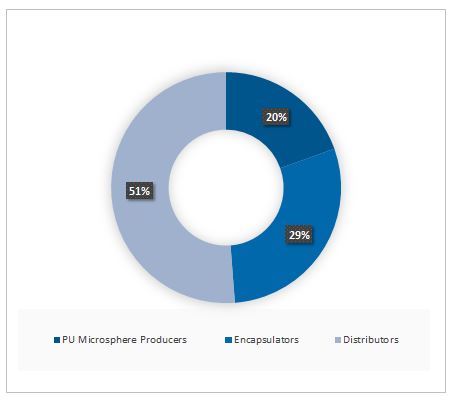
The research methodology for this research study was devised with a combination of primary and secondary sources. Extensive secondary sources such as directories and databases such as Hoovers, Bloomberg BusinessWeek, and Factiva were used to identify and collect information useful for this technical, market-oriented, and commercial study of the PU microspheres market. The primary sources were used to validate the information obtained from secondary or derived sources via in-house methodology. The primary participants covered industry experts from core and related industries along with preferred suppliers, manufacturers, distributors, service providers, and related organizations to all segments of the supply chain of the industry. Furthermore, in-depth interviews of various primary respondents were included from subject matter experts (SMEs), C-level executives of key market players, and industry consultants, among other experts. A combination of primary and secondary information sources were considered while obtaining and verifying critical qualitative and quantitative information with respect to both, the present market and future expectations. The figure below shows the breakdown of the primaries participants conducted during the research study.

To know about the assumptions considered for the study, download the pdf brochure
The PU microspheres market has a diversified ecosystem of upstream players, including raw material [Methylene Diphenyl Diisocyanate (MDI), Toluene Diisocyanate (TDI), and polyols] suppliers, along with downstream stakeholders, vendors, end use applications such as encapsulation, coatings, adhesives, and cosmetics; and government organizations. Key players in this market include Microchem (Switzerland), Sanyo chemical industries Ltd. (Japan), Supercolori S.p.A. (Italy), Kolon Industry Inc. (Korea), Bayer Material Science LLC (Germany), Heyo Enterprise Co. Ltd. (Taiwan, Republic of China), and Chase Corporation (U.S.) among others. The government and research organizations, raw material suppliers and distributors, construction companies, and industry associations are considered as critical stakeholders in this study.
Target Audience:
- PU Microspheres manufacturers
- PU microspheres traders, distributors, and suppliers
- PU manufacturers
- End-use market participants of different segments of PU microspheres
- Government and research organizations
- Associations and industrial bodies
- Research and consulting firms
- R&D institutions
- Environment support agencies
- Investment banks and private equity firms
Scope of the Report:
This research report categorizes the global PU microspheres market based on application and region.
The global PU microspheres market, on the basis of application, is segmented into:
- Encapsulation
- Paints & coatings
- Adhesives films
- Cosmetics
- Other applications
The global PU microspheres market, on the basis of region, is segmented into:
- North America
- Europe
- Asia-Pacific
- RoW
Available Customizations:
With the given market data, MarketsandMarkets offers customizations according to the company’s specific needs. The following customization options are available for the report:
Country Analysis:
- Country level deep-dive research
Company Information:
- Detailed analysis and profiling of additional market players (Up to five)
Product Analysis
- Product Matrix, which gives a detailed comparison of product portfolio of each company
The global Polyurethane (PU) microspheres market is projected to reach USD 74.4 Million by 2020 from USD 47.6 Million in 2014, growing at a CAGR of 7.8% from 2015 to 2020. The growing demand of plastic underbody and application in architectural coatings drives the demand for PU microspheres. Furthermore, the growing global demand for repositionable adhesives, technological developments in drug delivery, and crop protection via encapsulation is fueling the market growth for PU microspheres.
In terms of application, encapsulation dominated the PU microspheres consumption and accounted for the largest share of the PU microspheres market size in terms of value in 2014, owing to its huge consumption from various end use industries such as pharmaceutical, paints & coatings, and agro chemical industries. The major players in the encapsulation industry are backward integrated and hence a demand of approximately 70% is generated by companies that manufacture PU microspheres on their own. Technical feasibility problems such as inactivation of drugs during fabrication and poor control of drug release rates with the active agents is the reason why encapsulate producers tend to manufacture microspheres on their own.
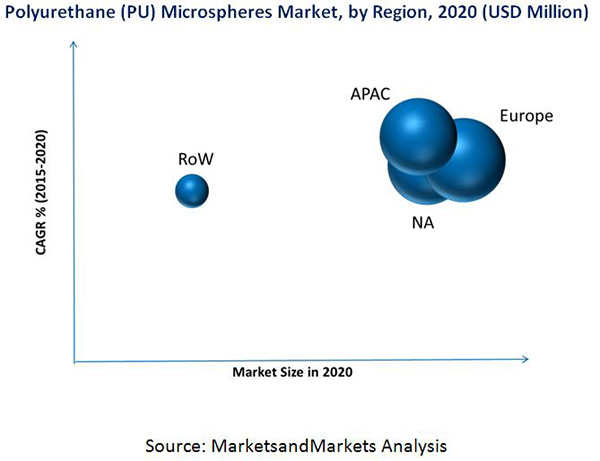
Asia-Pacific is projected to grow at the highest CAGR during the forecast period of 2015-2020. The regional market is primarily driven by the growth of major end-use industries such as construction, electronics, and automotive. China is the largest demand center in Asia-Pacific and accounts for over half of the total regional market volume. Various economic reforms in China over the last decade have helped the nation to emerge as the largest PU microspheres consuming country in the global market. The North American polyurethane market is characterized by its growing application in automotive and electronics. Evolving production technologies coupled with the growing importance for bio-based PU is expected to drive the Asia-Pacific market. Europe is the dominant market and is expected to exhibit considerable growth during the forecast period. The European region is a major consumer for wood coatings, architectural coatings, and plastic coatings for automotive underbody, and hence commands the major share by value in the PU microspheres market.

The relatively higher cost of PU microspheres and the regulations on rinse off products would inhibit the growth of the market. Bayer Material Science, LLC. (Germany) is among the top players in the PU microspheres market and is among the world’s largest polymer companies. Its business activities are focused on the manufacture of high-tech polymer materials and the development of innovative solutions for products used in many areas of daily life. Bayer is constantly focusing on improving people’s quality of life by preventing, alleviating, and curing diseases and thus, achieving its goal by sustaining leadership positions in the markets, and creating value for their customers, stockholders, and employees.
To speak to our analyst for a discussion on the above findings, click Speak to Analyst

Table of Contents
1 Introduction
1.1 Objectives of Study
1.2 Report Description
1.3 Markets Covered
1.4 Stakeholders
1.5 Currency & Years Considered for Study
2 Research Methodology
2.1 Market Size Estimation
2.2 Market Crackdown & Data Triangulation
2.3 Market Share Estimation
2.4 Report Assumptions
2.5 Participants Summary
3 Executive Summary
4 Market Overview
4.1 Market Definition
4.2 Market Dynamics
4.2.1 Market Drivers
4.2.2 Market Restraints
4.3 Value Chain Analysis
5 PU Microspheres Market, By Applicaitons
5.1 Encapsulation
5.2 Paints & Coatings
5.3 Adhesives
5.4 Cosmetics
5.5 Others Applications
6 PU Microspheres Market, By Geography
6.1 Snapshot : PU Microspheres Market, By Region
6.2 North America
6.3 Europe
6.4 APAC
6.5 RoW
7 Competitive Landscape
7.1 Introduction
7.2 Competitive Benchmarking – Target Applications
7.3 New Product Developments
7.4 Acquisitions & Expansions
8 Company Profiles
8.1 Microchem
8.2 Supercolori S.P.A.
8.3 Bayer Material Science, Llc.
8.4 Teledyne Dalsa
8.5 Kolon Industry, Inc.
8.6 Heyo Enterprises Co., Ltd.
8.7 Chase Corporation
8.8 Sanyo Chemical Industries, Ltd.
8.9 ICB Pharma
8.10 Mikrocaps
8.11 Burgundy Gold Ltd.
8.12 Tagra Biotechnologies Ltd.
8.13 Inesfly Corporation
9 Appendix
9.1 Introducing Rt: Real-Time Market Intelligence
9.2 RT Snapshot 1: Value Chain
9.3 RT Snapshot 2: Market Dashboard
9.4 Available Customizations
9.5 Knowledge Store
9.6 Related Reports
List of Tables (28 Tables)
Table 1 Key Data Taken From Secondary Sources
Table 2 Key Data Taken From Primary Sources
Table 3 General Assumptions
Table 4 Year-Wise & Forecast Assumptions
Table 5 Polyurethane (PU) Microspheres Market, By Application, 2013 – 2020 ($ Million)
Table 6 PU Microspheres Market, By Application, 2013 – 2020 (KT)
Table 7 Polyurethane (PU) Microspheres Market in Encapsulation, By Geography, 2013 – 2020 ($ Million)
Table 8 PU Microspheres Market in Encapsulation, By Geography, 2013 – 2020 (KT)
Table 9 Polyurethane (PU) Microspheres Market in Paints & Coatings, By Geography, 2013 - 2020 ($ Million)
Table 10 PU Microspheres Market in Paints & Coatings, By Geography, 2013 - 2020 (KT)
Table 11 PU Microspheres Market in Adhesives, By Geography, 2013 - 2020 ($ Million)
Table 12 Polyurethane (PU) Microspheres Market in Adhesives, By Geography, 2013 - 2020 (KT)
Table 13 PU Microspheres Market in Cosmetic, By Geography, 2013 - 2020 ($ Million)
Table 14 PU Microspheres Market in Cosmetic, By Geography, 2013 - 2020 (KT)
Table 15 Polyurethane (PU) Microspheres Market in Other Applications, By Geography, 2013 - 2020 ($ Million)
Table 16 PU Microspheres Market in Other Applications, By Geography, 2013 - 2020 (KT)
Table 17 PU Microspheres Market, By Region, 2013 – 2020 ($ Million)
Table 18 Polyurethane (PU) Microspheres Market, By Region, 2013 – 2020 (KT)
Table 19 PU Microspheres Market for North America, By Application, 2013 – 2020 ($ Million)
Table 20 PU Microspheres Market for North America, By Application, 2013 – 2020 (KT)
Table 21 Polyurethane (PU) Microspheres Market for Europe, By Applications, 2014 ($ Million)
Table 22 PU Microspheres Market for Europe, By Applications, 2014 (KT)
Table 23 PU Microspheres Market for APAC, By Application, 2013 – 2020 ($ Million)
Table 24 Polyurethane (PU) Microspheres Market for APAC, By Application, 2013 – 2020 (KT)
Table 25 PU Microspheres Market for RoW, By Application, 2013 – 2020 ($ Million)
Table 26 PU Microspheres Market for RoW, By Application, 2013 – 2020 (KT)
Table 27 Polyurethane (PU) Microspheres Market : List of New Product Developments
Table 28 PU Microsphere Market : List of Acquistions & Expansions
List of Figures (28 Figures)
Figure 1 Participants’ Distribution in Primary Interviews and Surveys
Figure 2 Polyurethane (PU) Microspheres Microspheres Market, 2014 ($ Million)
Figure 3 PU Microspheres Applications Overview
Figure 4 Polyurethane (PU) Microspheres Market Dynamics
Figure 5 PU Microspheres Market Drivers : Impact Analysis
Figure 6 PU Microspheres Market Restraints : Impact Analysis
Figure 7 Polyurethane (PU) Microspheres Market : Value Chain Analysis
Figure 8 PU Microspheres Market : Value Chain Analysis
Figure 9 PU Microspheres Market : Value Chain Analysis
Figure 10 Polyurethane (PU) Microspheres Market in Encapsulation, By Geography, 2014 & 2020 ($ Million)
Figure 11 PU Microspheres Market in Paints & Coatings, By Geography, 2014 & 2020 ($ Million)
Figure 12 PU Microspheres Market in Adhesives, By Geography, 2014 & 2020 ($ Million)
Figure 13 Polyurethane (PU) Microspheres Market in Cosmetic, By Geography, 2014 & 2020 ($ Million)
Figure 14 PU Microspheres Market in Other Applications, By Geography, 2014 & 2020 ($ Million)
Figure 15 PU Microspheres Market in Other Applications, By Geography, 2014 & 2020 ($ Million)
Figure 16 Polyurethane (PU) Microspheres Market Analysis for North America, By Applications, 2013 – 2020 ($ Million)
Figure 17 PU Microspheres Market Analysis for U.S., By Applications, 2014 ($ Million)
Figure 18 PU Microspheres Market Analysis for Canada, By Applications, 2014 ($ Million)
Figure 19 Polyurethane (PU) Microspheres Market Analysis for Mexico, By Applications, 2014 ($ Million)
Figure 20 PU Microspheres Market Analysis for Europe, By Applications, 2013 – 2020 ($ Million)
Figure 21 PU Microspheres Market Analysis for Germany, By Applications, 2014 ($ Million)
Figure 22 Polyurethane (PU) Microspheres Market Analysis for Rest of Europe, By Applications, 2014 ($ Million)
Figure 23 PU Microspheres Market Analysis for APAC, By Applications, 2013 - 2020 ($ Million)
Figure 24 PU Microspheres Market Analysis for APAC, By Applications, 2013 - 2020 ($ Million)
Figure 25 Polyurethane (PU) Microspheres Market Analysis for Rest of APAC, 2013 – 2020 ($ Million)
Figure 26 PU Microspheres Market Analysis for Rest of World, By Applications, 2013 - 2020 ($ Million)
Figure 27 PU Microspheres Market Analysis for Middle East, By Applications, 2014 ($ Million)
Figure 28 Polyurethane (PU) Microspheres Market Analysis for South America, 2013 – 2020 ($ Million)


Growth opportunities and latent adjacency in Polyurethane (PU) Microspheres Market