Plastisols Market by Application (Coatings, Moldings, Screen Printing, Adhesives, Sealants), End-use Industry (Textile, Transportation, Construction, Metal Finishing, Defense, Recreational, Sports, Leisure, Toys), and Region - Global Forecast to 2022


[118 Pages Report] Plastisols Market size is estimated at USD 14.68 Billion in 2017 and is projected to reach USD 21.02 Billion by 2022, at a CAGR of 6.16% during the forecast period. In this report, 2016 is considered the base year and the forecast period is from 2017 to 2022.
The Objectives of this study are:
- To estimate and forecast the global plastisols market size in terms of volume and value
- To provide detailed information regarding the major factors (drivers, restraints, and opportunities) influencing the growth of the market
- To define, describe, and forecast the market size by application, namely, coatings; moldings; screen printing; and adhesives & sealants, among others
- To define, describe, and forecast the market size by end-use industry, namely, textile, transportation, construction, metal finishing, defense, and others
- To forecast the size of the market based on five major regions, namely, Asia Pacific, North America, Europe, Middle East & Africa, and South America
- To strategically analyze micromarkets with respect to individual growth trends, prospects, and their contribution to the overall market
- To analyze opportunities in the market for stakeholders and provide a competitive landscape of the market
- To track and analyze recent developments such as mergers & acquisitions, expansions, and new product developments in the market
- To strategically profile key market players and comprehensively analyze their core competencies
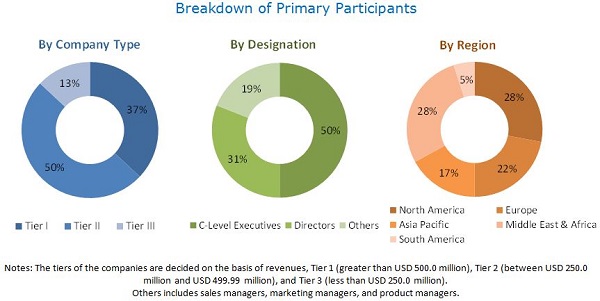
This research study involves extensive use of secondary sources, directories, and databases (such as Hoovers, Bloomberg BusinessWeek, and Factiva) to identify and collect information useful for this technical, market-oriented, and commercial study of the plastisols market. The primary sources mainly include several industry experts from core and related industries and preferred suppliers, manufacturers, distributors, service providers, and organizations related to all segments of the industry�s supply chain. After arriving at the overall market size, the total market has been split into several segments and subsegments. The figure below illustrates the breakdown of the primary interviews based on company type, designation, and region conducted during the research study.
To know about the assumptions considered for the study, download the pdf brochure
The global plastisols market is becoming increasingly competitive. There are many market participants, and some of these are market leaders. There are established players in the plastisols market such as PolyOne Corporation (US), Fujifilm Corporation (Japan) and International Coatings Company (US), among others. These top players have significant control over the market and retain their respective positions by launching new products and are undertaking substantial investments to comply with regulations to produce energy efficient and environment-friendly products. All these factors make the plastisols market highly competitive.
Target Audience:
- Plastisols Manufacturers
- Plastisols Dealers
- Plastisols Suppliers
- End Users, Raw Material Suppliers, and Others
Scope of the report
This report categorizes the global plastisols market based on application, end-use industry, and region.
Market Segmentation, By Application:
- Coatings
- Moldings
- Screen Printing
- Adhesives & Sealants
Market Segmentation, By End-use Industry:
- Textile
- Construction
- Transportation
- Metal Finishing
- Defense
- Others
- Toys
- Recreational/Sports/Leisure
Market Segmentation, By Region:
- Asia Pacific
- China
- Japan
- India
- South Korea
- Indonesia
- Thailand
- Malaysia
- Rest of Asia Pacific
- North America
- US
- Canada
- Mexico
- Europe
- Germany
- UK
- France
- Russia
- Spain
- Italy
- Rest of Europe
- South America
- Brazil
- Argentina
- Rest of South America
- Middle East & Africa
- Saudi Arabia
- Iran
- UAE
- South Africa
- Rest of Middle East & Africa
Available Customizations
With the given market data, MarketsandMarkets offers customizations according to the company�s specific needs. The following customization options are available for the report:
Product Analysis
- Product matrix that provides a detailed comparison of the product portfolio of each company
Regional Analysis
- Further breakdown of a region with respect to a particular country
Company Information
- Detailed analysis and profiles of additional market players (up to five)
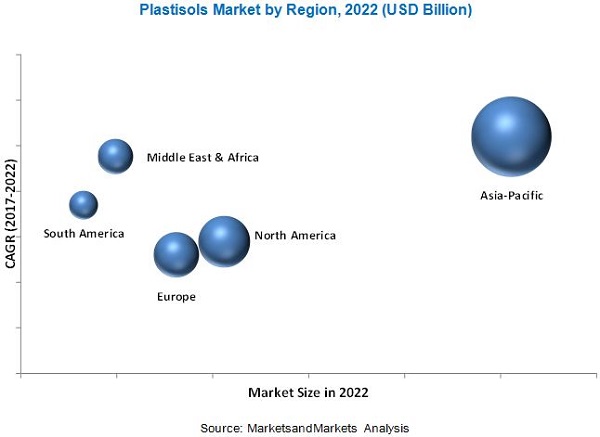
The plastisols market is projected to reach USD 21.02 Billion by 2022, at a CAGR of 6.16% from 2017 to 2022. The market is expected to witness high growth in several growing economies of Asia Pacific and Middle East & Africa owing to the increasing spending power, growth in the infrastructure industry, and growth in the manufacture of textiles and automobiles. Moreover, increasing populations and rising disposable incomes are also contributing significantly to the growth of the plastisols market in Asia Pacific.
The different applications of plastisols are coatings, moldings, screen printing, and adhesives & sealants. The coatings segment is the largest application in the plastisols market. Factors such as increasing quality standards in end-use industries, such as increasing fire safety regulations in the automotive and upholstery industries; increasing standards for protective clothing; high-performance requirements in the apparel industry; and growing demand for technical textiles are the key drivers for the plastisols market.
Based on end-use industry, the market is segmented into six major types, namely, textile, transportation, construction, metal finishing, defense, toys, and recreational/sports/leisure, among others. Textile industry is the largest market for plastisols in 2016, and will continue its dominance throughout the forecast period. Plastisols find applications in textile products such as industrial fabrics, apparels, personal protective equipment, home furnishing, footwear, laminated textile, and others. Plastisols are also widely used as textile printings inks in the textile industry.
Asia Pacific was the largest market for plastisols in 2016, globally. High consumption potential, growing production capacities, competitive manufacturing costs, and high economic growth are the major driving forces for the market in the region. Asia Pacific is characterized by technological innovations in various segments of the plastisols industry. Asia Pacific is also projected to register the highest growth in the plastisols market. The high growth in the region is expected to be backed by the increasing demand from the textile and transportation industries, coupled with the rising awareness about environment-friendly products. Moreover, the growth of the automobile industry is expected to lead to a surge in the demand for plastisols in the transportation segment. In addition, major global players are establishing export-oriented facilities in the Asia Pacific region, which is thus expected to further lead to an increasing demand for plastisols.
Toxic nature of PVC and phthalates is considered as the major restraint for the plastisols market growth. The growth of digital screen printing application is expected to act as an opportunity for the stakeholders in the plastisols market. Developments in the market, including new product launches are expected to help the growth of the market. Leading plastisol manufacturers have opted for the new product launch strategy to sustain their market positions. Manufacturers are undertaking investments to increase their production capacities of plastisols to introduce new products. The global plastisols market has a large number of market players; however, the market is led by some major players, such as PolyOne Corporation (US), Fujifilm Corporation (Japan), International Coatings Company (US), Huber Group (Germany), U.S. Plastic Coatings Corporation (US), Carlisle Plastics Company (US), Lancer Group International (Canada), Chemionics Corporation (US), Rutland Plastic Technologies (US), and Polyblend UK Ltd (UK), among others.
To speak to our analyst for a discussion on the above findings, click Speak to Analyst
 Exclusive indicates content/data unique to MarketsandMarkets and not available with any competitors.
Table of Contents
1 Introduction (Page No. - 13)
1.1 Objectives of the Study
1.2 Market Definition
1.3 Scope of the Market
1.3.1 Years Considered for the Study
1.4 Currency
1.5 Unit Considered
1.6 Limitations
1.7 Stakeholders
2 Research Methodology (Page No. - 16)
2.1 Research Data
2.1.1 Secondary Data
2.1.1.1 Key Data From Secondary Sources
2.1.2 Primary Data
2.1.2.1 Key Data From Primary Sources
2.1.2.2 Key Industry Insights
2.1.2.3 Breakdown of Primary Interviews
2.2 Market Size Estimation
2.3 Data Triangulation
2.4 Assumptions
3 Executive Summary (Page No. - 24)
4 Premium Insights (Page No. - 27)
4.1 Attractive Opportunities in Plastisols Market
4.2 Plastisols Market Growth, By Region
4.3 APAC Plastisols Market, By Country and End-Use Industry
4.4 Plastisols Market, By Region and End-Use Industry
4.5 Leading Countries in the Plastisols Market
5 Market Overview (Page No. - 30)
5.1 Introduction
5.2 Market Dynamics
5.2.1 Drivers
5.2.1.1 Growth in End-Use Industries
5.2.2 Restraints
5.2.2.1 Toxic Nature of Pvc and Phthalates
5.2.3 Opportunities
5.2.3.1 Emerging Adoption of Digital Screen Printing in Textile Industry
5.3 Porter�s Five Forces Analysis
5.3.1 Bargaining Power of Suppliers
5.3.2 Bargaining Power of Buyers
5.3.3 Threat of New Entrants
5.3.4 Threat of Substitutes
5.3.5 Intensity of Competitive Rivalry
5.4 Macro Economic Indicators
5.4.1 Automotive Industry
5.4.2 Manufacturing Industry
5.4.3 Construction Industry
6 Plastisols Market, By Application (Page No. - 41)
6.1 Introduction
6.2 Coatings
6.3 Moldings
6.4 Screen Printing
6.5 Adhesives & Sealants
7 Plastisols Market, By End-Use Industry (Page No. - 47)
7.1 Introduction
7.2 Textiles
7.3 Construction
7.4 Transportation
7.5 Metal Finishing
7.6 Defense
7.7 Others
8 Plastisols Market, By Region (Page No. - 55)
8.1 Introduction
8.2 APAC
8.2.1 By Application
8.2.2 By End-Use Industry
8.2.3 By Country
8.2.3.1 China
8.2.3.2 India
8.2.3.3 Japan
8.2.3.4 South Korea
8.2.3.5 Indonesia
8.2.3.6 Thailand
8.2.3.7 Malaysia
8.2.3.8 Rest of APAC
8.3 North America
8.3.1 By Application
8.3.2 By End-Use Industry
8.3.3 By Country
8.3.3.1 US
8.3.3.2 Mexico
8.3.3.3 Canada
8.4 Europe
8.4.1 By Application
8.4.2 By End-Use Industry
8.4.3 By Country
8.4.3.1 Germany
8.4.3.2 UK
8.4.3.3 France
8.4.3.4 Russia
8.4.3.5 Spain
8.4.3.6 Italy
8.4.3.7 Rest of Europe
8.5 Middle East & Africa
8.5.1 By Application
8.5.2 By End-Use Industry
8.5.3 By Country
8.5.3.1 Saudi Arabia
8.5.3.2 Iran
8.5.3.3 UAE
8.5.3.4 South Africa
8.5.3.5 Rest of Middle East & Africa
8.6 South America
8.6.1 By Application
8.6.2 By End-Use Industry
8.6.3 By Country
8.6.3.1 Brazil
8.6.3.2 Argentina
8.6.3.3 Rest of South America
9 Competitive Landscape (Page No. - 98)
9.1 Overview
9.2 Market Ranking of Key Players
9.3 Competitive Scenario
9.3.1 New Product Launch
10 Company Profiles (Page No. - 100)
Business Overview, Products Offered, Recent Developments, SWOT Analysis, MnM View
10.1 Polyone Corporation
10.2 Fujifilm Corporation
10.3 International Coatings Company (ICC)
10.4 Huber Group
*Details Might Not Be Captured in Case of Unlisted Companies.
10.5 Other Key Players
10.5.1 U.S. Plastic Coatings
10.5.2 Carlisle Plastics Company
10.5.3 Lancer Group International
10.5.4 Chemionics
10.5.5 Rutland Plastic Technologies
10.5.6 Polyblend
10.5.7 Campbell Plastics
10.5.8 Polysol Polymers
10.5.9 Princeton Keynes Group
10.5.10 Sushee Coatings
10.5.11 Special Coatings (SCL)
10.5.12 Dynachrom Ink Technologies
10.5.13 Wright Coatings Technologies
10.5.14 Rack Coating Service
10.5.15 Progressive Coatings
10.5.16 Indian Dyes Sales
10.5.17 Patcham
10.5.18 Vynaflex Plastisol Compounds
10.5.19 Vita Liquid Polymers
10.5.20 Turan Kimya
10.5.21 Mas-Tin
11 Appendix (Page No. - 110)
11.1 Discussion Guide
11.2 Knowledge Store: Marketsandmarkets� Subscription Portal
11.3 Introducing RT: Real-Time Market Intelligence
11.4 Available Customizations
11.5 Related Reports
11.6 Author Details
List of Tables (110 Tables)
Table 1 Global Apparel Market Size By Country, 2015 and 2025 (USD Billion)
Table 2 Market Size, By Application, 2015�2022 (Kiloton)
Table 3 Market Size, By Application, 2015�2022 (USD Million)
Table 4 Market Size in Coatings, By Region, 2015�2022 (Kiloton)
Table 5 Market Size in Coatings, By Region, 2015�2022 (USD Million)
Table 6 Market Size in Moldings, By Region, 2015�2022 (Kiloton)
Table 7 Market Size in Moldings, By Region, 2015�2022 (USD Million)
Table 8 Market Size in Screen Printing, By Region, 2015�2022 (Kiloton)
Table 9 Market Size in Screen Printing, By Region, 2015�2022 (USD Million)
Table 10 Market Size in Adhesives & Sealants, By Region, 2015�2022 (Kiloton)
Table 11 Market Size in Adhesives & Sealants, By Region, 2015�2022 (USD Million)
Table 12 Market Size, By End-Use Industry, 2015�2022 (Kiloton)
Table 13 Market Size, By End-Use Industry, 2015�2022 (USD Million)
Table 14 Market Size in Textiles, By Region, 2015�2022 (Kiloton)
Table 15 Market Size in Textiles, By Region, 2015�2022 (USD Million)
Table 16 Market Size in Construction, By Region, 2015�2022 (Kiloton)
Table 17 Market Size in Construction, By Region, 2015�2022 (USD Million)
Table 18 Market Size in Transportation, By Region, 2015�2022 (Kiloton)
Table 19 Market Size in Transportation, By Region, 2015�2022 (USD Million)
Table 20 Market Size in Metal Finishing, By Region, 2015�2022 (Kiloton)
Table 21 Market Size in Metal Finishing, By Region, 2015�2022 (USD Million)
Table 22 Market Size in Defense, By Region, 2015�2022 (Kiloton)
Table 23 Market Size in Defense, By Region, 2015�2022 (USD Million)
Table 24 Market Size in Others End-Use Industries, By Region, 2015�2022 (Kiloton)
Table 25 Market Size in Others End-Use Industries, By Region, 2015�2022 (USD Million)
Table 26 Market Size, By Region, 2015�2022 (Kiloton)
Table 27 Market Size, By Region, 2015�2022 (USD Million)
Table 28 APAC: Market Size, By Application, 2015�2022 (Kiloton)
Table 29 APAC: Market Size, By Application, 2015�2022 (USD Million)
Table 30 APAC: Market Size, By End-Use Industry, 2015�2022 (Kiloton)
Table 31 APAC: Market Size, By End-Use Industry, 2015�2022 (USD Million)
Table 32 APAC: Market Size, By Country, 2015�2022 (Kiloton)
Table 33 APAC: Market Size, By Country, 2015�2022 (USD Million)
Table 34 China: Market Size, By End-Use Industry, 2015�2022 (Kiloton)
Table 35 China: Market Size, By End-Use Industry, 2015�2022 (USD Million)
Table 36 India: Market Size, By End-Use Industry, 2015�2022 (Kiloton)
Table 37 India: Market Size, By End-Use Industry, 2015�2022 (USD Million)
Table 38 Japan: Market Size, By End-Use Industry, 2015�2022 (Kiloton)
Table 39 Japan: Market Size, By End-Use Industry, 2015�2022 (USD Million)
Table 40 South Korea: Market Size, By End-Use Industry, 2015�2022 (Kiloton)
Table 41 South Korea: Market Size, By End-Use Industry, 2015�2022 (USD Million)
Table 42 Indonesia: Market Size, By End-Use Industry, 2015�2022 (Kiloton)
Table 43 Indonesia: Market Size, By End-Use Industry, 2015�2022 (USD Million)
Table 44 Thailand: Market Size, By End-Use Industry, 2015�2022 (Kiloton)
Table 45 Thailand: Market Size, By End-Use Industry, 2015�2022 (USD Million)
Table 46 Malaysia: Market Size, By End-Use Industry, 2015�2022 (Kiloton)
Table 47 Malaysia: Market Size, By End-Use Industry, 2015�2022 (USD Million)
Table 48 Rest of APAC: Market Size, By End-Use Industry, 2015�2022 (Kiloton)
Table 49 Rest of APAC: Market Size, By End-Use Industry, 2015�2022 (USD Million)
Table 50 North America: Market Size, By Application, 2015�2022 (Kiloton)
Table 51 North America: Market Size, By Application, 2015�2022 (USD Million)
Table 52 North America: Market Size, By End-Use Industry, 2015�2022 (Kiloton)
Table 53 North America: Market Size, By End-Use Industry, 2015�2022 (USD Million)
Table 54 North America: Market Size, By Country, 2015�2022 (Kiloton)
Table 55 North America: Market Size, By Country, 2015�2022 (USD Million)
Table 56 US: Market Size, By End-Use Industry, 2015�2022 (Kiloton)
Table 57 US: Market Size, By End-Use Industry, 2015�2022 (USD Million)
Table 58 Mexico: Market Size, By End-Use Industry, 2015�2022 (Kiloton)
Table 59 Mexico: Market Size, By End-Use Industry, 2015�2022 (USD Million)
Table 60 Canada: Market Size, By End-Use Industry, 2015�2022 (Kiloton)
Table 61 Canada: Market Size, By End-Use Industry, 2015�2022 (USD Million)
Table 62 Europe: Market Size, By Application, 2015�2022 (Kiloton)
Table 63 Europe: Market Size, By Application, 2015�2022 (USD Million)
Table 64 Europe: Market Size, By End-Use Industry, 2015�2022 (Kiloton)
Table 65 Europe: Market Size, By End-Use Industry, 2015�2022 (USD Million)
Table 66 Europe: Market Size, By Country, 2015�2022 (Kiloton)
Table 67 Europe: Market Size, By Country, 2015�2022 (USD Million)
Table 68 Germany: Market Size, By End-Use Industry, 2015�2022 (Kiloton)
Table 69 Germany: Market Size, By End-Use Industry, 2015�2022 (USD Million)
Table 70 UK: Market Size, By End-Use Industry, 2015�2022 (Kiloton)
Table 71 UK: Market Size, By End-Use Industry, 2015�2022 (USD Million)
Table 72 France: Market Size, By End-Use Industry, 2015�2022 (Kiloton)
Table 73 France: Market Size, By End-Use Industry, 2015�2022 (USD Million)
Table 74 Russia: Market Size, By End-Use Industry, 2015�2022 (Kiloton)
Table 75 Russia: Market Size, By End-Use Industry, 2015�2022 (USD Million)
Table 76 Spain: Market Size, By End-Use Industry, 2015�2022 (Kiloton)
Table 77 Spain: Market Size, By End-Use Industry, 2015�2022 (USD Million)
Table 78 Italy: Market Size, By End-Use Industry, 2015�2022 (Kiloton)
Table 79 Italy: Market Size, By End-Use Industry, 2015�2022 (USD Million)
Table 80 Rest of Europe: Market Size, By End-Use Industry, 2015�2022 (Kiloton)
Table 81 Rest of Europe: Market Size, By End-Use Industry, 2015�2022 (USD Million)
Table 82 Middle East & Africa: Market Size, By Application, 2015�2022 (Kiloton)
Table 83 Middle East & Africa: Market Size, By Application, 2015�2022 (USD Million)
Table 84 Middle East & Africa Market Size, By End-Use Industry, 2015�2022 (Kiloton)
Table 85 Middle East & Africa: Market Size, By End-Use Industry, 2015�2022 (USD Million)
Table 86 Middle East & Africa: Market Size, By Country, 2015�2022 (Kiloton)
Table 87 Middle East & Africa: Market Size, By Country, 2015�2022 (USD Million)
Table 88 Saudi Arabia: Market Size, By End-Use Industry, 2015�2022 (Kiloton)
Table 89 Saudi Arabia: Market Size, By End-Use Industry, 2015�2022 (USD Million)
Table 90 Iran: Market Size, By End-Use Industry, 2015�2022 (Kiloton)
Table 91 Iran: Market Size, By End-Use Industry, 2015�2022 (USD Million)
Table 92 UAE: Market Size, By End-Use Industry, 2015�2022 (Kiloton)
Table 93 UAE: Market Size, By End-Use Industry, 2015�2022 (USD Million)
Table 94 South Africa: Market Size, By End-Use Industry, 2015�2022 (Kiloton)
Table 95 South Africa: Market Size, By End-Use Industry, 2015�2022 (USD Million)
Table 96 Rest of Middle East & Africa: Market Size, By End-Use Industry, 2015�2022 (Kiloton)
Table 97 Rest of Middle East & Africa: Market Size, By End-Use Industry, 2015�2022 (USD Million)
Table 98 South America: Market Size, By Application, 2015�2022 (Kiloton)
Table 99 South America: Market Size, By Application, 2015�2022 (USD Million)
Table 100 South America: Market Size, By End-Use Industry, 2015�2022 (Kiloton)
Table 101 South America: Market Size, By End-Use Industry, 2015�2022 (USD Million)
Table 102 South America: Market Size, By Country, 2015�2022 (Kiloton)
Table 103 South America: Market Size, By Country, 2015�2022 (USD Million)
Table 104 Brazil: Market Size, By End-Use Industry, 2015�2022 (Kiloton)
Table 105 Brazil: Market Size, By End-Use Industry, 2015�2022 (USD Million)
Table 106 Argentina: Market Size, By End-Use Industry, 2015�2022 (Kiloton)
Table 107 Argentina: Market Size, By End-Use Industry, 2015�2022 (USD Million)
Table 108 Rest of South America: Market Size, By End-Use Industry, 2015�2022 (Kiloton)
Table 109 Rest of South America: Market Size, By End-Use Industry, 2015�2022 (USD Million)
Table 110 New Product Launch, 2009�2017
List of Figures (23 Figures)
Figure 1 Plastisols Market: Research Design
Figure 2 Market Size Estimation: Bottom-Up Approach
Figure 3 Market Size Estimation: Top-Down Approach
Figure 4 Plastisols Market: Data Triangulation
Figure 5 Plastisols Market to Witness Fastest-Growth in Screen Printing Application During Forecast Period
Figure 6 Textile End-Use Industry to Dominate the Market Throughout Forecast Period
Figure 7 APAC is Largest and Fastest-Growing Market for Plastisols
Figure 8 Increasing Demand From Textile Industry Driving the Market
Figure 9 APAC Projected to Be Fastest-Growing Market During Forecast Period
Figure 10 China Accounts for the Largest Share in APAC Plastisols Market in 2017
Figure 11 Textile End-Use Industry to Dominate the Global Plastisols Market
Figure 12 India to Be Fastest-Growing Market for Plastisols
Figure 13 Military Spending of Major Countries, 2006 vs 2016
Figure 14 Global Militarization Index, By Country, 2016
Figure 15 Porter�s Five Forces Analysis
Figure 16 Automotive Production, By Country (USD Billion), 2015�2016
Figure 17 Trends and Forecast of Manufacturing Sector, By Country, 2017-2022 (USD Billion)
Figure 18 Trends and Forecast of Construction Industry, By Country, 2017�2022 (USD Billion)
Figure 19 APAC Expected to Be Fastest-Growing Market During Forecast Period
Figure 20 North America: Snapshot
Figure 21 Market Ranking of Key Players, 2016
Figure 22 Polyone Corporation: Company Snapshot
Figure 23 Fujifilm Corporation: Company Snapshot


Growth opportunities and latent adjacency in Plastisols Market