Plant Phenotyping Market

Plant Phenotyping Market by Product (Equipment (Site, Platform/Carrier, Application, Analysis Systems, Automation Level), Sensors (Image Sensors, NDVI Sensors, Temperature Sensors), and Software), Service, and Region - Global Forecast to 2027

Report Code: AGI 6566 Dec, 2022, by marketsandmarkets.com

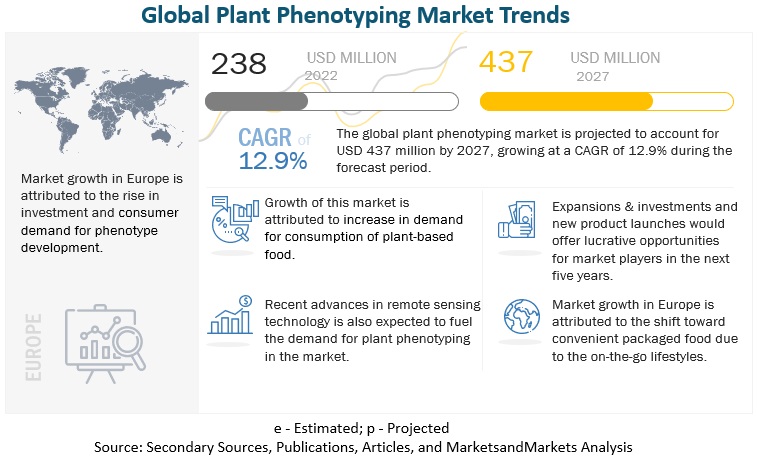
The global plant phenotyping market in terms of revenue was estimated to be worth $238 million in 2022 and is poised to reach $437 million by 2027, growing at a CAGR of 12.9% from 2022 to 2027.

The plant phenotyping market is a rapidly growing industry that is driven by the increasing demand for food security and crop improvement. Plant phenotyping technologies such as high-throughput phenotyping, imaging, and sensor-based systems are being used to improve crop yields and quality, as well as to develop new crop varieties that are more resistant to pests and diseases. This market is also driven by advances in technologies such as artificial intelligence, machine learning, and big data analytics, which are enabling the development of more sophisticated and efficient plant phenotyping systems. Plant phenotyping is the process of measuring and describing various physical and physiological characteristics of plants, such as their shape, size, color, and structural compounds. These characteristics make up the plant's phenome, which is the sum of all its phenotypic properties. The goal of plant phenotyping is to quantify these properties in a precise and objective manner.
Plant Phenotyping Market

To know about the assumptions considered for the study, Request for Free Sample Report

Impact of Covid-19

The COVID-19 pandemic has had a historical impact on businesses across various industries in a short time, including the food and beverage supply chain. The biggest misconception about COVID-19 is that empty grocery shelves are an indicator that there is a shortage of food due to the recent runs on grocery stores, which have created these short-term disruptions as the supply chain works to catch up and replenish.

The pandemic will have both positive and negative impacts on the overall plant phenotyping market. The sales of plant-based foods have increased as consumers rush to stock their pantries. It is expected that the COVID-19 pandemic will increase the consumption of processed foods and other shelf-stable foods that have a longer shelf-life. Furthermore, with the shutdown of various foodservice outlets and restaurants across the globe due to nationwide lockdown, consumers are compelled to cook at home. Hence, consumers stockpile food products that can be easily cooked and opt for ready-to-eat foods with longer shelf life.

Plant Phenotyping Market Dynamics

Drivers: Growing importance of sustainable crop production using improved crop varieties

Plant-based products are facing challenges due to the increasing requirement for food, feed, and raw material. Therefore, it is necessary to integrate approaches across all scales—from the molecular level to field applications—to develop sustainable plant production with higher crop yield and using limited resources. Plant breeders use a wide range of plant defense and resistance mechanisms developed by plants over millions of years of co-evolution with harmful organisms.

The use of new high-yielding plant varieties that are able to adapt to changing climatic conditions and require less use of pesticides can help in mitigating the gap in the food supply. Improved crop varieties can be achieved through phenotype- and genome-based breeding. Plant phenotyping links genomics with plant physiology and agronomy.

Restraints: Low adoption in emerging economies due to limited funding and less presence of key players

Plant phenotyping networks such as APPN and China Plant Phenotyping Network are established in these countries to increase the visibility and impact of plant phenotyping and enable cooperation Though the EPPN is aiming to establish plant phenotyping networks in different countries outside Europe to increase research for the advancement of plant phenotyping systems, there is less adoption in emerging economies such as Japan, India, South Korea, and countries in Sub-Saharan Africa and the Middle East.

Additionally, the presence of key players offering plant phenotyping equipment and services is low in these countries. Hence, the awareness regarding the benefits of plant phenotyping is less among plant breeders. However, in 2021, conferences focusing on plant phenotyping were organized in countries such as China and Australia.

Opportunities: Attractive opportunities for field-based phenotyping using remote sensing tools

Field-based phenotyping is considered an important component of crop improvement. With the development of automatic and multifunctional platforms for high-throughput field-based phenotyping, such as unmanned ground vehicles (UGVs), cable-suspended vehicles (CSVs), and unmanned aerial vehicles (UAVs), the bottleneck of plant phenotyping would be relaxed to provide plant scientists with a new insight into all aspects of living plants.

Advancements in remote sensing techniques of field-based phenotypes would help in finding relevant solutions for major problems that limit crop production. In regions such as North America, Europe, and Asia Pacific (especially Australia), there would be high demand for remote-sensing tools for field-based phenotyping due to less availability of manpower

Challenges: High cost associated with plant phenotyping

The cost of plant phenotyping equipment depends on factors such as the degree of automation, throughput, size, and the number of sensors. Also, it depends on the plant phenotyping market for phenotyping instruments and the number of suppliers present in the market. A major concern for users regarding plant phenotyping systems has been the cost, which is relatively higher than genotyping.

Although many market players have entered this industry in the last few decades to offer various plant phenotyping equipment and services, constant R&D is required to sustain in the market and to ascertain plant phenotyping as an established method in plant breeding research.

Key Region Trends
Plant Phenotyping Market Size, and Share

To know about the assumptions considered for the study, download the pdf brochure

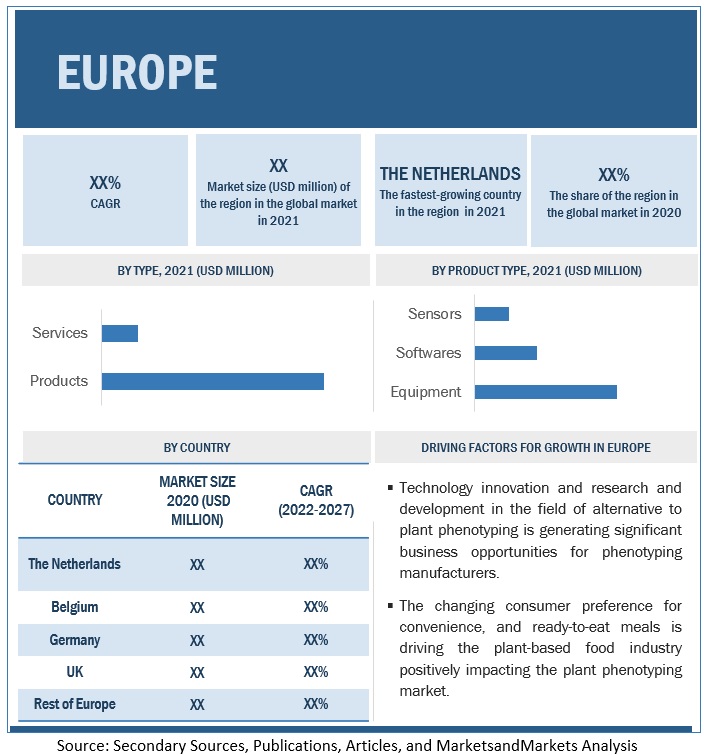
Europe dominated the plant phenotyping market, with a value of USD 81 million in 2021; it is projected to reach USD 162 million by 2027, at a CAGR of 12.6% during the forecast period.

Today Europe is the world’s leading producer of plant phenotyping, with European plant phenotyping being exported to all corners of the globe. Europe accounted for a plant phenotyping market share of 38.8.2% in the global market, in 2021. The Europe plant phenotyping industry has a range of products, ranging from native to modified services. The versatility of phenotyping products enables their application as functional ingredients in the food, non-food, and feed industries.

In terms of the end-use application industry, there is no stand-out trend. However, the food industry is projected to witness the fastest growth with the newer variations of plant phenotyping, new products, and a range of applications.

Key Market Players

The key players in plant phenotyping market include LemnaTec (Germany), Delta-T Devices (UK), Heinz Walz (Germany), Phenospex (Netherlands), KeyGene (Netherlands), Phenomix (France), Qubit Phenomics (Canada), Photon Systems Instruments (Czech Republic), and Rothamsted Research Limited (UK).

Want to explore hidden markets that can drive new revenue in Plant Phenotyping Market?

Scope of the Report

Report Metrics

Details

Market size value in 2022 USD 238 milloin
Market size value in 2027 USD 437 milloin
Market growth rate CAGR 12.9%
Market size estimation 2022–2027
Base year considered 2021
Forecast period considered 2022–2027
Units considered Value (USD)
Segments covered By Type and Region
Regions covered North America, Asia Pacific, Europe, and Rest of the World
Companies studied
  • LemnaTec (Germany)
  • Delta-T Devices (UK)
  • Heinz Walz (Germany)
  • Phenospex (Netherlands)
  • KeyGene (Netherlands)
  • Phenomix (France)
  • CropDesign (Belgium)
  • Quibit Phenomics (Canada)
  • Photon System Republic (Czech Republic)
  • WPS (The Netherlands)
  • Flanders Institute for Biotechnology (VIB) (Belgium)
  • Rothamstad Research Limited (UK)
  • VBCF (Austria)
  • MaxWell Biosystems AG (Switzerland)
  • Plant-DiTech LTD (Israel)
  • Hiphen (France)
  • Terramera (Canada)
  • Seed-X (U.S.)
  • BioVox (U.S.)
  • Agrela Ecosystems (U.S.)
  • Gardin (UK)
  • Petiole LTD (UK)
  • Pheno-Inspect GmbH (Germany)
  • Agri-EPI Centre Ltd (UK)
  • PhenoKey BV (The Netherlands)

This research report categorizes the plant phenotyping market, based on type and region

Target Audience:

  • Plant phenotyping raw material suppliers
  • Plant phenotyping manufacturers
  • Intermediate suppliers, such as traders and distributors of plant phenotyping
  • Government and research organizations
  • Associations, regulatory bodies, and other industry-related bodies:
    • Starch Europe
    • World Health Organization (WHO)
    • Food Industry Association of Austria (FIAA)
    • International Federation of Starch Associations (IFSA)
    • NISAD Starch Industrialists Association
    • United States Department of Agriculture (USDA)
    • Association of Enterprises of Deep Processing of Grains

Report Scope:

Plant Phenotyping Market:

By Type
  • Product
    • Equipment
    • Software
    • Sensor
  • Services
By Region:
  • North America
  • Europe
  • Asia Pacific
  • Rest of the World (RoW)

Recent Developments

  • In March 2022, Royal Van Zanten and KeyGene started a partnership to accelerate the breeding of ornamental crops
  • In March 2019, Chlorophyll fluorescence developer Heinz Walz GmbH (Germany), and phenotyping specialist, LemnaTec GmbH (Germany) facilitated physiological measurements in plant phenotyping. By integrating a Walz IMAGING PAM camera into the LemnaTec Phenocenter, chlorophyll fluorescence measurements would be enabled as part of an automated plant phenotyping procedure.
  • In August 2019, Nynomic acquired the business operation of LemnaTec GmbH. The strategic acquisition would strengthen the technological competence of Nyomic in the field of plant phenotyping.

Frequently Asked Questions (FAQ):

To speak to our analyst for a discussion on the above findings, click Speak to Analyst

Exclusive indicates content/data unique to MarketsandMarkets and not available with any competitors.

TABLE OF CONTENTS
 
1 INTRODUCTION (Page No. - 22)
    1.1 STUDY OBJECTIVES 
    1.2 MARKET DEFINITION 
    1.3 STUDY SCOPE 
           FIGURE 1 MARKET SEGMENTATION
           FIGURE 2 EQUIPMENT MARKET SEGMENTATION
    1.4 REGIONS COVERED 
    1.5 YEARS CONSIDERED 
    1.6 CURRENCY 
           TABLE 1 USD EXCHANGE RATES CONSIDERED
    1.7 UNIT 
    1.8 STAKEHOLDERS 
    1.9 SUMMARY OF CHANGES 
 
2 RESEARCH METHODOLOGY (Page No. - 27)
    2.1 RESEARCH DATA 
           2.1.1 SECONDARY DATA
                    2.1.1.1 Key data from secondary sources
           2.1.2 PRIMARY DATA
                    2.1.2.1 Key data from primary sources
                    2.1.2.2 Key industry insights
                    2.1.2.3 Breakdown of primary interviews
                               FIGURE 4 BREAKDOWN OF PRIMARY INTERVIEWS: BY COMPANY, DESIGNATION,  AND REGION
    2.2 FACTOR ANALYSIS 
           2.2.1 INTRODUCTION
           2.2.2 DEMAND-SIDE ANALYSIS
           2.2.3 SUPPLY-SIDE ANALYSIS
           2.2.4 MARKET SIZE ESTIMATION
           2.2.5 BOTTOM-UP APPROACH
           2.2.6 APPROACH ONE (BASED ON PRODUCT, BY REGION)
           2.2.7 APPROACH TWO (BASED ON GLOBAL MARKET)
    2.3 DATA TRIANGULATION 
           FIGURE 5 DATA TRIANGULATION METHODOLOGY
    2.4 ASSUMPTIONS 
    2.5 LIMITATIONS 
 
3 EXECUTIVE SUMMARY (Page No. - 37)
    FIGURE 6 PLANT PHENOTYPING MARKET, BY PRODUCT, 2022 VS. 2027 (USD MILLION) 
    FIGURE 7 MARKET FOR PLANT PHENOTYPING, BY SOFTWARE, 2022 VS. 2027 (USD MILLION) 
    FIGURE 8 MARKET FOR PLANT PHENOTYPING, BY SENSOR, 2022 VS. 2027 (USD MILLION) 
    FIGURE 9 REGIONAL SNAPSHOT OF PLANT PHENOTYPING MARKET 
 
4 PREMIUM INSIGHTS (Page No. - 41)
    4.1 ATTRACTIVE OPPORTUNITIES IN PLANT PHENOTYPING MARKET 
           FIGURE 10 ADVANCEMENTS IN APPLICATION OF IMAGING SENSORS TO DRIVE MARKET
    4.2 EUROPE: MARKET FOR PLANT PHENOTYPING,  BY TYPE AND COUNTRY (2022) 
           FIGURE 11 PRODUCTS SEGMENT TO DOMINATE EUROPEAN PLANT PHENOTYPING MARKET IN 2022
    4.3 PLANT PHENOTYPING MARKET, BY TYPE,  2022 VS. 2027 (USD MILLION) 
           FIGURE 12 PRODUCTS SEGMENT WILL CONTINUE TO DOMINATE MARKET IN 2027
    4.4 MARKET FOR PLANT PHENOTYPING, BY PRODUCT,  2022 VS. 2027 (USD MILLION) 
           FIGURE 13 EQUIPMENT SEGMENT TO DOMINATE PLANT PHENOTYPING PRODUCTS MARKET IN 2022
    4.5 MARKET FOR PLANT PHENOTYPING, BY SERVICE,  2022 VS. 2027 (USD MILLION) 
           FIGURE 14 MEASUREMENT ACQUISITION AND DATA ANALYSIS SEGMENT WILL CONTINUE TO DOMINATE PLANT PHENOTYPING SERVICES MARKET IN 2027
    4.6 PLANT PHENOTYPING MARKET SHARE,  BY TYPE AND REGION, 2022 VS. 2027 
           FIGURE 15 EUROPE TO DOMINATE THE MARKET FOR ALL TYPES
 
5 MARKET OVERVIEW (Page No. - 45)
    5.1 INTRODUCTION 
    5.2 MACROECONOMIC INDICATORS 
           5.2.1 UNPREDICTABLE CHANGE IN CLIMATE CONDITIONS
                    FIGURE 16 FLUCTUATION IN GLOBAL TEMPERATURE IMPACTS CROP GROWTH AND YIELD
           5.2.2 HIGHER FOOD DEMAND TO MEET POPULATION BOOM
                    FIGURE 17 INCREASING TREND IN GLOBAL POPULATION
    5.3 MARKET DYNAMICS 
           FIGURE 18 PLANT PHENOTYPING MARKET: DRIVERS, RESTRAINTS, OPPORTUNITIES,  AND CHALLENGES
           5.3.1 DRIVERS
                    5.3.1.1 Automation and significant advancements in application of imaging sensors for high-throughput data collection
                               TABLE 2 COMPARISON OF DIFFERENT IMAGING TECHNIQUES IN PLANT PHENOTYPING
                    5.3.1.2 Growing importance of sustainable crop production using improved crop varieties
                    5.3.1.3 Increasing expansions and investments for plant phenotyping in developed regions
           5.3.2 RESTRAINTS
                    5.3.2.1 Lack of technical and conceptual awareness
                    5.3.2.2 Low adoption in emerging economies due to limited funding and low presence of key players
           5.3.3 OPPORTUNITIES
                    5.3.3.1 Attractive opportunities for field-based phenotyping using remote sensing tools
                    5.3.3.2 Significant importance toward development of research associations in emerging economies
           5.3.4 CHALLENGES
                    5.3.4.1 High cost associated with plant phenotyping
                    5.3.4.2 Challenges associated with implementation of plant phenotyping at multiple organizational scales
 
6 INDUSTRY TRENDS (Page No. - 53)
    6.1 INTRODUCTION 
    6.2 TRENDS/DISRUPTIONS IMPACTING CUSTOMER BUSINESS 
           FIGURE 19 PLANT PHENOTYPING MARKET:  TRENDS/DISRUPTIONS IMPACTING CUSTOMER BUSINESS
    6.3 VALUE CHAIN 
           6.3.1 RESEARCH AND DEVELOPMENT
           6.3.2 SOURCING OF RAW MATERIALS
           6.3.3 PRODUCTION AND PROCESSING
           6.3.4 DISTRIBUTION, MARKETING, AND SALES
                    FIGURE 20 PLANT PHENOTYPING MARKET: VALUE CHAIN
    6.4 TECHNOLOGY ANALYSIS 
    6.5 PATENT ANALYSIS 
           TABLE 3 KEY PATENTS PERTAINING TO PLANT PHENOTYPING, 2018–2022
    6.6 ECOSYSTEM MAP AND SUPPLY CHAIN 
           6.6.1 PLANT PHENOTYPING: ECOSYSTEM MARKET MAP
                    FIGURE 21 PLANT PHENOTYPING MARKET: SUPPLY CHAIN
                    FIGURE 22 ECOSYSTEM VIEW
    6.7 PORTER’S FIVE FORCES ANALYSIS 
           TABLE 4 PLANT PHENOTYPING MARKET: PORTER’S FIVE FORCES ANALYSIS
           6.7.1 THREAT OF NEW ENTRANTS
           6.7.2 THREAT OF SUBSTITUTES
           6.7.3 BARGAINING POWER OF SUPPLIERS
           6.7.4 BARGAINING POWER OF BUYERS
           6.7.5 INTENSITY OF COMPETITIVE RIVALRY
    6.8 TRADE ANALYSIS 
           6.8.1 ANIMAL OR VEGETABLE FERTILIZERS, WHETHER OR NOT MIXED OR CHEMICALLY TREATED
                    TABLE 5 TOP 10 EXPORTERS AND IMPORTERS OF POULTRY MEAT, 2021 (USD THOUSAND)
    6.9 CASE STUDIES 
           6.9.1 PRESENT AND FUTURE OF PLANT PHENOTYPING APPROACHES IN BIOSTIMULANT RESEARCH AND DEVELOPMENT
    6.10 REGULATORY FRAMEWORK 
           6.10.1 REGULATORY BODIES, GOVERNMENT AGENCIES, AND OTHER ORGANIZATIONS
                    6.10.1.1 North America
                    6.10.1.2 Europe
                    6.10.1.3 Asia Pacific
    6.11 KEY STAKEHOLDERS AND BUYING CRITERIA 
           6.11.1 KEY STAKEHOLDERS IN BUYING PROCESS
                    FIGURE 23 INFLUENCE OF STAKEHOLDERS ON BUYING PLANT PHENOTYPING PRODUCTS
                    TABLE 6 INFLUENCE OF STAKEHOLDERS ON BUYING TOP THREE PLANT PHENOTYPING PRODUCTS
           6.11.2 BUYING CRITERIA
                    FIGURE 24 KEY BUYING CRITERIA FOR TOP APPLICATIONS
                    TABLE 7 KEY BUYING CRITERIA FOR PLANT PHENOTYPING PRODUCTS
    6.12 KEY CONFERENCES AND EVENTS 
                    TABLE 8 PLANT PHENOTYPING MARKET: DETAILED LIST OF CONFERENCES AND EVENTS, 2022–2023
 
7 PLANT PHENOTYPING MARKET, BY PRODUCT (Page No. - 65)
    7.1 INTRODUCTION 
           FIGURE 25 PLANT PHENOTYPING MARKET, BY PRODUCT, 2022 VS. 2027 (USD MILLION)
           TABLE 9 MARKET FOR PLANT PHENOTYPING, BY PRODUCT, 2017–2021 (USD MILLION)
           TABLE 10 MARKET FOR PLANT PHENOTYPING, BY PRODUCT, 2022–2027 (USD MILLION)
    7.2 EQUIPMENT 
           7.2.1 HIGH DEMAND FOR HIGH-THROUGHPUT PHENOTYPING SYSTEMS TO DRIVE MARKET
                    TABLE 11 PLANT PHENOTYPING EQUIPMENT MARKET, BY REGION, 2017–2021 (USD MILLION)
                    TABLE 12 PLANT PHENOTYPING EQUIPMENT MARKET, BY REGION, 2022–2027 (USD MILLION)
    7.3 SOFTWARE 
           7.3.1 RISING DEMAND FOR FLEXIBLE AND EXTENDED COMPUTATIONAL TOOLS TO DRIVE ADOPTION OF PLANT PHENOTYPING SYSTEMS
                    TABLE 13 PLANT PHENOTYPING SOFTWARE MARKET, BY REGION, 2017–2021 (USD MILLION)
                    TABLE 14 PLANT PHENOTYPING SOFTWARE MARKET, BY REGION, 2022–2027 (USD MILLION)
    7.4 SENSORS 
           7.4.1 RISE IN DEMAND FOR SENSORS TO DETECT PLANT TRAITS
                    TABLE 15 PLANT PHENOTYPING SENSORS MARKET, BY REGION, 2017–2021 (USD MILLION)
                    TABLE 16 PLANT PHENOTYPING SENSORS MARKET, BY REGION, 2022–2027 (USD MILLION)
 
8 PLANT PHENOTYPING MARKET, BY EQUIPMENT (Page No. - 71)
    8.1 INTRODUCTION 
    8.2 BY SITE 
           TABLE 17 PLANT PHENOTYPING EQUIPMENT MARKET, BY SITE, 2017–2021 (USD MILLION)
           TABLE 18 PLANT PHENOTYPING EQUIPMENT MARKET, BY SITE, 2022–2027 (USD MILLION)
           8.2.1 LABORATORY
                    8.2.1.1 Low-cost option for plant phenotyping
                               TABLE 19 LABORATORY PLANT PHENOTYPING EQUIPMENT MARKET, BY REGION,  2017–2021 (USD MILLION)
                               TABLE 20 LABORATORY PLANT PHENOTYPING EQUIPMENT MARKET, BY REGION,  2022–2027 (USD MILLION)
           8.2.2 GREENHOUSE
                    8.2.2.1 Inclination toward minimizing variability of soil to drive market
                               TABLE 21 GREENHOUSE PLANT PHENOTYPING EQUIPMENT MARKET, BY REGION,  2017–2021 (USD MILLION)
                               TABLE 22 GREENHOUSE PLANT PHENOTYPING EQUIPMENT MARKET, BY REGION,  2022–2027 (USD MILLION)
           8.2.3 FIELD
                    8.2.3.1 Rising demand for customized plant phenotyping equipment to drive market
                               TABLE 23 FIELD PLANT PHENOTYPING EQUIPMENT MARKET, BY REGION,  2017–2021 (USD MILLION)
                               TABLE 24 FIELD PLANT PHENOTYPING EQUIPMENT MARKET, BY REGION,  2022–2027 (USD MILLION)
    8.3 BY PLATFORM/CARRIER 
           TABLE 25 PLANT PHENOTYPING EQUIPMENT MARKET, BY PLATFORM, 2017–2021 (USD MILLION)
           TABLE 26 PLANT PHENOTYPING EQUIPMENT MARKET, BY PLATFORM, 2022–2027 (USD MILLION)
           8.3.1 CONVEYOR-BASED/MODULAR SYSTEMS
           8.3.2 BENCH-BASED SYSTEMS
           8.3.3 HANDHELD/PORTABLE SYSTEMS
           8.3.4 DRONES
    8.4 BY LEVEL OF AUTOMATION 
           TABLE 27 PLANT PHENOTYPING EQUIPMENT MARKET, BY LEVEL OF AUTOMATION,  2017–2021 (USD MILLION)
           TABLE 28 PLANT PHENOTYPING EQUIPMENT MARKET, BY LEVEL OF AUTOMATION,  2022–2027 (USD MILLION)
           8.4.1 MANUAL
           8.4.2 SEMI-AUTOMATED
           8.4.3 FULLY AUTOMATED
    8.5 BY APPLICATION 
           TABLE 29 PLANT PHENOTYPING EQUIPMENT MARKET, BY APPLICATION, 2017–2021 (USD MILLION)
           TABLE 30 PLANT PHENOTYPING EQUIPMENT MARKET, BY APPLICATION, 2022–2027 (USD MILLION)
           8.5.1 HIGH-THROUGHPUT SCREENING
           8.5.2 TRAIT IDENTIFICATION
           8.5.3 PHOTOSYNTHETIC PERFORMANCE
           8.5.4 MORPHOLOGY AND GROWTH ASSESSMENT
           8.5.5 OTHER APPLICATIONS
    8.6 BY ANALYSIS SYSTEM 
           TABLE 31 PLANT PHENOTYPING EQUIPMENT MARKET, BY ANALYSIS SYSTEM,  2017–2021 (USD MILLION)
           TABLE 32 PLANT PHENOTYPING EQUIPMENT MARKET, BY ANALYSIS SYSTEM,  2022–2027 (USD MILLION)
           8.6.1 IMAGE ANALYSIS SYSTEMS
           8.6.2 MULTISPECTRAL SCIENTIFIC CAMERAS
           8.6.3 CANOPY ANALYSIS SYSTEMS
           8.6.4 FLUOROMETERS
           8.6.5 OTHER ANALYSIS SYSTEMS
 
9 PLANT PHENOTYPING MARKET, BY SOFTWARE (Page No. - 85)
    9.1 INTRODUCTION 
           FIGURE 26 PLANT PHENOTYPING MARKET, BY SOFTWARE, 2022 VS. 2027 (USD MILLION)
           TABLE 33 MARKET FOR PLANT PHENOTYPING, BY SOFTWARE, 2017–2021 (USD MILLION)
           TABLE 34 MARKET FOR PLANT PHENOTYPING, BY SOFTWARE, 2022–2027 (USD MILLION)
    9.2 IMAGE ANALYSIS 
           9.2.1 DEMAND FOR ROBUST, RELIABLE HIGH-THROUGHPUT PHENOTYPING SYSTEMS TO DRIVE MARKET
                    TABLE 35 IMAGE ANALYSIS MARKET, BY REGION, 2017–2021 (USD MILLION)
                    TABLE 36 IMAGE ANALYSIS MARKET, BY REGION, 2022–2027 (USD MILLION)
    9.3 DATA ACQUISITION 
           9.3.1 RISING DEMAND FOR COLLECTING DATA REGARDING PLANT HEALTH TO DRIVE MARKET
                    TABLE 37 DATA ACQUISITION MARKET, BY REGION, 2017–2021 (USD MILLION)
                    TABLE 38 DATA ACQUISITION MARKET, BY REGION, 2022–2027 (USD MILLION)
    9.4 SYSTEM CONTROL 
           9.4.1 INCREASED DEMAND FOR AUTOMATED PLANT PHENOTYPING SYSTEMS TO SUPPORT MARKET GROWTH
                    TABLE 39 SYSTEM CONTROL MARKET, BY REGION, 2017–2021 (USD MILLION)
                    TABLE 40 SYSTEM CONTROL MARKET, BY REGION, 2022–2027 (USD MILLION)
    9.5 OTHER SOFTWARE 
           TABLE 41 OTHER SOFTWARE MARKET, BY REGION, 2017–2021 (USD MILLION)
           TABLE 42 OTHER SOFTWARE MARKET, BY REGION, 2022–2027 (USD MILLION)
 
10 PLANT PHENOTYPING MARKET, BY SENSOR (Page No. - 92)
     10.1 INTRODUCTION 
               FIGURE 27 PLANT PHENOTYPING MARKET, BY SENSOR, 2022 VS. 2027 (USD MILLION)
               TABLE 43 MARKET FOR PLANT PHENOTYPING, BY SENSOR, 2017–2021 (USD MILLION)
               TABLE 44 MARKET FOR PLANT PHENOTYPING, BY SENSOR, 2022–2027 (USD MILLION)
     10.2 IMAGE SENSORS 
             10.2.1 LARGEST SEGMENT OF PLANT PHENOTYPING MARKET
                       TABLE 45 IMAGE SENSORS MARKET, BY REGION, 2017–2021 (USD MILLION)
                       TABLE 46 IMAGE SENSORS MARKET, BY REGION, 2022–2027 (USD MILLION)
     10.3 NDVI SENSORS 
             10.3.1 INCREASING DEMAND FOR PHOTOSYNTHETIC CAPACITY OF PLANT AND PLANT HEALTH TO DRIVE MARKET
                       TABLE 47 NDVI SENSORS MARKET, BY REGION, 2017–2021 (USD MILLION)
                       TABLE 48 NDVI SENSORS MARKET, BY REGION, 2022–2027 (USD MILLION)
     10.4 TEMPERATURE SENSORS 
             10.4.1 INCREASED INVESTMENTS IN TEMPERATURE SENSORS FOR ACCURATE DATA AND ANALYSIS
                       TABLE 49 TEMPERATURE SENSORS MARKET, BY REGION, 2017–2021 (USD MILLION)
                       TABLE 50 TEMPERATURE SENSORS MARKET, BY REGION, 2022–2027 (USD MILLION)
     10.5 OTHER SENSORS 
               TABLE 51 OTHER SENSORS MARKET, BY REGION, 2017–2021 (USD MILLION)
               TABLE 52 OTHER SENSORS MARKET, BY REGION, 2022–2027 (USD MILLION)
 
11 PLANT PHENOTYPING MARKET, BY SERVICE (Page No. - 99)
     11.1 INTRODUCTION 
               FIGURE 28 PLANT PHENOTYPING MARKET, BY SERVICE, 2022 VS. 2027 (USD MILLION)
               TABLE 53 MARKET FOR PLANT PHENOTYPING, BY SERVICE, 2017–2021 (USD MILLION)
               TABLE 54 MARKET FOR PLANT PHENOTYPING, BY SERVICE, 2022–2027 (USD MILLION)
     11.2 MEASUREMENT ACQUISITION AND DATA ANALYSIS 
     11.3 STATISTICAL ANALYSIS 
 
12 PLANT PHENOTYPING MARKET, BY REGION (Page No. - 102)
     12.1 INTRODUCTION 
               FIGURE 29 REGIONAL SNAPSHOT: COUNTRIES IN ASIA PACIFIC TO REGISTER HIGHER GROWTH DURING FORECAST PERIOD
               TABLE 55 PLANT PHENOTYPING MARKET, BY REGION, 2017–2021 (USD MILLION)
               TABLE 56 MARKET FOR PLANT PHENOTYPING, BY REGION, 2022–2027 (USD MILLION)
     12.2 EUROPE 
               FIGURE 30 EUROPE: PLANT PHENOTYPING MARKET SNAPSHOT
               TABLE 57 EUROPE: MARKET FOR PLANT PHENOTYPING, BY COUNTRY, 2017–2021 (USD MILLION)
               TABLE 58 EUROPE: MARKET FOR PLANT PHENOTYPING, BY COUNTRY, 2022–2027 (USD MILLION)
               TABLE 59 EUROPE: MARKET FOR PLANT PHENOTYPING, BY TYPE, 2017–2021 (USD MILLION)
               TABLE 60 EUROPE: MARKET FOR PLANT PHENOTYPING, BY TYPE, 2022–2027 (USD MILLION)
               TABLE 61 EUROPE: MARKET FOR PLANT PHENOTYPING, BY PRODUCT, 2017–2021 (USD MILLION)
               TABLE 62 EUROPE: MARKET FOR PLANT PHENOTYPING, BY PRODUCT, 2022–2027 (USD MILLION)
               TABLE 63 EUROPE: PLANT PHENOTYPING EQUIPMENT MARKET, BY SITE,  2017–2021 (USD MILLION)
               TABLE 64 EUROPE: PLANT PHENOTYPING EQUIPMENT MARKET, BY SITE,  2022–2027 (USD MILLION)
             12.2.1 NETHERLANDS
                       12.2.1.1 Largest market for plant phenotyping in Europe
                                   TABLE 65 NETHERLANDS: PLANT PHENOTYPING MARKET, BY TYPE, 2017–2021 (USD MILLION)
                                   TABLE 66 NETHERLANDS: MARKET FOR PLANT PHENOTYPING, BY TYPE, 2022–2027 (USD MILLION)
                                   TABLE 67 NETHERLANDS: MARKET FOR PLANT PHENOTYPING, BY PRODUCT, 2017–2021 (USD MILLION)
                                   TABLE 68 NETHERLANDS: MARKET FOR PLANT PHENOTYPING, BY PRODUCT, 2022–2027 (USD MILLION)
                                   TABLE 69 NETHERLANDS: PLANT PHENOTYPING EQUIPMENT MARKET, BY SITE,  2017–2021 (USD MILLION)
                                   TABLE 70 NETHERLANDS: PLANT PHENOTYPING EQUIPMENT MARKET, BY SITE,  2022–2027 (USD MILLION)
             12.2.2 BELGIUM
                       12.2.2.1 Rising number of R&D activities on plant phenotyping to drive market
                                   TABLE 71 BELGIUM: PLANT PHENOTYPING MARKET, BY TYPE, 2017–2021 (USD MILLION)
                                   TABLE 72 BELGIUM: MARKET FOR PLANT PHENOTYPING, BY TYPE, 2022–2027 (USD MILLION)
                                   TABLE 73 BELGIUM: MARKET FOR PLANT PHENOTYPING, BY PRODUCT, 2017–2021 (USD MILLION)
                                   TABLE 74 BELGIUM: MARKET FOR PLANT PHENOTYPING, BY PRODUCT, 2022–2027 (USD MILLION)
                                   TABLE 75 BELGIUM: PLANT PHENOTYPING EQUIPMENT MARKET, BY SITE,  2017–2021 (USD MILLION)
                                   TABLE 76 BELGIUM: PLANT PHENOTYPING EQUIPMENT MARKET, BY SITE,  2022–2027 (USD MILLION)
             12.2.3 GERMANY
                       12.2.3.1 Inclination toward green biotechnology to support market growth
                                   TABLE 77 GERMANY: PLANT PHENOTYPING MARKET, BY TYPE, 2017–2021 (USD MILLION)
                                   TABLE 78 GERMANY: MARKET FOR PLANT PHENOTYPING, BY TYPE, 2022–2027 (USD MILLION)
                                   TABLE 79 GERMANY: MARKET FOR PLANT PHENOTYPING, BY PRODUCT, 2017–2021 (USD MILLION)
                                   TABLE 80 GERMANY: MARKET FOR PLANT PHENOTYPING, BY PRODUCT, 2022–2027 (USD MILLION)
                                   TABLE 81 GERMANY: PLANT PHENOTYPING EQUIPMENT MARKET, BY SITE,  2017–2021 (USD MILLION)
                                   TABLE 82 GERMANY: PLANT PHENOTYPING EQUIPMENT MARKET, BY SITE,  2022–2027 (USD MILLION)
             12.2.4 UK
                       12.2.4.1 Increasing research on sustainable farming to aid market
                                   TABLE 83 UK: PLANT PHENOTYPING MARKET, BY TYPE, 2017–2021 (USD MILLION)
                                   TABLE 84 UK: MARKET FOR PLANT PHENOTYPING, BY TYPE, 2022–2027 (USD MILLION)
                                   TABLE 85 UK: MARKET FOR PLANT PHENOTYPING, BY PRODUCT, 2017–2021 (USD MILLION)
                                   TABLE 86 UK: MARKET FOR PLANT PHENOTYPING, BY PRODUCT, 2022–2027 (USD MILLION)
                                   TABLE 87 UK: PLANT PHENOTYPING EQUIPMENT MARKET, BY SITE, 2017–2021 (USD MILLION)
                                   TABLE 88 UK: PLANT PHENOTYPING EQUIPMENT MARKET, BY SITE, 2022–2027 (USD MILLION)
             12.2.5 REST OF EUROPE
                       TABLE 89 REST OF EUROPE: PLANT PHENOTYPING MARKET, BY TYPE, 2017–2021 (USD MILLION)
                       TABLE 90 REST OF EUROPE: MARKET FOR PLANT PHENOTYPING, BY TYPE, 2022–2027 (USD MILLION)
                       TABLE 91 REST OF EUROPE: MARKET FOR PLANT PHENOTYPING, BY PRODUCT,  2017–2021 (USD MILLION)
                       TABLE 92 REST OF EUROPE: MARKET FOR PLANT PHENOTYPING, BY PRODUCT,  2022–2027 (USD MILLION)
                       TABLE 93 REST OF EUROPE: PLANT PHENOTYPING EQUIPMENT MARKET, BY SITE, 2017–2021 (USD MILLION)
                       TABLE 94 REST OF EUROPE: PLANT PHENOTYPING EQUIPMENT MARKET, BY SITE,  2022–2027 (USD MILLION)
     12.3 NORTH AMERICA 
               FIGURE 31 NORTH AMERICA: PLANT PHENOTYPING MARKET SNAPSHOT
               TABLE 95 NORTH AMERICA: MARKET FOR PLANT PHENOTYPING, BY COUNTRY,  2017–2021 (USD MILLION)
               TABLE 96 NORTH AMERICA: MARKET FOR PLANT PHENOTYPING, BY COUNTRY,  2022–2027 (USD MILLION)
               TABLE 97 NORTH AMERICA: MARKET FOR PLANT PHENOTYPING, BY TYPE, 2017–2021 (USD MILLION)
               TABLE 98 NORTH AMERICA: MARKET FOR PLANT PHENOTYPING, BY TYPE, 2022–2027 (USD MILLION)
               TABLE 99 NORTH AMERICA: MARKET FOR PLANT PHENOTYPING, BY PRODUCT,  2017–2021 (USD MILLION)
               TABLE 100 NORTH AMERICA: PLANT PHENOTYPING MARKET, BY PRODUCT,  2022–2027 (USD MILLION)
               TABLE 101 NORTH AMERICA: PLANT PHENOTYPING EQUIPMENT MARKET, BY SITE,  2017–2021 (USD MILLION)
               TABLE 102 NORTH AMERICA: PLANT PHENOTYPING EQUIPMENT MARKET, BY SITE,  2022–2027 (USD MILLION)
             12.3.1 US
                       12.3.1.1 Increasing support from government as well as private industry to drive market
                                   TABLE 103 US: PLANT PHENOTYPING MARKET, BY TYPE, 2017–2021 (USD MILLION)
                                   TABLE 104 US: MARKET FOR PLANT PHENOTYPING, BY TYPE, 2022–2027 (USD MILLION)
                                   TABLE 105 US: MARKET FOR PLANT PHENOTYPING, BY PRODUCT, 2017–2021 (USD MILLION)
                                   TABLE 106 US: MARKET FOR PLANT PHENOTYPING, BY PRODUCT, 2022–2027 (USD MILLION)
                                   TABLE 107 US: PLANT PHENOTYPING EQUIPMENT MARKET, BY SITE, 2017–2021 (USD MILLION)
                                   TABLE 108 US: PLANT PHENOTYPING EQUIPMENT MARKET, BY SITE, 2022–2027 (USD MILLION)
             12.3.2 CANADA
                       12.3.2.1 Major agricultural producer and exporter globally
                                   TABLE 109 CANADA: PLANT PHENOTYPING MARKET, BY TYPE, 2017–2021 (USD MILLION)
                                   TABLE 110 CANADA: MARKET FOR PLANT PHENOTYPING, BY TYPE, 2022–2027 (USD MILLION)
                                   TABLE 111 CANADA: MARKET FOR PLANT PHENOTYPING, BY PRODUCT, 2017–2021 (USD MILLION)
                                   TABLE 112 CANADA: MARKET FOR PLANT PHENOTYPING, BY PRODUCT, 2022–2027 (USD MILLION)
                                   TABLE 113 CANADA: PLANT PHENOTYPING EQUIPMENT MARKET, BY SITE,  2017–2021 (USD MILLION)
                                   TABLE 114 CANADA: PLANT PHENOTYPING EQUIPMENT MARKET, BY SITE,  2022–2027 (USD MILLION)
     12.4 ASIA PACIFIC 
               TABLE 115 ASIA PACIFIC: PLANT PHENOTYPING MARKET, BY COUNTRY, 2017–2021 (USD MILLION)
               TABLE 116 ASIA PACIFIC: MARKET FOR PLANT PHENOTYPING, BY COUNTRY, 2022–2027 (USD MILLION)
               TABLE 117 ASIA PACIFIC: MARKET FOR PLANT PHENOTYPING, BY TYPE, 2017–2021 (USD MILLION)
               TABLE 118 ASIA PACIFIC: MARKET FOR PLANT PHENOTYPING, BY TYPE, 2022–2027 (USD MILLION)
               TABLE 119 ASIA PACIFIC: MARKET FOR PLANT PHENOTYPING, BY PRODUCT, 2017–2021 (USD MILLION)
               TABLE 120 ASIA PACIFIC: MARKET FOR PLANT PHENOTYPING, BY PRODUCT, 2022–2027 (USD MILLION)
               TABLE 121 ASIA PACIFIC: PLANT PHENOTYPING EQUIPMENT MARKET, BY SITE,  2017–2021 (USD MILLION)
               TABLE 122 ASIA PACIFIC: PLANT PHENOTYPING EQUIPMENT MARKET, BY SITE,  2022–2027 (USD MILLION)
             12.4.1 AUSTRALIA
                       12.4.1.1 Important market in Asia Pacific region
                                   TABLE 123 AUSTRALIA: PLANT PHENOTYPING MARKET, BY TYPE, 2017–2021 (USD MILLION)
                                   TABLE 124 AUSTRALIA: MARKET FOR PLANT PHENOTYPING, BY TYPE, 2022–2027 (USD MILLION)
                                   TABLE 125 AUSTRALIA: MARKET FOR PLANT PHENOTYPING, BY PRODUCT, 2017–2021 (USD MILLION)
                                   TABLE 126 AUSTRALIA: MARKET FOR PLANT PHENOTYPING, BY PRODUCT, 2022–2027 (USD MILLION)
                                   TABLE 127 AUSTRALIA: PLANT PHENOTYPING EQUIPMENT MARKET, BY SITE,  2017–2021 (USD MILLION)
                                   TABLE 128 AUSTRALIA: PLANT PHENOTYPING EQUIPMENT MARKET, BY SITE,  2022–2027 (USD MILLION)
             12.4.2 JAPAN
                       12.4.2.1 Rising research activities to support market growth
                                   TABLE 129 JAPAN: PLANT PHENOTYPING MARKET, BY TYPE, 2017–2021 (USD MILLION)
                                   TABLE 130 JAPAN: MARKET FOR PLANT PHENOTYPING, BY TYPE, 2022–2027 (USD MILLION)
                                   TABLE 131 JAPAN: MARKET FOR PLANT PHENOTYPING, BY PRODUCT, 2017–2021 (USD MILLION)
                                   TABLE 132 JAPAN: MARKET FOR PLANT PHENOTYPING, BY PRODUCT, 2022–2027 (USD MILLION)
                                   TABLE 133 JAPAN: PLANT PHENOTYPING EQUIPMENT MARKET, BY SITE, 2017–2021 (USD MILLION)
                                   TABLE 134 JAPAN: PLANT PHENOTYPING EQUIPMENT MARKET, BY SITE, 2022–2027 (USD MILLION)
             12.4.3 CHINA
                       12.4.3.1 Rising demand for modern plant breeding techniques to drive overall market
                                   TABLE 135 CHINA: PLANT PHENOTYPING MARKET, BY TYPE, 2017–2021 (USD MILLION)
                                   TABLE 136 CHINA: MARKET FOR PLANT PHENOTYPING, BY TYPE, 2022–2027 (USD MILLION)
                                   TABLE 137 CHINA: MARKET FOR PLANT PHENOTYPING, BY PRODUCT, 2017–2021 (USD MILLION)
                                   TABLE 138 CHINA: MARKET FOR PLANT PHENOTYPING, BY PRODUCT, 2022–2027 (USD MILLION)
                                   TABLE 139 CHINA: PLANT PHENOTYPING EQUIPMENT MARKET, BY SITE, 2017–2021 (USD MILLION)
                                   TABLE 140 CHINA: PLANT PHENOTYPING EQUIPMENT MARKET, BY SITE, 2022–2027 (USD MILLION)
             12.4.4 INDIA
                       12.4.4.1 High usage of drones to favor market growth
                                   TABLE 141 INDIA: PLANT PHENOTYPING MARKET, BY TYPE, 2017–2021 (USD MILLION)
                                   TABLE 142 INDIA: MARKET FOR PLANT PHENOTYPING, BY TYPE, 2022–2027 (USD MILLION)
                                   TABLE 143 INDIA: MARKET FOR PLANT PHENOTYPING, BY PRODUCT, 2017–2021 (USD MILLION)
                                   TABLE 144 INDIA: MARKET FOR PLANT PHENOTYPING, BY PRODUCT, 2022–2027 (USD MILLION)
                                   TABLE 145 INDIA: PLANT PHENOTYPING EQUIPMENT MARKET, BY SITE, 2017–2021 (USD MILLION)
                                   TABLE 146 INDIA: PLANT PHENOTYPING EQUIPMENT MARKET, BY SITE, 2022–2027 (USD MILLION)
             12.4.5 SOUTH KOREA
                       12.4.5.1 High investments in plant breeding activities to support market growth
                                   TABLE 147 SOUTH KOREA: PLANT PHENOTYPING MARKET, BY TYPE, 2017–2021 (USD MILLION)
                                   TABLE 148 SOUTH KOREA: MARKET FOR PLANT PHENOTYPING, BY TYPE, 2022–2027 (USD MILLION)
                                   TABLE 149 SOUTH KOREA: MARKET FOR PLANT PHENOTYPING, BY PRODUCT, 2017–2021 (USD MILLION)
                                   TABLE 150 SOUTH KOREA: MARKET FOR PLANT PHENOTYPING, BY PRODUCT, 2022–2027 (USD MILLION)
                                   TABLE 151 SOUTH KOREA: PLANT PHENOTYPING EQUIPMENT MARKET, BY SITE,  2017–2021 (USD MILLION)
                                   TABLE 152 SOUTH KOREA: PLANT PHENOTYPING EQUIPMENT MARKET, BY SITE,  2022–2027 (USD MILLION)
             12.4.6 REST OF ASIA PACIFIC
                       TABLE 153 REST OF ASIA PACIFIC: PLANT PHENOTYPING MARKET, BY TYPE,  2017–2021 (USD MILLION)
                       TABLE 154 REST OF ASIA PACIFIC: MARKET FOR PLANT PHENOTYPING, BY TYPE,  2022–2027 (USD MILLION)
                       TABLE 155 REST OF ASIA PACIFIC: MARKET FOR PLANT PHENOTYPING, BY PRODUCT,  2017–2021 (USD MILLION)
                       TABLE 156 REST OF ASIA PACIFIC: MARKET FOR PLANT PHENOTYPING, BY PRODUCT,  2022–2027 (USD MILLION)
                       TABLE 157 REST OF ASIA PACIFIC: PLANT PHENOTYPING EQUIPMENT MARKET, BY SITE,  2017–2021 (USD MILLION)
                       TABLE 158 REST OF ASIA PACIFIC: PLANT PHENOTYPING EQUIPMENT MARKET, BY SITE,  2022–2027 (USD MILLION)
     12.5 REST OF THE WORLD 
               TABLE 159 REST OF THE WORLD: PLANT PHENOTYPING MARKET, BY REGION,  2017–2021 (USD MILLION)
               TABLE 160 REST OF THE WORLD: MARKET FOR PLANT PHENOTYPING, BY REGION,  2022–2027 (USD MILLION)
               TABLE 161 REST OF THE WORLD: MARKET FOR PLANT PHENOTYPING, BY TYPE, 2017–2021 (USD MILLION)
               TABLE 162 REST OF THE WORLD: MARKET FOR PLANT PHENOTYPING, BY TYPE,  2022–2027 (USD MILLION)
               TABLE 163 REST OF THE WORLD: PLANT PHENOTYPING MARKET, BY PRODUCT,  2017–2021 (USD MILLION)
               TABLE 164 REST OF THE WORLD: MARKET FOR PLANT PHENOTYPING, BY PRODUCT,  2022–2027 (USD MILLION)
               TABLE 165 REST OF THE WORLD: PLANT PHENOTYPING EQUIPMENT MARKET, BY SITE,  2017–2021 (USD MILLION)
               TABLE 166 REST OF THE WORLD: PLANT PHENOTYPING EQUIPMENT MARKET, BY SITE,  2022–2027 (USD MILLION)
             12.5.1 SOUTH AMERICA
                       12.5.1.1 Rising demand for technologies in agriculture to drive market
                                   TABLE 167 SOUTH AMERICA: PLANT PHENOTYPING MARKET, BY TYPE, 2017–2021 (USD MILLION)
                                   TABLE 168 SOUTH AMERICA: MARKET FOR PLANT PHENOTYPING, BY TYPE, 2022–2027 (USD MILLION)
                                   TABLE 169 SOUTH AMERICA: MARKET FOR PLANT PHENOTYPING, BY PRODUCT,  2017–2021 (USD MILLION)
                                   TABLE 170 SOUTH AMERICA: MARKET FOR PLANT PHENOTYPING, BY PRODUCT,  2022–2027 (USD MILLION)
                                   TABLE 171 SOUTH AMERICA: PLANT PHENOTYPING EQUIPMENT MARKET, BY SITE,  2017–2021 (USD MILLION)
                                   TABLE 172 SOUTH AMERICA: PLANT PHENOTYPING EQUIPMENT MARKET, BY SITE,  2022–2027 (USD MILLION)
             12.5.2 AFRICA
                       12.5.2.1 Modern plant breeding activities in Africa to favor market growth
                                   TABLE 173 AFRICA: PLANT PHENOTYPING MARKET, BY TYPE, 2017–2021 (USD MILLION)
                                   TABLE 174 AFRICA: MARKET FOR PLANT PHENOTYPING, BY TYPE, 2022–2027 (USD MILLION)
                                   TABLE 175 AFRICA: MARKET FOR PLANT PHENOTYPING, BY PRODUCT, 2017–2021 (USD MILLION)
                                   TABLE 176 AFRICA: MARKET FOR PLANT PHENOTYPING, BY PRODUCT, 2022–2027 (USD MILLION)
                                   TABLE 177 AFRICA: PLANT PHENOTYPING EQUIPMENT MARKET, BY SITE, 2017–2021 (USD MILLION)
                                   TABLE 178 AFRICA: PLANT PHENOTYPING EQUIPMENT MARKET, BY SITE, 2022–2027 (USD MILLION)
             12.5.3 MIDDLE EAST
                       12.5.3.1 Rising adoption of plant breeding activities to drive market
                                   TABLE 179 MIDDLE EAST: PLANT PHENOTYPING MARKET, BY TYPE, 2017–2021 (USD MILLION)
                                   TABLE 180 MIDDLE EAST: MARKET FOR PLANT PHENOTYPING, BY TYPE, 2022–2027 (USD MILLION)
                                   TABLE 181 MIDDLE EAST: MARKET FOR PLANT PHENOTYPING, BY PRODUCT, 2017–2021 (USD MILLION)
                                   TABLE 182 MIDDLE EAST: MARKET FOR PLANT PHENOTYPING, BY PRODUCT, 2022–2027 (USD MILLION)
                                   TABLE 183 MIDDLE EAST: PLANT PHENOTYPING EQUIPMENT MARKET, BY SITE,  2017–2021 (USD MILLION)
                                   TABLE 184 MIDDLE EAST: PLANT PHENOTYPING EQUIPMENT MARKET, BY SITE,  2022–2027 (USD MILLION)
 
13 COMPETITIVE LANDSCAPE (Page No. - 156)
     13.1 OVERVIEW 
     13.2 MARKET SHARE ANALYSIS 
               FIGURE 32 MARKET SHARE ANALYSIS
     13.3 STRATEGIES ADOPTED BY KEY PLAYERS 
     13.4 REVENUE ANALYSIS OF KEY PLAYERS 
               FIGURE 33 REVENUE ANALYSIS OF KEY PLAYERS, 2019–2021
     13.5 COMPANY EVALUATION QUADRANT (KEY PLAYERS) 
             13.5.1 STARS
             13.5.2 EMERGING LEADERS
             13.5.3 PERVASIVE PLAYERS
             13.5.4 PARTICIPANTS
                       FIGURE 34 PLANT PHENOTYPING MARKET:  COMPANY EVALUATION QUADRANT FOR KEY PLAYERS, 2021
     13.6 COMPANY EVALUATION QUADRANT (STARTUPS/SMES) 
             13.6.1 PROGRESSIVE COMPANIES
             13.6.2 STARTING BLOCKS
             13.6.3 RESPONSIVE COMPANIES
             13.6.4 DYNAMIC COMPANIES
                       FIGURE 35 PLANT PHENOTYPING MARKET: COMPANY EVALUATION QUADRANT  FOR SMES/STARTUPS, 2021
     13.7 COMPANY FOOTPRINT ANALYSIS (KEY PLAYERS) 
               TABLE 185 COMPANY FOOTPRINT, BY TYPE
     13.8 COMPETITIVE SCENARIO 
             13.8.1 DEALS
                       TABLE 186 DEALS, 2019–2021
 
14 COMPANY PROFILES (Page No. - 162)
     14.1 KEY PLAYERS 
(Business Overview, Products & Services, Recent Developments, MnM View)*
             14.1.1 LEMNATEC (NYNOMIC AG)
                       TABLE 187 LEMNATEC (NYNOMIC AG): BUSINESS OVERVIEW
                       FIGURE 36 LEMNATEC (NYNOMIC AG): COMPANY SNAPSHOT
                       TABLE 188 LEMNATEC (NYNOMIC AG): PRODUCTS OFFERED
                       TABLE 189 LEMNATEC (NYNOMIC AG): DEALS
             14.1.2 DELTA-T DEVICES LTD.
                       TABLE 190 DELTA-T DEVICES LTD.: BUSINESS OVERVIEW
                       TABLE 191 DELTA-T DEVICES LTD.: PRODUCTS OFFERED
             14.1.3 HEINZ WALZ GMBH
                       TABLE 192 HEINZ WALZ GMBH: BUSINESS OVERVIEW
                       TABLE 193 HEINZ WALZ GMBH: PRODUCTS OFFERED
                       TABLE 194 HEINZ WALZ GMBH: DEALS
             14.1.4 PHENOSPEX
                       TABLE 195 PHENOSPEX: BUSINESS OVERVIEW
                       TABLE 196 PHENOSPEX: PRODUCTS OFFERED
                       TABLE 197 PHENOSPEX: OTHER DEVELOPMENTS
             14.1.5 KEYGENE
                       TABLE 198 KEYGENE: BUSINESS OVERVIEW
                       TABLE 199 KEYGENE: SERVICES OFFERED
                       TABLE 200 KEYGENE: DEALS
             14.1.6 PHENOMIX
                       TABLE 201 PHENOMIX: PRODUCTS OFFERED
             14.1.7 CROPDESIGN (BASF SE)
                       TABLE 202 CROPDESIGN (BASF SE): BUSINESS OVERVIEW
                       TABLE 203 CROPDESIGN (BASF SE): PRODUCTS OFFERED
             14.1.8 QUBIT SYSTEMS INC. (QUBIT PHENOMICS)
                       TABLE 204 QUBIT SYSTEMS INC.: BUSINESS OVERVIEW
                       TABLE 205 QUBIT SYSTEMS INC.: PRODUCTS OFFERED
             14.1.9 PHOTON SYSTEMS INSTRUMENTS
                       TABLE 206 PHOTON SYSTEMS INSTRUMENTS: BUSINESS OVERVIEW
                       TABLE 207 PHOTON SYSTEMS INSTRUMENTS: PRODUCTS OFFERED
             14.1.10 WPS B.V.
                       TABLE 208 WPS B.V.: BUSINESS OVERVIEW
                       TABLE 209 WPS B.V.: PRODUCTS OFFERED
             14.1.11 WIWAM
                       TABLE 210 WIWAM: BUSINESS OVERVIEW
                       TABLE 211 WIWAM: PRODUCTS OFFERED
             14.1.12 ROTHAMSTED RESEARCH LIMITED
                       TABLE 212 ROTHAMSTED RESEARCH LIMITED: BUSINESS OVERVIEW
             14.1.13 VBCF
                       TABLE 213 VBCF: BUSINESS OVERVIEW
                       TABLE 214 VBCF: SERVICES OFFERED
             14.1.14 PLANT DITECH
                       TABLE 215 PLANT DITECH: BUSINESS OVERVIEW
                       TABLE 216 PLANT DITECH: PRODUCTS OFFERED
             14.1.15 BEX CO., LTD.
                       TABLE 217 BEX CO., LTD.: BUSINESS OVERVIEW
                       TABLE 218 BEX CO., LTD.: PRODUCTS OFFERED
*Details on Business Overview, Products & Services, Recent Developments, MnM View might not be captured in case of unlisted companies.
     14.2 OTHER PLAYERS 
             14.2.1 HIPHEN
             14.2.2 TERRAMERA INC.
             14.2.3 SEED-X
             14.2.4 EQUINOM
             14.2.5 AGRELA ECOSYSTEMS
             14.2.6 GARDIN
             14.2.7 PETIOLE LTD.
             14.2.8 PHENO-INSPECT GMBH
             14.2.9 AGRI-EPI CENTRE LTD.
             14.2.10 PHENOKEY BV
 
15 ADJACENT AND RELATED MARKETS (Page No. - 194)
     15.1 INTRODUCTION 
               TABLE 219 ADJACENT MARKETS TO PLANT PHENOTYPING
     15.2 LIMITATIONS 
     15.3 AGRIGENOMICS MARKET 
             15.3.1 MARKET DEFINITION
             15.3.2 MARKET OVERVIEW
                       TABLE 220 AGRIGENOMICS MARKET, BY APPLICATION, 2018–2025 (USD MILLION)
 
16 APPENDIX (Page No. - 196)
     16.1 DISCUSSION GUIDE 
     16.2 KNOWLEDGESTORE: MARKETSANDMARKETS’  SUBSCRIPTION PORTAL 
     16.3 CUSTOMIZATION OPTIONS 
     16.4 RELATED REPORTS 
     16.5 AUTHOR DETAILS 

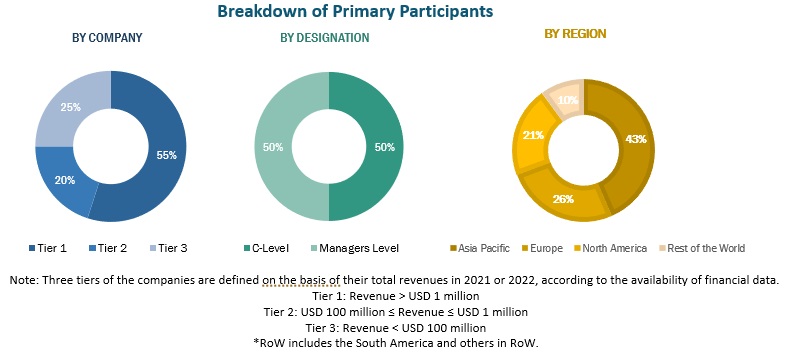
This research study involved the extensive use of secondary sources—directories and databases such as Bloomberg Businessweek and Factiva—to identify and collect information useful for a technical, market-oriented, and commercial study of the plant phenotyping market. In-depth interviews were conducted with various primary respondents—such as key industry participants, subject matter experts (SMEs), C-level executives of key market players, and industry consultants—to obtain and verify critical qualitative and quantitative information as well as to assess prospects. The following figure depicts the research design applied in drafting this report on the plant phenotyping market.

Secondary Research

In the secondary research process, various sources such as annual reports, press releases & investor presentations of companies, white papers, food journals, certified publications, articles from recognized authors, gold & silver standard websites, directories, and databases, were referred to identify and collect information.

Secondary research was mainly used to obtain key information about the industry’s supply chain, the total pool of key players, and market classification and segmentation as per the industry trends to the bottom-most level, regional markets, and key developments from both market- and technology oriented perspectives.

Primary Research

In the primary research process, various sources from the supply and demand sides were interviewed to obtain qualitative and quantitative information. The primary sources from the supply side included industry experts such as CEOs, vice presidents, marketing directors, technology and innovation directors, and related key executives from various key companies and organizations operating in the plant phenotyping market.
Plant Phenotyping Market Size, and Share

To know about the assumptions considered for the study, download the pdf brochure

Market Size Estimation

Both the top-down and bottom-up approaches were used to estimate and validate the total size of the plant phenotyping market. These methods were also used extensively to estimate the size of the various subsegments in the market. The research methodology used to estimate the market size includes the following:

  • The key players in the industry and market have been identified through extensive secondary research.
  • The revenues of major plant phenotyping manufacturers were determined through primary and secondary research, such as paid databases, which were used as the basis for market estimation.
  • All macroeconomic and microeconomic factors affecting the growth of the plant phenotyping market were considered while estimating the market size.
  • All possible parameters that affect the market covered in this research study were accounted for, viewed in extensive detail, verified through primary research, and analyzed to obtain final quantitative and qualitative data.

Data Triangulation

After arriving at the overall market size from the estimation process explained above, the total market was split into several segments and subsegments. To complete the overall market engineering process and arrive at the exact statistics for all segments and subsegments, the data triangulation and market breakdown procedures were employed wherever applicable. The data was triangulated by studying various factors and trends from the demand and supply sides. Along with this, the market size was validated using the top-down and bottom-up approaches.

Report Objectives

  • To define, segment, and project the global market for plant phenotyping on the basis of type and region
  • To provide detailed information regarding the key factors influencing the growth of the market (drivers, restraints, opportunities, and industry-specific challenges)
  • To strategically analyze the micromarkets with respect to individual growth trends, future prospects, and their contribution to the total market
  • To analyze the opportunities in the market for stakeholders and provide a competitive landscape of the market leaders
  • To project the size of the market and its submarkets, in terms of value, with respect to the regions (along with the key countries)
  • To strategically profile the key players and comprehensively analyze their market position and core competencies
  • To analyze the competitive developments such as joint ventures, mergers & acquisitions, new product developments, and research & developments in the plant phenotyping market

Available Customizations:

With the given market data, MarketsandMarkets offers customizations according to company-specific scientific needs.

The following customization options are available for the report:

Product Analysis

  • Product Matrix, which gives a detailed comparison of the product portfolio of each company

Geographic Analysis

With the given market data, MarketsandMarkets offers customizations according to the company-specific scientific needs.

  • Further breakdown of the Rest of Europe market for plant phenotyping into the Greece
  • Further breakdown of the Rest of South America market for plant phenotyping into Chile, Peru, and Ecuador
  • Further breakdown of RoW market for plant phenotyping into UAE, Saudi Arabia, and South Africa

Company Information

  • Detailed analyses and profiling of additional market players (up to five)
Custom Market Research Services

We will customize the research for you, in case the report listed above does not meet with your exact requirements. Our custom research will comprehensively cover the business information you require to help you arrive at strategic and profitable business decisions.

Request Customization

Instant Answers with GPT - Ask Now!

Ask real questions. Get complete answers !
Report Code
AGI 6566
Published ON
Dec, 2022
Choose License Type
BUY NOW
  • SHARE
X
Request Customization
Speak to Analyst
Speak to Analyst
OR FACE-TO-FACE MEETING
PERSONALIZE THIS RESEARCH
  • Triangulate with your Own Data
  • Get Data as per your Format and Definition
  • Gain a Deeper Dive on a Specific Application, Geography, Customer or Competitor
  • Any level of Personalization
REQUEST A FREE CUSTOMIZATION
LET US HELP YOU!
  • What are the Known and Unknown Adjacencies Impacting the Plant Phenotyping Market
  • What will your New Revenue Sources be?
  • Who will be your Top Customer; what will make them switch?
  • Defend your Market Share or Win Competitors
  • Get a Scorecard for Target Partners
CUSTOMIZED WORKSHOP REQUEST
knowledgestore logo

Want to explore hidden markets that can drive new revenue in Plant Phenotyping Market?

Find Hidden Markets
  • Call Us
  • +1-888-600-6441 (Corporate office hours)
  • +1-888-600-6441 (US/Can toll free)
  • +44-800-368-9399 (UK office hours)
CONNECT WITH US
ABOUT TRUST ONLINE
©2024 MarketsandMarkets Research Private Ltd. All rights reserved
DMCA.com Protection Status
Website Feedback