PET Packaging Market by Form (Amorphous PET, Crystalline PET), Pack type (Bottles & jars, Bags & pouches, Trays, Lids/Caps & closures, others), Filling Technology (Hot fill, Cold fill, Aseptic fill, others), Packaging Type (Rigid, Flexible), End-use industry - Forecast to 2021


[250 Pages Report] The market for PET packaging is estimated to grow from USD 55.12 Billion in 2015 to reach USD 74.32 Billion by 2021, at a CAGR of 5.21%. The base year considered for the study is 2015 and the market size is projected from 2016 to 2021. The segments considered for this report are based on packaging type, pack type, end-use industry, form, filling technology, and region.
The key objective of the global PET packaging report is to provide companies with a summary of the latest trends and lucrative business expansion opportunities for PET manufacturers, suppliers, and distributors. The report also demonstrates the key business strategies and principles adopted by the key players around the world. This report is intended to:
- create greater awareness about PET packaging and how they are manufactured and distributed by companies;
- increase access to information about the PET packaging business principles for other institutions that are planning to start the business;
- promote the use of the PET packaging more generally in end-use industries
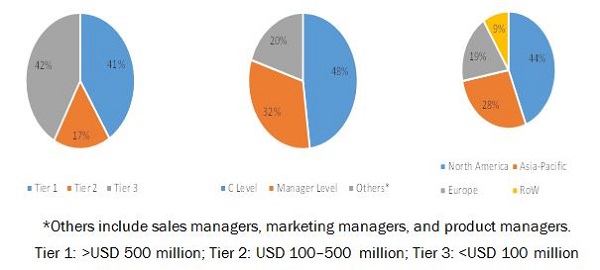
The research methodology used to forecast the market size was with the help of the top-down approach. The total market size of PET packaging was calculated based on the percentage split of packaging and percentage splits of different technologies used as PET packaging. This allotment and calculation were done on the basis of extensive primary interviews and secondary research. Primary research involved in this report includes extensive interviews with key people such as CEOs, VPs, directors, and executives. After arriving at the overall market size, the total market was split into several segments and subsegments. Data triangulation and market breakdown procedures were employed to complete the overall market engineering process and arrive at the exact statistics for all segments and subsegments. The breakdown of profiles of primary is depicted in the below figure:
The global PET packaging ecosystem comprises of PET packaging manufacturers, vendors, and service providers such as CCL Industries, Inc. (Canada), E. I. du Pont de Nemours and Company (referred to as DuPont) (U.S.), Amcor Limited (Australia), Resilux NV (Belgium), Rexam PLC (U.K.), Smurfit Kappa Group PLC (Ireland), Gerresheimer AG (Germany), and Kl�ckner Pentaplast GmbH & Co. KG (Germany). The other notable players in the market are Graham Packaging (U.S.), GTX Hanex Plastic Sp. z o.o. (Poland), Berry Plastic Group Inc. (U.S.), Dunmore (U.S.), and Huhtamaki Group (Finland).
This report estimates the size of the PET packaging in terms of volume (million units) and value (USD million). In this report, the market has been segmented broadly on the basis of technology, components, end-use industry, application, and region. The market drivers, restraints, opportunities, challenges, and product price trends have also been discussed in detail.
Target Audience
- Package manufacturers
- Healthcare & pharmaceutical institutes
- Retail shops & outlets
- Manufacturing organizations
- Beverage manufacturers
- Packaging organizations
Scope of the Report
This research report segments PET packaging into the following submarkets:
By Packaging Type:
- Rigid packaging
- Flexible packaging
By End-Use Industry:
- Food
- Beverages
- Personal care & cosmetics
- Household products
- Pharmaceuticals
- Others (industrial goods and consumer durables)
By Pack Type:
- Bottles & jars
- Bags & pouches
- Trays
- Lids/caps & closures
- Others (cups and clamshells)
By Filling Technology:
- Hot fill
- Cold fill
- Aseptic fill
- Others (counter-pressure, low vacuum gravity, high vacuum gravity, and positive pressure)
By Region:
- North America
- Europe
- Asia-Pacific
- RoW
Available Customizations
With the given market data, MarketsandMarkets offers customizations as per the client-specific needs. The following customization options are available for the report:
Product Analysis
- Product Matrix which gives a detailed comparison of market for different recycled product types
Geographic Analysis
- Further analysis of the PET packaging market for additional countries
Company Information
- Detailed analysis and profiling of additional market players (up to 5).
MarketsandMarkets projects that the PET packaging market will grow from USD 57.64 Billion in 2016 to USD 74.32 Billion by 2021, at an estimated CAGR of 5.21%. The market for PET packaging is growing due to growth in end-use industries such as food, beverage, personal care, and pharmaceutical, and rise in demand of sustainable & recyclable packaging. The emerging economies such as India, South Africa, and Brazil possess a great potential for the PET packaging market.
This market is segmented on the basis of form, packaging type, pack type, end-use industry, and filling technology. In terms of packaging type, rigid packaging held the largest market share, in terms of value. And it is projected to grow at the highest CAGR. The excellent growth is witnessed because of the increasing demand in end products such as containers, bottles & jars, and trays.
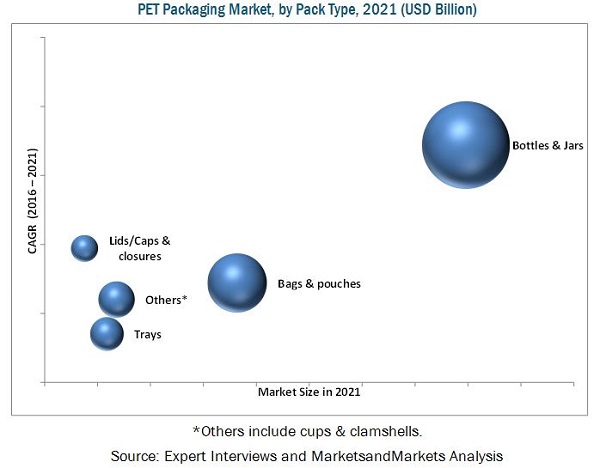
In terms of pack type, the bottles & jars segment accounted for the largest share in this market, in terms of both volume and value, among all pack type. The growing demand of sustainable & cost-effective packaging solutions in end-use industries such as packaged food, beverage, personal care, and pharmaceutical drives the bottles & jars segment.
In terms of filling technology, the cold fill technology dominated the filling technology segment because of its cost-effectiveness, whereas the hot fill technology is projected to grow at the highest CAGR.
In terms of end-use industry, the market is segmented into food, beverages, personal care & cosmetics, pharmaceuticals, household products, and others. The food segment is projected to grow at the highest rate due to the increase in the demand for ready-to-eat food and packaged food.
In terms of region, the market for PET packaging is segmented into North America, Europe, Asia-Pacific, and Rest of the World. The Asia-Pacific region is projected to grow at the highest CAGR among all the regions by 2021. This is mainly due to emerging economies in China and India and the growing industries such as healthcare & pharmaceutical, food, and beverage.
Fluctuation in raw material prices is a restraint in the PET packaging market. These fluctuations have hindered the growth of PET packaging around the world. Fluctuation in prices of crude oil will have an effect on the price of PET as PET resin is manufactured from crude oils.
The strategy of mergers & acquisitions was majorly adopted by most of the players in this market. Companies such as Amcor Limited (Australia), CCL Industries, Inc. (Canada), Berry Plastics (U.S.), Huhtamaki Group (Finland), and Rexam PLC (U.K.) were the key players who adopted this strategy to increase the reach of their offerings, improve their production capacity, and establish focus on core operations. Companies also emphasized on agreements & partnerships to increase their business operations in the fast-growing regions. Companies such as Graham Packaging Company (U.S.), Resilux NV (Belgium), and Amcor Limited (Australia) have adopted this strategy. Along with the same, these players have a strong distribution network and influencing presence in the developed as well as developing economies.
 Exclusive indicates content/data unique to MarketsandMarkets and not available with any competitors.
Table of Contents
1 Introduction (Page No. - 24)
1.1 Objectives of the Study
1.2 Market Definition
1.3 Study Scope
1.3.1 Years Considered for the Study
1.4 Currency Considered
1.5 Stakeholders
1.6 Limitations
2 Research Methodology (Page No. - 27)
2.1 Research Data
2.1.1 Secondary Data
2.1.1.1 Key Data From Secondary Sources
2.1.2 Primary Data
2.1.2.1 Key Data From Primary Sources
2.1.2.2 Key Industry Insights
2.2 Market Size Estimation
2.3 Market Breakdown and Data Triangulation
2.4 Research Assumptions & Limitations
2.4.1 Assumptions
2.4.2 Limitations
3 Executive Summary (Page No. - 36)
3.1 Introduction
4 Premium Insights (Page No. - 41)
4.1 PET Packaging Market Share, By Top 10 Countries
4.2 PET Packaging Market Size, By Pack Type (USD Billion)
4.3 Asia-Pacific PET Packaging Market, By Country & End-Use Industry
4.4 PET Packaging Market Size, By Region, 2016 vs 2021 (USD Billion)
4.5 PET Packaging Market Size, By Major Country, 2016 vs 2021 (USD Billion)
4.6 PET Packaging Market Share, By End Use, 2015 (USD Billion)
4.7 Life Cycle Analysis, By End Use
5 Market Overview (Page No. - 48)
5.1 Introduction
5.2 Evolution of PET Packaging Market
5.3 Trends in the Global Packaging Industry and Their Impact on PET Packaging
5.4 GDP and PET Packaging Consumption, Per Capita
5.5 PET Packaging Market Segmentation
5.6 Market Dynamics
5.6.1 Drivers
5.6.1.1 Demand Side
5.6.1.1.1 Increasing Demand From End-Use Industries
5.6.1.1.1.1 Food & Beverage Industry Represents the Largest Consumption Group of PET Packaging
5.6.1.1.1.2 PET Bottles Safe for Pharmaceutical Packaging
5.6.1.2 Shift in Consumer Preferences Towards Recyclable and Eco-Friendly Materials
5.6.1.3 Supply Side
5.6.1.3.1 Technological Advancements in the PET Packaging Market
5.6.2 Restraints
5.6.2.1 Fluctuations in Raw Material Prices
5.6.3 Opportunities
5.6.3.1 Increasing Demand for Recycled PET
5.6.4 Challenges
5.6.4.1 Lack of Effective Infrastructure Facilities for Recycling
5.7 Benefits Gained By Manufacturers and Customers
5.8 Comparison of PET Packaging and Its Substitutes
5.9 Integration as A Means of Reducing Costs in the Polyester Value Chain
5.10 Regulatory Standards for PET Pharmaceutical Packaging
5.10.1 Food and Drug Administration (FDA)
5.10.2 U.S. Pharmacopoeia (USP)
5.10.3 European Union (EU)
5.10.4 Bureau of Indian Standards (BIS)
5.11 Regulatory Standards for Food & Beverage Packaging
6 PET Packaging Market, By Form (Page No. - 64)
6.1 Introduction
6.1.1 PET Packaging Market Size, By Form
6.1.1.1 Amorphous PET Projected to Dominate the Market By 2021
6.2 Amorphous PET
6.3 Crystalline PET
7 PET Packaging Market, By Packaging Type (Page No. - 67)
7.1 Introduction
7.1.1 Packaging Type: PET Packaging Market Size
7.1.1.1 The Rigid Packaging Segment to Grow at the Highest Rate By 2021
7.2 Rigid Packaging
7.2.1 Rigid PET Packaging Market Size, By End-Use Industry
7.2.1.1 The Food Segment Held the Largest Market Share in 2015
7.2.2 Rigid PET Packaging Market Size, By End-Use Industry
7.3 Flexible Packaging
7.3.1 Flexible PET Packaging Market Size, By End-Use Industry
7.3.1.1 The Beverage Segment to Grow at the Highest Rate By 2021
7.3.2 Flexible PET Packaging Market Size, By End-Use Industry
8 PET Packaging Market, By Pack Type (Page No. - 73)
8.1 Introduction
8.1.1 Pack Type: PET Packaging Market Size
8.1.1.1 The Bottles & Jars Segment to Grow at the Highest Rate By 2021
8.2 Bottles & Jars
8.3 Bags & Pouches
8.4 Trays
8.5 Lids/Caps & Closures
8.6 Others
9 PET Packaging Market, By End-Use Industry (Page No. - 79)
9.1 Introduction
9.1.1 End-Use Industry: PET Packaging Market Size
9.1.1.1 The Beverage Segment Projected to Grow at the Highest Rate By 2021
9.2 Food
9.2.1 Food End-Use Market Size, By Pack Type
9.2.1.1 The Bottles & Jars Segment Projected to Dominate the Market By 2021
9.3 Beverage
9.3.1 Beverage End-Use Market Size, By Pack Type
9.3.1.1 The Bottles & Jars Segment Held the Largest Market Share in 2021
9.4 Personal Care & Cosmetics
9.4.1 Personal Care & Cosmetics End-Use Market Size, By Pack Type
9.4.1.1 The Bottles & Jars Segment Projected to Grow at the Highest CAGR
9.5 Households Products
9.5.1 Household Products End-Use Market Size, By Pack Type
9.5.1.1 The Bags & Pouches Segment Held the Second-Largest Share in Terms of Value in 2021
9.6 Pharmaceuticals
9.6.1 Pharmaceuticals End-Use Market Size, By Pack Type
9.6.1.1 The Lids/Caps & Closers Projected Grow at Second-Highest CAGR By 2021
9.7 Others
9.7.1 Others End-Use Market Size, By Pack Type
9.7.1.1 The Bottles & Jars Projected to Grow at the -Highest CAGR During the Forecast Period
10 PET Packaging Market, By Filling Technology (Page No. - 93)
10.1 Introduction
10.1.1 Filling Technology: PET Packaging Market Size
10.1.1.1 The Hot Fill Technology Projected to Grow at the Highest Rate By 2021
10.2 Hot Fill
10.2.1 Step-Wise Procedure of Hot Filling Process
10.3 Cold Fill
10.4 Aseptic Fill
10.5 Others
11 PET Packaging Market, By Region (Page No. - 101)
11.1 Introduction
11.2 North America
11.2.1 North America: PET Packaging Market, By Country
11.2.1.1 The U.S. is Projected to Be the Fastest-Growing Market From 2016 to 2021
11.2.2 North America: PET Packaging Market, By Pack Type
11.2.2.1 The Bottles & Jars Segment to Grow at the Highest Rate From 2016 to 2021
11.2.3 North America: PET Packaging Market, By Filling Technology
11.2.3.1 The Hot Fill Technology is Projected to Grow at the Highest Rate From 2016 to 2021
11.2.4 North America: PET Packaging Market, By End Use
11.2.4.1 The Food Segment Dominated the Market in North America in 2015
11.2.5 North America: PET Packaging Market, By Form
11.2.5.1 Amorphous PET Segment Accounted for the Largest Market Share in North America in 2015
11.2.6 North America: PET Packaging Market, By Packaging Type
11.2.6.1 The Rigid Packaging Segment to Grow at the Highest Rate in North America From 2016 to 2021
11.2.7 U.S.
11.2.7.1 U.S.: PET Packaging Market, By Pack Type
11.2.7.1.1 The Bottles & Jars Segment to Grow at the Highest Rate From 2016 to 2021
11.2.7.2 U.S.: PET Packaging Market, By Filling Technology
11.2.7.2.1 The Hot Fill Technology is Projected to Grow at the Highest Rate From 2016 to 2021
11.2.7.3 U.S.: PET Packaging Market, By End Use
11.2.7.3.1 The Beverage Segment Accounted for the Second-Largest Share in the U.S. in 2015
11.2.8 Canada
11.2.8.1 Canada: PET Packaging Market, By Pack Type
11.2.8.1.1 The Bottles & Jars Segment Accounted for the Largest Share in 2015
11.2.8.2 Canada: PET Packaging Market, By Filling Technology
11.2.8.2.1 The Cold Fill Technology Dominated the Canadian PET Packaging Market in 2015
11.2.8.3 Canada: PET Packaging Market, By End Use
11.2.8.3.1 The Food Segment Accounted for the Largest Share in Canada in 2015
11.2.9 Mexico
11.2.9.1 Mexico: PET Packaging Market, By Pack Type
11.2.9.1.1 The Bags & Pouches Segment is Projected to Grow at the Highest Rate From 2016 to 2021
11.2.9.2 Mexico: PET Packaging Market, By Filling Technology
11.2.9.2.1 The Cold Fill Technology Dominated the Mexican Market in 2015
11.2.9.3 Mexico: PET Packaging Market, By End Use
11.2.9.3.1 The Food Segment Accounted for the Largest Share in Mexico in 2015
11.3 Europe
11.3.1 Europe: PET Packaging Market, By Country
11.3.1.1 Germany is Projected to Be the Fastest-Growing Market By 2021
11.3.2 Europe: PET Packaging Market, By Pack Type
11.3.2.1 The Bottles & Jars Segment to Grow at the Highest Rate By 2021
11.3.3 Europe: PET Packaging Market, By Filling Technology
11.3.3.1 The Hot Fill Technology Segment is Projected to Grow at the Highest Rate By 2021
11.3.4 Europe: PET Packaging Market, By End Use
11.3.4.1 The Food Segment Dominated the End Use Segment in Europe in 2015
11.3.5 Europe: PET Packaging Market, By Form
11.3.5.1 Amorphous PET Segment Dominated the PET Packaging Market in Europe
11.3.6 Europe: PET Packaging Market, By Packaging Type
11.3.6.1 The Rigid Packaging Segment Dominated the PET Packaging Market in Europe
11.3.7 Germany
11.3.7.1 Germany: PET Packaging Market, By Pack Type
11.3.7.1.1 The Bottles & Jars Segment to Grow at the Highest Rate By 2021
11.3.7.2 Germany: PET Packaging Market, By Filling Technology
11.3.7.2.1 The Cold Fill Technology Segment is Projected to Grow at the Highest Rate By 2021
11.3.7.3 Germany: PET Packaging Market, By End Use
11.3.7.3.1 The Food Segment Held the Largest Share in Germany in 2015
11.3.8 Italy
11.3.8.1 Italy: PET Packaging Market, By Pack Type
11.3.8.1.1 The Bottls & Jars Segment to Grow at the Highest Rate By 2021
11.3.8.2 Italy: PET Packaging Market, By Filling Technology
11.3.8.2.1 The Hot Fill Technology Segment is Projected to Grow at the Highest Rate By 2021
11.3.8.3 Italy: PET Packaging Market, By End Use
11.3.8.3.1 The Beverages Segment to Grow at the Highest Rate By 2021
11.3.9 U.K.
11.3.9.1 U.K.: PET Packaging Market, By Pack Type
11.3.9.1.1 The Bottles & Jars Segment Held the Largest Share in 2015
11.3.9.2 U.K.: PET Packaging Market Size, By Filling Technology
11.3.9.2.1 The Hot Fill Technology Segment is Projected to Grow at the Highest Rate By 2021
11.3.9.3 U.K.: PET Packaging Market Size, By End Use
11.3.9.3.1 The Food Segment Dominated the PET Packaging Market in U.K. in 2015
11.3.10 France
11.3.10.1 France: PET Packaging Market, By Pack Type
11.3.10.1.1 The Bags & Pouches Segment Held the Second-Largest Share in 2015
11.3.10.2 France: PET Packaging Market, By Filling Technology
11.3.10.2.1 Aseptic Technology Segment Held The Second-Largest Share in 2015
11.3.10.3 France: PET Packaging Market, By End Use
11.3.10.3.1 The Beverages Segment to Grow at the Highest Rate By 2021
11.3.11 Spain
11.3.11.1 Spain: PET Packaging Market, By Pack Type
11.3.11.1.1 The Bottles & Jars Pack Type Segment to Grow at the Highest Rate By 2021
11.3.11.2 Spain: PET Packaging Market, By Filling Technology
11.3.11.2.1 The Hot Fill Technology Segment is Projected to Grow at the Highest Rate By 2021
11.3.11.3 Spain: PET Packaging Market, By End Use
11.3.11.3.1 The Food Segment to Grow at the Second-Highest Rate in Spain in 2015
11.3.12 Rest of Europe
11.3.12.1 Rest of Europe: PET Packaging Market, By Pack Type
11.3.12.1.1 The Bottles & Jars Segment to Grow at the Highest Rate By 2021
11.3.12.2 Rest of Europe: PET Packaging Market, By Filling Technology
11.3.12.2.1 The Cold Fill Technology Segment is Projected to Grow at the Second-Highest Rate By 2021
11.3.12.3 Rest of Europe: PET Packaging Market, By End Use
11.3.12.3.1 The Food Segment Held the Largest Share in Rest of Europe in 2015
11.4 Asia-Pacific
11.4.1 Asia-Pacific: PET Packaging Market, By Country
11.4.1.1 China is Projected to Be the Fastest-Growing Market By 2021
11.4.2 Asia-Pacific: PET Packaging Market, By Pack Type
11.4.2.1 The Bottles & Jars Projected to Grow at the Highest Rate By 2021
11.4.3 Asia-Pacific: PET Packaging Market, By Filling Technology
11.4.3.1 The Cold Fill Technology is Projected to Grow at the Highest Rate By 2021
11.4.4 Asia-Pacific: PET Packaging Market, By End-Use
11.4.4.1 The Food Segment Dominated the Asia-Pacific Market in 2015
11.4.5 Asia-Pacific: PET Packaging Market, By Form
11.4.5.1 Amorphous PET Dominated the PET Packaging Market in the Asia-Pacific Region
11.4.6 Asia-Pacific: PET Packaging Market, By Packaging Type
11.4.6.1 The Rigid Packaging Segment Dominated the Asia-Pacific PET Packaging Market
11.4.7 China
11.4.7.1 China: PET Packaging Market, By Pack Type
11.4.7.1.1 The Bottles & Jars Projected to Grow at the Highest Rate By 2021
11.4.7.2 China: PET Packaging Market, By Filling Technology
11.4.7.2.1 The Cold Fill Technology is Projected to Grow at the Highest Rate By 2021
11.4.7.3 China: PET Packaging Market, By End Use
11.4.7.3.1 The Food Segment Held the Largest Share in China in 2015
11.4.8 Japan
11.4.8.1 Japan: PET Packaging Market, By Pack Type
11.4.8.1.1 The Lids/Caps & Closures Segment Projected to Grow at the Second-Highest Rate By 2021
11.4.8.2 Japan: PET Packaging Market, By Filling Technology
11.4.8.2.1 The Cold Fill Technology is Projected to Grow at the Highest Rate By 2021
11.4.8.3 Japan: PET Packaging Market, By End Use
11.4.8.3.1 The Food Segment Dominated the Japanese PET Packaging Market, By End Use, in 2015
11.4.9 India
11.4.9.1 India: PET Packaging Market, By Pack Type
11.4.9.1.1 The Bottles & Jars Segment Projected to Grow at the Highest Rate in India By 2021
11.4.9.2 India: PET Packaging Market, By Filling Technology
11.4.9.2.1 The Hot Fill Technology is Projected to Grow at the Second-Highest Rate By 2021
11.4.9.3 India: PET Packaging Market, By End Use
11.4.9.3.1 The Beverage Segment is Projected to Grow at the Highest Rate During the Forecast Period
11.4.10 Australia
11.4.10.1 Australia: PET Packaging Market, By Pack Type
11.4.10.1.1 The Bottles & Jars Held the Largest Share in 2015
11.4.10.2 Australia: PET Packaging Market, By Filling Technology
11.4.10.2.1 The Hot Fill Technology is Projected to Grow at the Highest Rate By 2021
11.4.10.3 Australia: PET Packaging Market, By End Use
11.4.10.3.1 The Food Segment Dominated the Australian PET Packaging Market, By End Use, in 2015
11.4.11 Rest of Asia-Pacific
11.4.11.1 Rest of Asia-Pacific: PET Packaging Market, By Pack Type
11.4.11.1.1 The Bottles & Jars Projected to Grow at the Highest Rate By 2021
11.4.11.2 Rest of Asia-Pacific: PET Packaging Market, By Filling Technology
11.4.11.2.1 The Hot Fill Technology is Projected to Grow at the Highest Rate By 2021
11.4.11.3 Rest of Asia-Pacific: PET Packaging Market, By End Use
11.4.11.3.1 The Beverage Segment is Projected Grow at the Highest Rate in the Rest of Asia-Pacific in 2015
11.5 Rest of the World (RoW)
11.5.1 RoW: PET Packaging Market, By Country
11.5.1.1 Brazil is Projected to Be the Fastest-Growing Market By 2021
11.5.2 RoW: PET Packaging Market, By Pack Type
11.5.2.1 The Bottles & Jars Pack Type to Grow at the Highest Rate Through 2021
11.5.3 RoW: PET Packaging Market, By Filling Technology
11.5.3.1 The Hot Fill Technology is Projected to Grow at the Highest Rate Through 2021
11.5.4 RoW: PET Packaging Market, By End Use
11.5.4.1 The Food Segment Dominated the End Use Segment in RoW in 2015
11.5.5 RoW: PET Packaging Market, By Form
11.5.5.1 Amorphous PET Segment Dominated the PET Packaging Market in RoW
11.5.6 RoW: PET Packaging Market, By Packaging Type
11.5.6.1 The Rigid Packaging Segment Dominated the PET Packaging Market in RoW
11.5.7 Brazil
11.5.7.1 Brazil: PET Packaging Market, By Pack Type
11.5.7.1.1 The Bottles & Jars Segment to Grow at the Highest CAGR By 2021
11.5.7.2 Brazil: PET Packaging Market, By Filling Technology
11.5.7.2.1 The Cold Fill Technology Accounted for the Largest Share in 2015
11.5.7.3 Brazil: PET Packaging Market, By End Use
11.5.7.3.1 The Food Segment Dominated in Brazil in 2015
11.5.8 Argentina
11.5.8.1 Argentina: PET Packaging Market, By Pack Type
11.5.8.1.1 The Lids/Caps & Closures Segment to Grow at the Second-Highest Rate Through 2021
11.5.8.2 Argentina: PET Packaging Market, By Filling Technology
11.5.8.2.1 The Hot Fill Technology is Projected to Grow at the Highest Rate Through 2021
11.5.8.3 Argentina: PET Packaging Market, By End Use
11.5.8.3.1 The Beverage Segment to Grow at the Highest Rate Through 2021
11.5.9 South Africa
11.5.9.1 South Africa: PET Packaging Market, By Pack Type
11.5.9.1.1 The Bags & Pouches Accounted for the Second-Largest Share in 2015
11.5.9.2 South Africa: PET Packaging Market, By Filling Technology
11.5.9.2.1 The Cold Fill Technology is Projected to Grow at the Second-Highest Rate Through 2021
11.5.9.3 South Africa: PET Packaging Market, By End Use
11.5.9.3.1 The Food Segment in South Africa in 2015
11.5.10 Others in RoW
11.5.10.1 Others in RoW: PET Packaging Market, By Pack Type
11.5.10.1.1 The Bottles & Jars Pack Type to Grow at The Highest Rate Through 2021
12 Competitive Landscape (Page No. - 199)
12.1 Overview
12.2 Competitive Situations & Trends
12.3 Key Growth Strategies, 2012�2016
12.3.1 Mergers & Acquisitions
12.3.2 Agreements & Partnerships
12.3.3 Investments & Expansions
12.3.4 New Product Launches
13 Company Profiles (Page No. - 206)
(Company at A Glance, Business Overview, Products Offered, Key Strategy, Recent Developments, SWOT Analysis & MnM View)*
13.1 Introduction
13.2 E. I. Du Pont De Nemours and Company (Dupont)
13.3 CCL Industries, Inc.
13.4 Amcor Limited
13.5 Resilux NV
13.6 Smurfit Kappa Group PLC
13.7 Rexam PLC
13.8 Gerresheimer AG
13.9 Graham Packaging Company
13.10 Kl�ckner Pentaplast GmbH & Co. Kg
13.11 GTX Hanex Plastic Sp. Z O.O.
13.12 Berry Plastics Group Inc.
13.13 Dunmore
13.14 Huhtamaki Group
*Details on Company at A Glance, Recent Financials, Products Offered, Strategies & Insights, & Recent Developments Might Not Be Captured in Case of Unlisted Companies.
14 Appendix (Page No. - 238)
14.1 Insights of Industry Experts
14.2 Discussion Guide
14.3 Company Developments
14.3.1 Mergers & Acquisitions
14.3.2 Expansions & Investments
14.3.3 Agreements & Partnerships
14.3.4 New Product Launches
14.4 Knowledge Store: Marketsandmarkets� Subscription Portal
14.5 Introducing RT: Real Time Market Intelligence
14.6 Available Customizations
14.6.1 Product Analysis
14.6.2 Geographic Analysis
14.6.3 Company Information
14.7 Related Reports
List of Tables (197 Tables)
Table 1 Increasing Demand From End-Use Industries and Technological Advancements are the Major Drivers of the Market
Table 2 Fluctuations in Raw Material Prices May Restrain Market Growth
Table 3 Increasing Demand for Recycled PET Provides Opportunities for the Growth of the PET Packaging Market
Table 4 Challenges in PET Value Chain
Table 5 PET Packaging Market Size, By Form, 2014�2021 (USD Million)
Table 6 PET Packaging Market Size, By Form, 2014�2021 (KT)
Table 7 PET Packaging Market Size, By Packaging Type, 2014�2021 (USD Million)
Table 8 PET Packaging Market Size, By Packaging Type, 2014�2021 (KT)
Table 9 Rigid PET Packaging Market Size, By End-Use Industry, 2014�2021 (USD Million)
Table 10 Rigid PET Packaging Market Size, By End-Use Industry, 2014�2021 (KT)
Table 11 Flexible PET Packaging Market Size, By End-Use Industry, 2014�2021 (USD Million)
Table 12 Flexible PET Packaging Market Size, By End-Use Industry, 2014�2021 (KT)
Table 13 PET Pack Type & Their Applications
Table 14 PET Packaging Market Size, By Pack Type, 2014�2021 (USD Million)
Table 15 PET Packaging Market Size, By Pack Type, 2014�2021 (KT)
Table 16 Benefits of PET Trays
Table 17 PET Packaging Applications in Various Industries
Table 18 PET Packaging Market Size, By End-Use Industry, 2014�2021 (USD Million)
Table 19 PET Packaging Market Size, By End-Use Industry, 2014�2021 (KT)
Table 20 PET Packaging Market Size, By Pack Type, 2014�2021 (USD Million)
Table 21 PET Packaging Market Size, By Pack Type, 2014�2021 (KT)
Table 22 PET Packaging Market Size for Beverages, By Pack Type, 2014�2021 (USD Million)
Table 23 PET Packaging Market Size for Beverages, By Pack Type, 2014�2021 (KT)
Table 24 PET Packaging Market Size for Personal Care & Cosmetics, By Pack Type, 2014�2021 (USD Million)
Table 25 PET Packaging Market Size for Personal Care & Cosmetics, By Pack Type, 2014�2021 (KT)
Table 26 PET Packaging Market Size for Household Products, By Pack Type, 2014�2021 (USD Million)
Table 27 PET Packaging Market Size for Household Products, By Pack Type, 2014�2021 (KT)
Table 28 Advantages of PET in Pharmaceutical Packaging:
Table 29 PET Packaging Market Size for Pharmaceuticals, By Pack Type, 2014�2021 (USD Million)
Table 30 PET Packaging Market Size for Pharmaceuticals, By Pack Type, 2014�2021 (KT)
Table 31 PET Packaging Market Size for Other End-Use Industries, By Pack Type, 2014�2021 (USD Million)
Table 32 PET Packaging Market Size for Other End-Use Industries, By Pack Type, 2014�2021 (KT)
Table 33 PET Packaging Market Size, By Filling Technology, 2014�2021 (USD Million)
Table 34 PET Packaging Market Size, By Filling Technology, 2014�2021 (KT)
Table 35 Cold Fill Technologies
Table 36 North America: PET Packaging Market Size, By Country, 2014�2021 (USD Million)
Table 37 North America: PET Packaging Market Size, By Country, 2014�2021 (KT)
Table 38 North America: PET Packaging Market Size, By Pack Type, 2014�2021 (USD Million)
Table 39 North America: PET Packaging Market Size, By Pack Type, 2014�2021 (KT)
Table 40 North America: PET Packaging Market Size, By Filling Technology, 2014�2021 (USD Million)
Table 41 North America: PET Packaging Market Size, By Filling Technology, 2014�2021 (KT)
Table 42 North America: PET Packaging Market Size, By End-Use, 2014�2021 (USD Million)
Table 43 North America: PET Packaging Market Size, By End-Use, 2014�2021 (KT)
Table 44 North America: PET Packaging Market Size, By Form, 2014�2021 (USD Million)
Table 45 North America: PET Packaging Market Size, By Form, 2014�2021 (KT)
Table 46 North America: Market Size, By Packaging Type, 2014�2021 (USD Million)
Table 47 North America: Market Size, By Packaging Type, 2014�2021 (KT)
Table 48 U.S.: PET Packaging Market Size, By Pack Type, 2014�2021 (USD Million)
Table 49 U.S.: PET Packaging Market Size, By Pack Type, 2014�2021 (KT)
Table 50 U.S.: PET Packaging Market Size, By Filling Technology, 2014�2021 (USD Million)
Table 51 U.S.: PET Packaging Market Size, By Filling Technology, 2014�2021 (KT)
Table 52 U.S.: PET Packaging Market Size, By End-Use, 2014�2021 (USD Million)
Table 53 U.S.: PET Packaging Market Size, By End-Use, 2014�2021 (KT)
Table 54 Summary of Canadian Postconsumer Plastic Recycling, 2013
Table 55 Canada: PET Packaging Market Size, By Pack Type, 2014�2021 (USD Million)
Table 56 Canada: PET Packaging Market Size, By Pack Type, 2014�2021 (KT)
Table 57 Canada: PET Packaging Market Size, By Filling Technology, 2014�2021 (USD Million)
Table 58 Canada: PET Packaging Market Size, By Filling Technology, 2014�2021 (KT)
Table 59 Canada: PET Packaging Market Size, By End Use, 2014�2021 (USD Million)
Table 60 Canada: PET Packaging Market Size, By End-Use, 2014�2021 (KT)
Table 61 Mexico: PET Packaging Market Size, By Pack Type, 2014�2021 (USD Million)
Table 62 Mexico: PET Packaging Market Size, By Pack Type, 2014�2021 (KT)
Table 63 Mexico: PET Packaging Market Size, By Filling Technology, 2014�2021 (USD Million)
Table 64 Mexico: PET Packaging Market Size, By Filling Technology, 2014�2021 (KT)
Table 65 Mexico: PET Packaging Market Size, By End Use, 2014�2021 (USD Million)
Table 66 Mexico: PET Packaging Market Size, By End-Use, 2014�2021 (KT)
Table 67 Europe: PET Packaging Market Size, By Country, 2014�2021 (USD Million)
Table 68 Europe: PET Packaging Market Size, By Country, 2014�2021 (KT)
Table 69 Europe: PET Packaging Market Size, By Pack Type, 2014�2021 (USD Million)
Table 70 Europe: PET Packaging Market Size, By Pack Type, 2014�2021 (KT)
Table 71 Europe: PET Packaging Market Size, By Filling Technology, 2014�2021 (USD Million)
Table 72 Europe: PET Packaging Market Size, By Filling Technology, 2014�2021 (KT)
Table 73 Europe: PET Packaging Market Size, By End Use, 2014�2021 (USD Million)
Table 74 Europe: PET Packaging Market Size, By End Use, 2014�2021 (KT)
Table 75 Europe: Market Size, By Form, 2014�2021 (USD Million)
Table 76 Europe: Market Size, By Form, 2014�2021 (KT)
Table 77 Europe: Market Size, By Packaging Type, 2014�2021 (USD Million)
Table 78 Europe:Market Size, By Packaging Type, 2014�2021 (KT)
Table 79 Germany: PET Packaging Market Size, By Pack Type, 2014�2021 (USD Million)
Table 80 Germany: PET Packaging Market Size, By Pack Type, 2014�2021 (KT)
Table 81 Germany: PET Packaging Market Size, By Filling Technology, 2014�2021 (USD Million)
Table 82 Germany: PET Packaging Market Size, By Filling Technology, 2014�2021 (KT)
Table 83 Germany: PET Packaging Market Size, By End Use, 2014�2021 (USD Million)
Table 84 Germany: PET Packaging Market Size, By End Use, 2014�2021 (KT)
Table 85 Italy: PET Packaging Market Size, By Pack Type, 2014�2021 (USD Million)
Table 86 Italy: PET Packaging Market Size, By Pack Type, 2014�2021 (KT)
Table 87 Italy: PET Packaging Market Size, By Filling Technology, 2014�2021 (USD Million)
Table 88 Italy: PET Packaging Market, By Filling Technology, 2014�2021 (KT)
Table 89 Italy: PET Packaging Market Size, By End Use, 2014�2021 (USD Million)
Table 90 Italy: PET Packaging Market Size, By End Use, 2014�2021 (KT)
Table 91 Usage of PET Packaging on Different Vegetables: Studies Conducted By Different Organizations
Table 92 U.K.: PET Packaging Market Size, By Pack Type, 2014�2021 (USD Million)
Table 93 U.K.: PET Packaging Market Size, By Pack Type, 2014�2021 (KT)
Table 94 U.K.: PET Packaging Market Size, By Filling Technology, 2014�2021 (USD Million)
Table 95 U.K.: PET Packaging Market Size, By Filling Technology, 2014�2021 (KT)
Table 96 U.K.: PET Packaging Market Size, By End Use, 2014�2021 (USD Million)
Table 97 U.K.: PET Packaging Market Size, By End Use, 2014�2021 (KT)
Table 98 France: PET Packaging Market Size, By Pack Type, 2014�2021 (USD Million)
Table 99 France: Market Size, By Pack Type, 2014�2021 (KT)
Table 100 France: Market Size, By Filling Technology, 2014�2021 (USD Million)
Table 101 France: Market Size, By Filling Technology, 2014�2021 (KT)
Table 102 France: Market Size, By End Use, 2014�2021 (USD Million)
Table 103 France: Market Size, By End Use, 2014�2021 (KT)
Table 104 Spain: PET Packaging Market Size, By Pack Type, 2014�2021 (USD Million)
Table 105 Spain: PET Packaging Market Size, By Pack Type, 2014�2021 (KT)
Table 106 Spain: PET Packaging Market Size, By Filling Technology, 2014�2021 (USD Million)
Table 107 Spain: PET Packaging Market Size, By Filling Technology, 2014�2021 (KT)
Table 108 Spain: PET Packaging Market Size, By End Use, 2014�2021 (USD Million)
Table 109 Spain: PET Packaging Market Size, By End Use, 2014�2021 (KT)
Table 110 Rest of Europe: PET Packaging Market Size, By Pack Type, 2014�2021 (USD Million)
Table 111 Rest of Europe: Market Size, By Pack Type, 2014�2021 (KT)
Table 112 Rest of Europe: PET Packaging Market Size, By Filling Technology, 2014�2021 (USD Million)
Table 113 Rest of Europe: PET Packaging Market Size, By Filling Technology, 2014�2021 (KT)
Table 114 Rest of Europe: PET Packaging Market Size, By End Use, 2014�2021 (USD Million)
Table 115 Rest of Europe: Market Size, By End Use, 2014�2021 (KT)
Table 116 Asia-Pacific: PET Packaging Market Size, By Country, 2014�2021 (USD Million)
Table 117 Asia-Pacific: Market Size, By Country, 2014�2021 (KT)
Table 118 Asia-Pacific: Market Size, By Pack Type, 2014�2021 (USD Million)
Table 119 Asia-Pacific: Market Size, By Pack Type, 2014�2021 (KT)
Table 120 Asia-Pacific: Market Size, By Filling Technology, 2014�2021 (USD Million)
Table 121 Asia-Pacific: Market Size, By Filling Technology, 2014�2021 (KT)
Table 122 Asia-Pacific: Market Size, By End Use, 2014�2021 (USD Million)
Table 123 Asia-Pacific: Market Size, By End Use, 2014�2021 (KT)
Table 124 Asia-Pacific: Market Size, By Form, 2014�2021 (USD Million)
Table 125 Asia-Pacific: Market Size, By Form, 2014�2021 (KT)
Table 126 Asia-Pacific: Market Size, By Packaging Type, 2014�2021 (USD Million)
Table 127 Asia-Pacific: Market Size, By Packaging Type, 2014�2021 (KT)
Table 128 China: PET Packaging Market Size, By Pack Type, 2014�2021 (USD Million)
Table 129 China: Size, By Pack Type, 2014�2021 (KT)
Table 130 China: Market Size, By Filling Technology, 2014�2021 (USD Million)
Table 131 China: Market Size, By Filling Technology, 2014�2021 (KT)
Table 132 China: Market Size, By End Use, 2014�2021 (USD Million)
Table 133 China: Market Size, By End Use, 2014�2021 (KT)
Table 134 Evolution of the Use of PET Bottles and PET Bottle Recycling in Japan
Table 135 Japan: PET Packaging Market Size, By Pack Type, 2014�2021 (USD Million)
Table 136 Japan: Market Size, By Pack Type, 2014�2021 (KT)
Table 137 Japan: Market Size, By Filling Technology, 2014�2021 (USD Million)
Table 138 Japan: Market Size, By Filling Technology, 2014�2021 (KT)
Table 139 Japan: Market Size, By End Use, 2014�2021 (USD Million)
Table 140 Japan: Market Size, By End Use, 2014�2021 (KT)
Table 141 PET: Demand and Supply in India (KT)
Table 142 India: PET Packaging Market Size, By Pack Type, 2014�2021 (USD Million)
Table 143 India: Market Size, By Pack Type, 2014�2021 (KT)
Table 144 India: Market Size, By Filling Technology, 2014�2021 (USD Million)
Table 145 India: Market Size, By Filling Technology, 2014�2021 (KT)
Table 146 India: Market Size, By End Use, 2014�2021 (USD Million)
Table 147 India: Market Size, By End Use, 2014�2021 (KT)
Table 148 Production of Non-Alcoholic Ready-To-Drink Beverages in Australia, 2010-2013 (Ml)
Table 149 Australia: PET Packaging Market Size, By Pack Type, 2014�2021 (USD Million)
Table 150 Australia: Market Size, By Pack Type, 2014�2021 (KT)
Table 151 Australia: Market Size, By Filling Technology, 2014�2021 (USD Million)
Table 152 Australia: Market Size, By Filling Technology, 2014�2021 (KT)
Table 153 Australia: Market Size, By End Use, 2014�2021 (USD Million)
Table 154 Australia: Market Size, By End Use, 2014�2021 (KT)
Table 155 Rest of Asia-Pacific: PET Packaging Market Size, By Pack Type, 2014�2021 (USD Million)
Table 156 Rest of Asia-Pacific: Market Size, By Pack Type, 2014�2021 (KT)
Table 157 Rest of Asia-Pacific: Market Size, By Filling Technology, 2014�2021 (USD Million)
Table 158 Rest of Asia-Pacific: Market Size, By Filling Technology, 2014�2021 (KT)
Table 159 Rest of Asia-Pacific: Market Size, By End Use, 2014�2021 (USD Million)
Table 160 Rest of Asia-Pacific: Market Size, By End Use, 2014�2021 (KT)
Table 161 RoW: PET Packaging Market Size, By Country, 2014�2021 (USD Million)
Table 162 RoW: PET Packaging Market Size, By Country, 2014�2021 (KT)
Table 163 RoW: PET Packaging Market Size, By Pack Type, 2014�2021 (USD Million)
Table 164 RoW: PET Packaging Market Size, By Pack Type, 2014�2021 (KT)
Table 165 RoW: PET Packaging Market Size, By Filling Technology, 2014�2021 (USD Million)
Table 166 RoW: PET Packaging Market Size, By Filling Technology, 2014�2021 (KT)
Table 167 RoW: PET Packaging Market Size, By End Use, 2014�2021 (USD Million)
Table 168 RoW: PET Packaging Market Size, By End Use, 2014�2021 (KT)
Table 169 RoW: PET Packaging Market Size, By Form, 2014�2021 (USD Million)
Table 170 RoW: PET Packaging Market Size, By Form, 2014�2021 (KT)
Table 171 RoW: PET Packaging Market Size, By Packaging Type, 2014�2021 (USD Million)
Table 172 RoW: PET Packaging Market Size, By Packaging Type, 2014�2021 (KT)
Table 173 Brazil: PET Packaging Market Size, By Pack Type, 2014�2021 (USD Million)
Table 174 Brazil: Market Size, By Pack Type, 2014�2021 (KT)
Table 175 Brazil: Market Size, By Filling Technology, 2014�2021 (USD Million)
Table 176 Brazil: Market Size, By Filling Technology, 2014�2021 (KT)
Table 177 Brazil: Market Size, By End Use, 2014�2021 (USD Million)
Table 178 Brazil: PET Packaging Market Size, By End Use, 2014�2021 (KT)
Table 179 Argentina: PET Packaging Market Size, By Pack Type, 2014�2021 (USD Million)
Table 180 Argentina: Market Size, By Pack Type, 2014�2021 (KT)
Table 181 Argentina:Market Size, By Filling Technology, 2014�2021 (USD Million)
Table 182 Argentina: Market Size, By Filling Technology, 2014�2021 (KT)
Table 183 Argentina: Market Size, By End Use, 2014�2021 (USD Million)
Table 184 Argentina: Market Size, By End Use, 2014�2021 (KT)
Table 185 South Africa: PET Packaging Market Size, By Pack Type, 2014�2021 (USD Million)
Table 186 South Africa: Market Size, By Pack Type, 2014�2021 (KT)
Table 187 South Africa: Market Size, By Filling Technology, 2014�2021 (USD Million)
Table 188 South Africa: Market Size, By Filling Technology, 2014�2021 (KT)
Table 189 South Africa: Market Size, By End Use, 2014�2021 (USD Million)
Table 190 South Africa: Market Size, By End Use, 2014�2021 (KT)
Table 191 Others in RoW: PET Packaging Market Size, By Pack Type, 2014�2021 (USD Million)
Table 192 Others in RoW: PET Packaging Market Size, By Pack Type, 2014�2021 (KT)
Table 193 Mergers & Acquisitions, 2015-2016
Table 194 Agreements & Partnerships, 2014�2015
Table 195 Investments & Expansions, 2014�2015
Table 196 New Product Launches, 2014�2016
Table 197 Smurfit Kappa: List of Awards From Packaging Associations
List of Figures (74 Figures)
Figure 1 Global PET Packaging Market Segmentation
Figure 2 Global PET Packaging: Research Design
Figure 3 Breakdown of Primary Interviews: By Company Type, Designation, and Region
Figure 4 Market Size Estimation Methodology: Bottom-Up Approach
Figure 5 Market Size Estimation Methodology: Top-Down Approach
Figure 6 Data Triangulation Methodology
Figure 7 Assumptions for This Study
Figure 8 Limitations of This Study
Figure 9 Bottles & Jars Segment is Projected to Be the Leader in the PET Packaging Market, in Terms of Value, in 2021 (USD Billion)
Figure 10 PET Packaging Market Size, By End-Use Industry, 2016 vs 2021 (USD Billion)
Figure 11 Asia-Pacific is Projected to Be the Fastest-Growing Region for the PET Packaging Market
Figure 12 Leading Market Players Adopted Mergers & Acquisitions as the Key Strategy From 2012 to 2016
Figure 13 Attractive Market Opportunities in the PET Packaging Market
Figure 14 Germany is Projected to Be the Fastest-Growing Market During the Forecast Period
Figure 15 Bottles & Jars Segment Dominated the PET Packaging Market Through the Forecast Period
Figure 16 The Food Segment Captured the Largest Share in the Asia-Pacific Region in 2015
Figure 17 Asia-Pacific is Projected to Be the Prime Revenue Generator in the PET Packaging Market By 2021
Figure 18 PET Packaging Market: Developing vs Developed Countries
Figure 19 Food Segment Dominated the PET Packaging Market
Figure 20 Beverage Segment is the Fastest Growing Market
Figure 21 PET Was First Synthesized in the Mid-1940s
Figure 22 Trends in the PET Packaging Industry
Figure 23 GDP and Packaging Usage, Per Capita Consumption of Major Countries
Figure 24 PET Packaging Market Segmentation
Figure 25 Increasing Demand From End-Use Industries is the Major Driver of the Market
Figure 26 Beer Production, By Country, 2013
Figure 27 Reduction in Weight of PET Bottles as A Result of Technological Advancements
Figure 28 PET Packaging Resin Prices in the U.S., Western Europe, and China, 2004�2013
Figure 29 Global PET Resins Prices, 2011 to April 2016
Figure 30 Amorphous PET Segment Projected to Lead the Market Through 2021
Figure 31 Rigid Packaging Projected to Dominate the PET Packaging Market Through 2021
Figure 32 PET Packaging Market Size, By Pack Type, 2014�2021 (KT)
Figure 33 Food to Dominate the PET Packaging Market By 2021 (USD Billion)
Figure 34 Cold Fill Filling Technology Dominated the Market Between 2016 and 2021 (USD Billion)
Figure 35 Hot Filling Process
Figure 36 Aseptic Filling Process
Figure 37 North America: Market Snapshot
Figure 38 Bags & Pouches in Canada Expected to Grow at the Highest CAGR During the Forecast Period
Figure 39 U.S. Beverages Market, 2009�2014
Figure 40 U.S. Pepsico Carbonated Soft Drink Containers Manufacturing, 2012
Figure 41 Canadian Retail Landscape, 2013
Figure 42 Postconsumer Plastic Recycled in Canada By Resin (MT)
Figure 43 Mexican Food Retail Landscape, 2014
Figure 44 Europe: Market Snapshot
Figure 45 Germany: Organic Packaged Food & Beverages Market, 2010-2014
Figure 46 France: Organic Beverages and Packaged Food Market, 2010-2014
Figure 47 Spain: Organic Packaged Food Market, 2010-2014
Figure 48 RoW: Market Snapshot
Figure 49 Brazil: Food & Beverage Production, 2009�2014 (USD Billion)
Figure 50 Brazil: PET Packaging Volume and Usage Share in the End-Use Industries in 2013
Figure 51 Argentinean Polymer Production Share, 2011
Figure 52 South African Food Industry, 2014
Figure 53 South African PET Recycling, 2014
Figure 54 Companies Adopted Mergers & Acquisitions as Their Key Growth Strategies Over the Last Five Years, 2012�2016
Figure 55 Growth Comparison of Key Players in the PET Packaging Market, 2013�2015
Figure 56 The Year 2015 Was the Most Active in the PET Packaging Market, in Terms of Developments
Figure 57 Mergers and Acquisitions Were the Most Dominant Development Types, While Amcor Observed to Be the Most Active Player, 2012�2016
Figure 58 Mergers & Acquisitions: the Key Strategy, 2011�2016
Figure 59 Geographic Revenue Mix of Top Five Players
Figure 60 E. I. Du Pont De Nemours and Company: Company Snapshot
Figure 61 SWOT Analysis: E. I. Du Pont De Nemours and Company
Figure 62 CCL Industries, Inc.: Company Snapshot
Figure 63 SWOT Analysis: CCL Industries, Inc.
Figure 64 Amcor Limited: Company Snapshot
Figure 65 SWOT Analysis: Amcor Limited
Figure 66 Resilux NV: Company Snapshot
Figure 67 SWOT Analysis: Resilux NV
Figure 68 Smurfit Kappa Group PLC: Company Snapshot
Figure 69 SWOT Analysis: Smurfit Kappa Group PLC
Figure 70 Rexam PLC.: Company Snapshot
Figure 71 Gerresheimer AG.: Company Snapshot
Figure 72 Kl�ckner Pentaplast GmbH & Co. Kg: Company Snapshot
Figure 73 Berry Plastics Group Inc.: Company Snapshot
Figure 74 Huhtamaki Group : Company Snapshot


Growth opportunities and latent adjacency in PET Packaging Market