Packaging Coating Additives Market by Function (Slip, Anti-Static, Anti-fog, Anti-block, Antimicrobial), Formulation (Water-based, Solvent-based, Powder-based), Application (Food, Industrial, Healthcare, Consumer), and Region - Global forecast to 2023


[124 Pages Report] Packaging coating additives are used to improve the physical, mechanical, thermal, and chemical properties of packaging. The study covers various additives such as anti-fog, anti-block, antimicrobial, slip, and antistatic. These external additives serve different purposes and are widely used in the packaging industry. Packaging coating additives are dissolved in an appropriate solvent or water and can be applied on the surface of plastic film or sheet through coating, dipping or spraying.
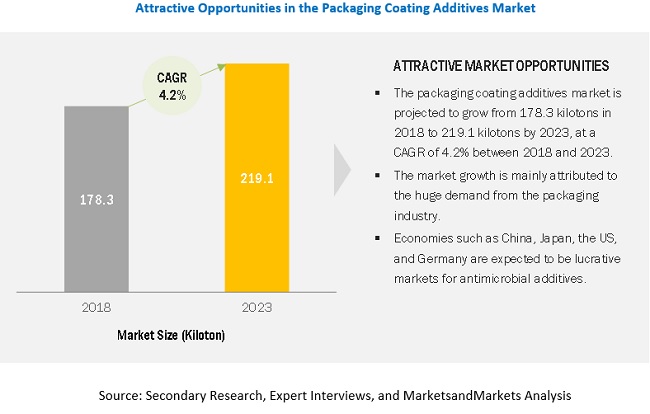
The market size of packaging coating additives is estimated at USD 688.4 million in 2018 and is projected to reach USD 874.5 million by 2023, at a CAGR of 4.9%. The packaging coating additives market is projected to grow from 178.3 kilotons in 2018 to 219.1 kilotons by2023, at a CAGR of 4.4% between 2018 and 2023. The market is expected to grow at the highest CAGR in APAC, in terms of both value and volume. This is attributed to the high economic growth of countries in this region, which, in turn, has led to the growth of the packaging industry in China, South Korea, Japan, and India, among other countries in the region. However, stringent government regulations regarding the use of plastics are expected to hamper the growth of the packaging coating additives market. Volatility in raw material prices might adversely affect the overall cost of production incurred by the packaging coating additives manufacturers.
“Anti-block additives segment projected To lead the packaging coating additives market from 2018 to 2023.”
The growth of this segment can be attributed to the rising demand for high-quality packaging coating additives from the food packaging and industrial packaging industries
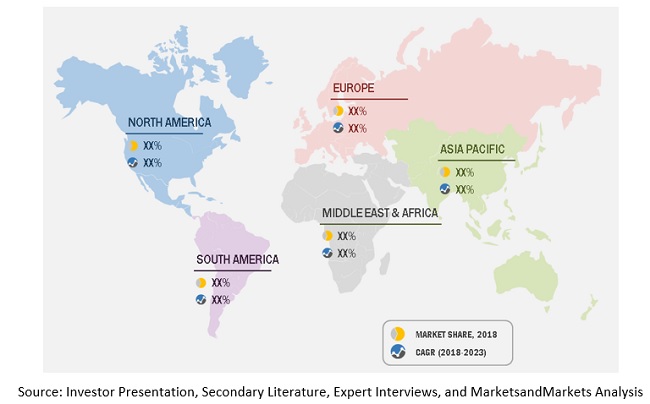
“APAC to account for the largest market size during the forecast period.”
The Asia Pacific region is estimated to account for the largest share of the packaging coating additives market in 2018, in terms of value. It is also projected to grow at the highest CAGR during the forecast period. The growth of the Asia Pacific packaging coating additives market can be attributed to the flourishing packaging industries in emerging economies such as China and India.
Market Dynamics
Driver: Increasing health awareness
The awareness about health-related issues is growing due to the increasing incidents of nosocomial infections and recent epidemic outbreaks of life-threatening diseases such as H5N1 Avian influenza and H1N1 flu (swine flu). There is a growing demand for antimicrobial packaging additives from various sectors, such as healthcare and medicine. Antimicrobial packaging additives possess properties such as high antimicrobial activity, hardness, durability, and transparency. They are used in non-toxic plastic equipment. With the rise in hospital-acquired infections, antimicrobial additives are being used in air vents to prevent the transfer of communicable diseases. Rising consumer awareness regarding health and hygiene is expected to augment the demand for antimicrobial additives, which, in turn, will increase the demand for packaging coating additives.
Restraint: Volatility of raw material prices
The volatility of the prices of raw materials used in the manufacturing of packaging coating additives is one of the major challenges faced by the manufacturers of packaging coating additives. For Instance, fluctuations in prices of oil & gas have led to an increase in the prices of raw materials used in the manufacturing of antistatic agents. Similarly, fluctuating prices of raw materials used in the production of antimicrobial additives are one of the key setbacks that affect the growth of the antimicrobial additives market. The primary raw materials used in the manufacture of antimicrobial additives products are silver, copper, and zinc. The cost of these raw materials is very high. The high cost of silver antimicrobials limits their use in various products, especially in regions such as Asia Pacific and South America. Volatility in the price of these materials restrains the growth of the packaging coating additives market.
Opportunity: Emerging markets creating strong growth opportunities
Emerging markets for packaging coating additives such as China, India, Indonesia, and Brazil, among others, present a high growth opportunity for players in the packaging coating additives market. The market in China, India, Indonesia, and Brazil is expected to grow rapidly due to the growth in end-use industries. The growth opportunities in these countries are expected to support the growth of the packaging coating additives market in the coming years. Major players such as Clariant AG (Switzerland) and BASF SE (Germany) have framed their strategies to lay more importance in penetrating and creating bases in these emerging markets.
Challenge: Managing plastic waste from different industries
The packaging industry produces large quantities of waste, which are not only difficult to dispose of but also harm the environment. Accumulation of plastic products on the earth’s surface has an adverse impact on human life and wildlife habitats. As the decomposition process of plastic products is very slow, plastic waste creates a health hazard for living organisms on land, air, and water. Due to the durability of low-cost plastics, they are widely used in manufacturing various packaging materials that are used in food & beverage packaging films and agricultural films, among others. It is difficult for end-users to manage plastic wastes that are generated from these industries. Hence, several countries are imposing bans on plastic products and are implementing regulatory norms regarding the use of plastic packaging products, which affects the growth of the packaging sector. As the packaging industry is one of the key end-use industries for packaging coating additives market, the decline in demand for plastic packaging products serves to be a key challenge for the manufacturers of packaging coating additives.
Scope of the Report
|
Report Metric |
Details |
|
Market size available for years |
2016 – 2023 |
|
Base year considered |
2017 |
|
Forecast period |
2018 -2023 |
|
Forecast units |
Million/Billion (USD) |
|
Segments covered |
Function, Formulation, Application, and Region |
|
Geographies covered |
North America, Europe, APAC, RoW (South America, Middle East, and Africa) |
|
Companies covered |
Key market players, including |
The research report categorizes the Packaging Coating Additives market to forecast the revenues and analyze the trends in each of the following sub-segments:
Please visit 360Quadrants to see the vendor listing of Top 21 Flexible Packaging Companies, Worldwide 2023
Packaging Coating Additives Market, By Function
- Slip
- Antistatic
- Anti-Fog
- Anti-Block
- Antimicrobial
Packaging Coating Additives Market, By Formulation
- Water-based
- Solvent-based
- Powder-based
Packaging Coating Additives Market, By Application
- Food Packaging
- Industrial Packaging
- Healthcare Packaging
- Consumer Packaging
- Others*
Packaging Coating Additives Market, By Geography
- North America
- Europe
- Asia Pacific (APAC)\
- Middle East & Africa
- South America
Key Market Players
Croda International Plc (UK), BASF SE (Germany), Clariant AG (Switzerland), Lonza Group (Switzerland), 3M Company (US), Arkema Group (France), Evonik Industries AG (Germany), Solvay S.A. (Belgium).
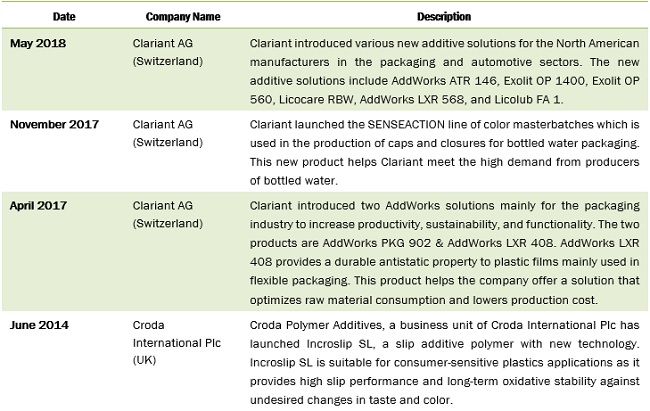
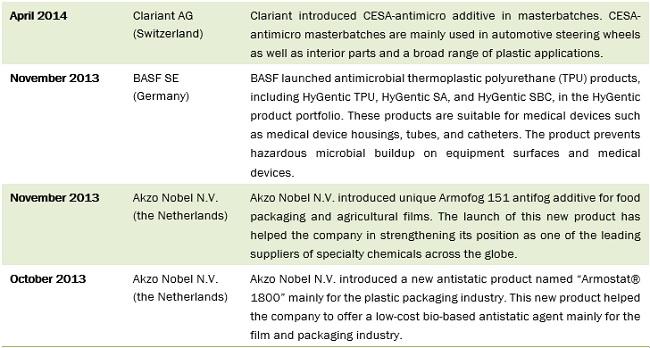
Recent Developments
Critical questions the report answers:
- What are the upcoming trends for the Packaging Coating Additives market?
- Which segment provides the most opportunity for growth?
- Who are the leading vendors operating in this market?
- What are the opportunities for new market entrants?
To speak to our analyst for a discussion on the above findings, click Speak to Analyst
 Exclusive indicates content/data unique to MarketsandMarkets and not available with any competitors.
Table of Contents
1 Introduction (Page No. - 14)
1.1 Objectives of the Study
1.2 Market Definition
1.3 Study Scope
1.3.1 Markets Covered
1.3.2 Years Considered for the Study
1.4 Currency
1.5 Units Considered
1.6 Stakeholders
2 Research Methodology (Page No. - 17)
2.1 Research Data
2.1.1 Secondary Data
2.1.1.1 Key Data From Secondary Sources
2.1.2 Primary Data
2.1.2.1 Key Data From Primary Sources
2.1.2.2 Key Industry Insights
2.1.2.3 Breakdown of Primaries
2.2 Market Size Estimation
2.3 Market Breakdown and Data Triangulation
2.4 Assumptions
2.5 Limitations
3 Executive Summary (Page No. - 26)
3.1 Packaging Coating Additives Market, By Function
3.2 Packaging Coating Additives Market: Application Shares, By Region
3.3 Packaging Coating Additives Market, By Region
4 Premium Insights (Page No. - 30)
4.1 Attractive Growth Opportunities in the Packaging Coating Additives Market
4.2 Packaging Coating Additives Market, By Application
4.3 Packaging Coating Additives Market, By Function and Formulation
4.4 Packaging Coating Additives Market, By Country
4.5 Packaging Coating Additives Market: Developing vs Developed Economies
5 Market Overview (Page No. - 33)
5.1 Introduction
5.2 Market Dynamics
5.2.1 Drivers
5.2.1.1 Increasing Disposable Income of the Middle-Class Population in the Emerging Economies
5.2.1.2 Increasing Health Awareness
5.2.2 Restraints
5.2.2.1 Stringent Environmental and Government Regulations
5.2.2.2 Volatility of Raw Material Prices
5.2.3 Opportunities
5.2.3.1 Emerging Markets Creating Strong Growth Opportunities
5.2.3.2 Increasing Demand for Bio-Based Slip Additives
5.2.4 Challenges
5.2.4.1 Managing Plastic Waste From Different Industries
5.3 Porter’s Five Forces Analysis
5.3.1 Threat of New Entrants
5.3.2 Threat of Substitutes
5.3.3 Bargaining Power of Buyers
5.3.4 Bargaining Power of Suppliers
5.3.5 Intensity of Competitive Rivalry
6 Packaging Coating Additives Market, By Function (Page No. - 39)
6.1 Introduction
6.2 Anti-Block
6.3 Anti-Fog
6.4 Antimicrobial
6.5 Antistatic
6.6 Slip
7 Packaging Coating Additives Market, By Formulation (Page No. - 42)
7.1 Introduction
7.2 Water-Based
7.3 Solvent-Based
7.4 Powder-Based
8 Packaging Coating Additives Market, By Application (Page No. - 45)
8.1 Introduction
8.2 Food Packaging
8.3 Industrial Packaging
8.4 Healthcare Packaging
8.5 Consumer Packaging
8.6 Others
9 Packaging Coating Additives Market, By Region (Page No. - 48)
9.1 Introduction
9.2 North America
9.2.1 US
9.2.2 Canada
9.2.3 Mexico
9.3 Europe
9.3.1 Germany
9.3.2 UK
9.3.3 Italy
9.3.4 France
9.3.5 Russia
9.3.6 Netherlands
9.3.7 Czech Republic
9.3.8 Rest of Europe
9.4 Asia Pacific
9.4.1 China
9.4.2 India
9.4.3 Japan
9.4.4 Indonesia
9.4.5 Rest of Asia Pacific
9.5 Middle East & Africa
9.5.1 South Africa
9.5.2 Saudi Arabia
9.5.3 Rest of Middle East & Africa
9.6 South America
9.6.1 Brazil
9.6.2 Argentina
9.6.3 Rest of South America
10 Competitive Landscape (Page No. - 83)
10.1 Overview
10.2 Ranking of Key Market Players
10.2.1 Market Ranking Analysis, 2017
10.3 Competitive Scenario
10.3.1 New Product Developments & Launches
10.3.2 Acquisitions
10.3.3 Expansion
10.3.4 Partnerships
10.3.5 Investments
11 Company Profiles (Page No. - 90)
(Business Overview, Products Offered, Recent Developments, SWOT Analysis, MnM View)*
11.1 Croda International PLC
11.2 BASF SE
11.3 Clariant AG
11.4 Lonza Group
11.5 3M
11.6 Arkema Group
11.7 Evonik Industries AG
11.8 Solvay S.A.
11.9 Akzo Nobel N.V.
11.10 Daikin Industries, Ltd.
*Details on Business Overview, Products Offered, Recent Developments, SWOT Analysis, MnM View Might Not Be Captured in Case of Unlisted Companies.
11.11 Other Key Players
11.11.1 Ampacet Corporation
11.11.2 Addcomp Holland Bv
11.11.3 KAO Corporation
11.11.4 Abril Industrial Waxes Ltd
11.11.5 PCC Chemax, Inc.
11.11.6 Munzing Chemie GmbH
12 Appendix (Page No. - 115)
12.1 Insights From Industry Experts
12.2 Discussion Guide
12.3 Knowledge Store: Marketsandmarkets Subscription Portal
12.4 Available Customizations
12.5 Related Reports
12.6 Author Details
List of Tables (78 Tables)
Table 1 Packaging Coating Additives Market Snapshot
Table 2 Packaging Coating Additives Market, By Function, 2016–2023 (Kilotons)
Table 3 Packaging Coating Additives Market, By Function, 2016–2023 (USD Million)
Table 4 Packaging Coating Additives Market, By Formulation, 2016–2023 (Kilotons)
Table 5 Packaging Coating Additives Market, By Formulation, 2016–2023 (USD Million)
Table 6 Packaging Coating Additives Market, By Application, 2016–2023 (Kilotons)
Table 7 Packaging Coating Additives Market, By Application, 2016–2023 (USD Million)
Table 8 Packaging Coating Additives Market, By Region, 2016–2023 (Kilotons)
Table 9 Packaging Coating Additives Market, By Region, 2016–2023 (USD Million)
Table 10 North America By Market, By Country, 2016–2023 (Kilotons)
Table 11 North America By Market, By Country, 2016–2023 (USD Million)
Table 12 North America By Market, By Application, 2016–2023 (Kilotons)
Table 13 North America By Market, By Application, 2016–2023 (USD Million)
Table 14 US By Market, By Application, 2016–2023 (Kilotons)
Table 15 US By Market, By Application, 2016–2023 (USD Million)
Table 16 Canada By Market, By Application, 2016–2023 (Kilotons)
Table 17 Canada By Market, By Application, 2016–2023 (USD Million)
Table 18 Mexico By Market, By Application, 2016–2023 (Kilotons)
Table 19 Mexico By Market, By Application, 2016–2023 (USD Million)
Table 20 Europe By Market Size, By Country, 2016–2023 (Kilotons)
Table 21 Europe By Market Size, By Country, 2016–2023 (USD Million)
Table 22 Europe By Market, By Application, 2016–2023 (Kilotons)
Table 23 Europe By Market, By Application, 2016–2023 (USD Million)
Table 24 Germany By Market, By Application, 2016–2023 (Kilotons)
Table 25 Germany By Market, By Application, 2016–2023 (USD Million)
Table 26 UK By Market, By Application, 2016–2023 (Kilotons)
Table 27 UK By Market, By Application, 2016–2023 (USD Million)
Table 28 Italy By Market, By Application, 2016–2023 (Kilotons)
Table 29 Italy By Market, By Application, 2016–2023 (USD Million)
Table 30 France By Market, By Application, 2016–2023 (Kilotons)
Table 31 France By Market, By Application, 2016–2023 (USD Million)
Table 32 Russia By Market, By Application, 2016–2023 (Kilotons)
Table 33 Russia By Market, By Application, 2016–2023 (USD Million)
Table 34 Netherlands By Market, By Application, 2016–2023 (Kilotons)
Table 35 Netherlands By Market, By Application, 2016–2023 (USD Million)
Table 36 Czech Republic By Market, By Application, 2016–2023 (Kilotons)
Table 37 Czech Republic By Market, By Application, 2016–2023 (USD Million)
Table 38 Rest of Europe By Market, By Application, 2016–2023 (Kilotons)
Table 39 Rest of Europe By Market, By Application, 2016–2023 (USD Million)
Table 40 Asia Pacific By Market Size, By Country, 2016–2023 (Kilotons)
Table 41 Asia Pacific By Market Size, By Country, 2016–2023 (USD Million)
Table 42 Asia Pacific By Market, By Application, 2016–2023 (Kilotons)
Table 43 Asia Pacific By Market, By Application, 2016–2023 (USD Million)
Table 44 China By Market, By Application, 2016–2023 (Kilotons)
Table 45 China By Market, By Application, 2016–2023 (USD Million)
Table 46 India By Market, By Application, 2016–2023 (Kilotons)
Table 47 India By Market, By Application, 2016–2023 (USD Million)
Table 48 Japan By Market, By Application, 2016–2023 (Kilotons)
Table 49 Japan By Market, By Application, 2016–2023 (USD Million)
Table 50 Indonesia By Market, By Application, 2016–2023 (Kilotons)
Table 51 Indonesia By Market, By Application, 2016–2023 (USD Million)
Table 52 Rest of Asia Pacific By Market, By Application, 2016–2023 (Kilotons)
Table 53 Rest of Asia Pacific By Market, By Application, 2016–2023 (USD Million)
Table 54 Middle East & Africa By Market Size, By Country, 2016–2023 (Kilotons)
Table 55 Middle East & Africa By Market Size, By Country, 2016–2023 (USD Million)
Table 56 Middle East & Africa By Market, By Application, 2016–2023 (Kilotons)
Table 57 Middle East & Africa By Market, By Application, 2016–2023 (USD Million)
Table 58 South Africa By Market, By Application, 2016–2023 (Kilotons)
Table 59 South Africa By Market, By Application, 2016–2023 (USD Million)
Table 60 Saudi Arabia By Market, By Application, 2016–2023 (Kilotons)
Table 61 Saudi Arabia By Market, By Application, 2016–2023 (USD Million)
Table 62 Rest of Middle East & Africa By Market, By Application, 2016–2023 (Kilotons)
Table 63 Rest of Middle East & Africa By Market, By Application, 2016–2023 (USD Million)
Table 64 South America By Market Size, By Country, 2016–2023 (Kilotons)
Table 65 South America By Market Size, By Country, 2016–2023 (USD Million)
Table 66 South America By Market, By Application, 2016–2023 (Kilotons)
Table 67 South America By Market, By Application, 2016–2023 (USD Million)
Table 68 Brazil By Market, By Application, 2016–2023 (Kilotons)
Table 69 Brazil By Market, By Application, 2016–2023 (USD Million)
Table 70 Argentina By Market, By Application, 2016–2023 (Kilotons)
Table 71 Argentina By Market, By Application, 2016–2023 (USD Million)
Table 72 Rest of South America By Market, By Application, 2016–2023 (Kilotons)
Table 73 Rest of South America By Market, By Application, 2016–2023 (USD Million)
Table 74 New Product Developments & Launches, January 2013-September 2018
Table 75 Acquisitions, January 2013-September 2018
Table 76 Expansion, January 2013-September 2018
Table 77 Partnerships, January 2013-September 2018
Table 78 Investments, January 2013-September 2018
List of Figures (43 Figures)
Figure 1 Packaging Coating Additives Market: Research Design
Figure 2 Breakdown of Primary Interviews, By Company Type, Designation, and Region
Figure 3 Market Size Estimation: Top-Down Approach
Figure 4 Market Size Estimation: Bottom-Up Approach
Figure 5 Data Triangulation
Figure 6 Anti-Block Additives Segment Projected to Lead the Packaging Coating Additives Market From 2018 to 2023
Figure 7 Asia Pacific Expected to Be the Largest Market for All Application Segments of Packaging Coating Additives in 2018
Figure 8 Asia Pacific Packaging Coating Additives Market Projected to Grow at the Highest CAGR Between 2018 and 2023
Figure 9 Increasing Demand From Various Applications Projected to Drive the Growth of Packaging Coating Additives Market Across the Globe
Figure 10 Food Packaging Application Segment Projected to Grow at the Highest CAGR From 2018 to 2023
Figure 11 Anti-Block Function and Water-Based Formulation Segments are Estimated to Account for Largest Shares of Packaging Coating Additives Market in 2018
Figure 12 China Packaging Coating Additives Market Projected to Grow at the Highest CAGR From 2018 to 2023
Figure 13 US Projected to Be the Largest Market for Packaging Coating Additives Among Developed Economies
Figure 14 Packaging Coating Additives Market Dynamics
Figure 15 Porter’s Five Forces Analysis
Figure 16 Anti-Block Segment Expected to Lead Packaging Coating Additives Market During Forecast Period
Figure 17 Water-Based Segment Expected to Lead Packaging Coating Additives Market During Forecast Period
Figure 18 Food Packaging Segment Projected to Lead Packaging Coating Additives Market During Forecast Period
Figure 19 Packaging Coating Additives Market in China to Grow at the Highest CAGR During the Forecast Period
Figure 20 Asia Pacific Expected to Be the Fastest-Growing Packaging Coating Additives Market During Forecast Period
Figure 21 North America Packaging Coating Additives Market Snapshot
Figure 22 Europe Packaging Coating Additives Market Snapshot
Figure 23 Asia Pacific Packaging Coating Additives Market Snapshot
Figure 24 Middle East & Africa Packaging Coating Additives Market Snapshot
Figure 25 South America Packaging Coating Additives Market Snapshot
Figure 26 Expansions Was the Most Preferred Strategy By Key Companies in the Past Few Years
Figure 27 Croda International PLC: Company Snapshot
Figure 28 Croda International PLC: SWOT Analysis
Figure 29 BASF SE: Company Snapshot
Figure 30 BASF SE: SWOT Analysis
Figure 31 Clariant AG: Company Snapshot
Figure 32 Clariant AG: SWOT Analysis
Figure 33 Lonza Group: Company Snapshot
Figure 34 Lonza Group: SWOT Analysis
Figure 35 3M: Company Snapshot
Figure 36 3M: SWOT Analysis
Figure 37 Arkema Group: Company Snapshot
Figure 38 Arkema Group: SWOT Analysis
Figure 39 Evonik Industries AG: Company Snapshot
Figure 40 Evonik Industries AG: SWOT Analysis
Figure 41 Solvay S.A.: Company Snapshot
Figure 42 Akzo Nobel N.V.: Company Snapshot
Figure 43 Akzo Nobel N.V.: SWOT Analysis


Growth opportunities and latent adjacency in Packaging Coating Additives Market