Oxygenated Solvents Market by Source (Conventional and Bio & Green), Type (Alcohols, Esters, Glycols, Glycol Ethers, Ketones), Application (Paints & Coatings, Pharmaceuticals, Cleaners, and Crop Protection), Region - Global Forecast to 2022


Thec oxygenated solvents market is projected to reach USD 32.27 Billion by 2022, at a CAGR of 7.8%. The base year that has been considered for this study on the oxygenated solvents market is 2016, while the forecast period is between 2017 and 2022.
Objectives of the Oxygenated Solvents Market Report are as Follows
- Define and segment the oxygenated solvents market on the basis of source, type, application, and region
- Provide detailed information regarding the major factors drivers, restraints, opportunities, and challenges influencing the growth of the oxygenated solvent market
- Analyze and forecast the size of the oxygenated solvents market, in terms of value
- Analyze the segmentation and project the size of the oxygenated solvent market, in terms of value for five key regions, namely, North America, Europe, Asia-Pacific, South America, and the Middle East & Africa
- Strategically profile the key players operating in the oxygenated solvents market
- Analyze competitive developments, such as new product launches, expansions, mergers & acquisitions, and partnerships & agreements taking place in the oxygenated solvent market
Both, the top-down and bottom-up approaches have been used to estimate and validate the size of the oxygenated solvents market, and to determine the sizes of various other dependent submarkets. The research study that has been employed involved extensive use of secondary sources, directories, and databases, such as Hoovers, Bloomberg, Chemical Weekly, Factiva, and other government and private websites to identify and collect information useful for the technical, market-oriented, and commercial study of the oxygenated solvents market.
To know about the assumptions considered for the study, download the pdf brochure
Key Players in Oxygenated Solvents Market
BASF (Germany), The Dow Chemical Company (U.S.), OXEA (Germany), Royal Dutch Shell (Netherlands), ExxonMobil (U.S.), LyondellBasell (Netherlands), Eastman Chemical Company (U.S.), SINOPEC (China), and Petronas (Malaysia) are the key players operating in the oxygenated solvents market.
Key Target Audience in Oxygenated Solvents Market
- Suppliers of raw materials
- Manufacturers of oxygenated solvents
- Traders, distributors, and suppliers of oxygenated solvents
- Government & regional agencies, research organizations, and investors related to oxygenated solvents
Oxygenated Solvents Market Report Scope
This research report categorizes the oxygenated solvents market on the basis of source, type, application, and region.
Oxygenated solvents market, by Source:
- Conventional solvent
- Bio & Green solvent
Oxygenated solvent market, by Type:
- Alcohols
- Esters
- Glycols
- Glycol Ethers
- Ketones
- Bio & Green Solvents
- Others
Oxygenated solvents market, by Application:
- Paints & Coatings
- Pharmaceuticals
- Personal Care
- Crop Protection
- Lubricants
- Others
Oxygenated solvent market, by region:
- North America
- Europe
- Asia-Pacific
- South America
- Middle East & Africa
The market has been further analyzed for the key countries in each of these regions.
Oxygenated Solvents Market Report Available Customizations
With the given market data, MarketsandMarkets offers customizations according to the specific needs of the companies. The following customization options are available for the report:
Oxygenated Solvents Market Analysis:
- Further breakdown of the regional oxygenated solvents market into key countries
Oxygenated Solvents Market Company Information:
- Detailed analysis and profiles of additional market players
Oxygenated Solvents Market Product Analysis
- Product matrix, which gives a detailed comparison of the product portfolio of each company
The oxygenated solvents market is estimated to grow from USD 22.28 Billion in 2017 to USD 32.27 Billion by 2022, at a CAGR of 7.8%. An oxygenated solvent contains oxygen molecule,with high solvency and low toxicity. These solvents are widely used in paints, inks, pharmaceuticals, perfumes, adhesives, cosmetics, detergents, and food processing. Alcohols,glycols, glycol ethers, ketones,bio & green sovlents and esters are the major types of oxygenated solvents.
By source, the bio & green solvents segment of the market is projected to grow at the highest CAGR during the forecast period. The growth is attributed to the increased use of bio & green solvents due to the use of renewable sources as raw material and their non-toxic and eco-friendly nature.
The alcohol solvents segment is estimated to be the largest, in terms of volume during the forecast period. The growth of this segment is attributed to the relatively low cost and high dissolution power alcohol solvents.
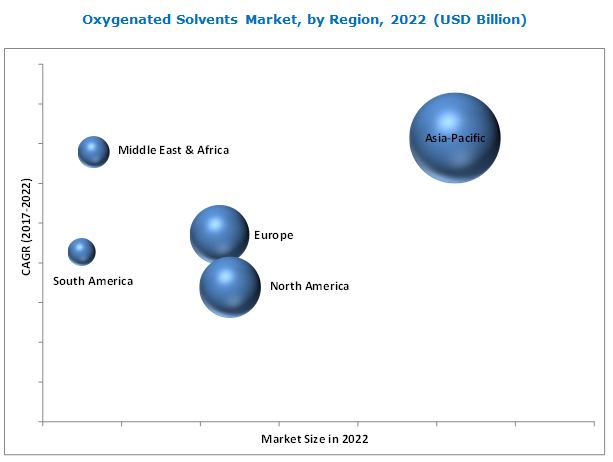
Asia-Pacific accounted for the largest share of the oxygenated solvents market in 2016. The increased demand for oxygenated solvents in Asia-Pacific can be attributed to the shifting of the manufacturing sector from developed economy to the region. Moreover, the increasing government spending on the agricultural, pharmaceutical, and building & construction sectors in the region is also expected to fuel the growth of the market during the forecast period.
The bio & green solvents are environment friendly and may hamper the demand for the conventional oxygenated solvents.
Key Oxygenated Solvents Market Industry Players
The key players in the market include BASF (Germany), OXEA (Germany), LyondellBasell (Netherlands), SINOPEC (China), Eastman Chemical Company (U.S.) and The Dow Chemical Company(U.S.). Companies operating in the oxygenated solvent market have adopted the strategies such as new product launches, expansions, and mergers & acquisitions to enhance their market shares and expand their distribution networks across the globe. These companies engage in R&D activities to innovate and develop products that can open avenues for new applications. For instance, in July 2017, LyondellBasell planned to build a tertiary butyl alcohol plant in Houston, U.S. The plant is expected to be functional by 2021. The expansion is likely to help the company in expanding its solvents business. Similarly, in March 2017, OXEA (Germany) started the expansion of its propanol manufacturing facility in the U.S., with the construction of its new propanol plant. The expansion helped the company to cater the demand of propanol in North America.
To speak to our analyst for a discussion on the above findings, click Speak to Analyst
 Exclusive indicates content/data unique to MarketsandMarkets and not available with any competitors.
Table of Contents
1 Introduction (Page No. - 18)
1.1 Objectives of the Study
1.2 Market Definition
1.3 Market Scope
1.3.1 Years Considered for the Study
1.4 Currency
1.5 Units Considered
1.6 Limitations
1.7 Stakeholders
2 Research Methodology (Page No. - 22)
2.1 Research Data
2.1.1 Secondary Data
2.1.1.1 Key Data From Secondary Sources
2.1.2 Primary Data
2.1.2.1 Key Data From Primary Sources
2.1.2.2 Key Industry Insights
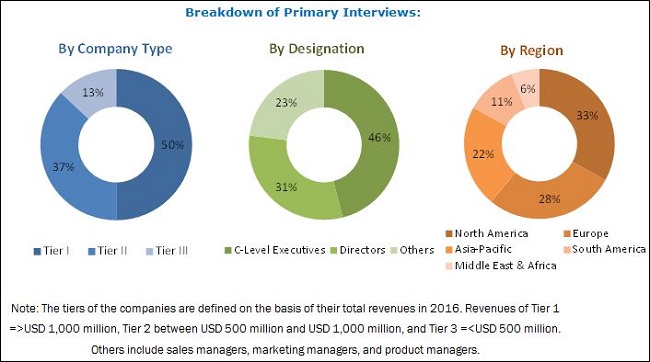
2.1.2.3 Breakdown of Primary Interviews
2.2 Market Size Estimation
2.2.1 Bottom-Up Approach
2.2.2 Top-Down Approach
2.3 Data Triangulation
2.4 Research Assumptions
3 Executive Summary (Page No. - 30)
4 Premium Insights (Page No. - 34)
4.1 Significant Opportunities in the Oxygenated Solvents Market
4.2 Oxygenated Solvent Market, By Application
4.3 Asia-Pacific Oxygenated Solvents Market, By Country and By Application
4.4 Oxygenated Solvent Market, By Region
4.5 Oxygenated Solvents Market, By Type
5 Market Overview (Page No. - 37)
5.1 Introduction
5.2 Market Dynamics
5.2.1 Drivers
5.2.1.1 Drivers for Conventional Solvent
5.2.1.1.1 Growing Applications of Oxygenated Solvents
5.2.1.2 Drivers for Bio & Green Solvents
5.2.1.2.1 Increasing Environmental Regulations to Reduce Vocs
5.2.2 Restraints
5.2.2.1 Restraints for Conventional Oxygenated Solvents
5.2.2.1.1 High Voc Emission By Conventional Oxygenated Solvents
5.2.2.1.2 Solvent Recycling Technology Affecting the Demand for New Solvents
5.2.2.2 Restraint for Bio & Green Solvents
5.2.2.2.1 Cost and Performance Issues
5.2.3 Opportunities
5.2.3.1 Opportunities for Conventional Solvents
5.2.3.1.1 Growing Demand for Conventional Oxygenated Solvents in Emerging Economies
5.2.3.1.2 Lower Crude Oil Prices
5.2.3.2 Opportunities for Bio & Green Solvents
5.2.3.2.1 Improving Economies of Scales Due to High Demand
5.2.4 Challenges
5.2.4.1 Impact of Bio & Green Solvents on Food Security
5.3 Porter Five Force Analysis
5.3.1 Conventional Solvent Market
5.3.1.1 Threat of New Entrants
5.3.1.2 Threat of Substitutes
5.3.1.3 Bargaining Power of Buyers
5.3.1.4 Bargaining Power of Suppliers
5.3.1.5 Intensity of Competitive Rivalry
5.3.2 Bio & Green Solvents Market
5.3.2.1 Threat of New Entrants
5.3.2.2 Threat of Substitutes
5.3.2.3 Bargaining Power of Buyers
5.3.2.4 Bargaining Power of Suppliers
5.3.2.5 Intensity of Competitive Rivalry
5.4 Macroeconomic Overview and Key Drivers
5.4.1 Introduction
5.4.1.1 Automotive Industry Trends
5.4.1.1.1 Country-Wise Vehicle Sales
5.4.2 Agricultural Industry Trends
6 Oxygenated Solvents Market, By Source (Page No. - 49)
6.1 Introduction
6.1.1 Conventional Solvents
6.1.2 Bio & Green Solvents
7 Oxygenated Solvents Market, By Type (Page No. - 54)
7.1 Introduction
7.1.1 Alcohols
7.1.1.1 Methanol
7.1.1.2 Ethanol
7.1.1.3 Propanol
7.1.1.4 Butanol
7.1.1.5 Other Alcohols
7.1.2 Esters
7.1.2.1 Ethyl Acetate
7.1.2.2 Butyl Acetate
7.1.2.3 Pentyl Acetate
7.1.2.4 Other Acetates
7.1.3 Ketones
7.1.3.1 Acetone
7.1.3.2 Methyl Ethyl Ketone (MEK)
7.1.3.3 Methyl Isobutyl Ketone (MIBK)
7.1.3.4 Other Ketones
7.1.4 Glycol Ethers
7.1.4.1 E-Series Glycol Ethers
7.1.4.2 P-Series Glycol Ethers
7.1.4.3 Butyl Glycol Ethers
7.1.5 Glycol
7.1.5.1 Propylene Glycol
7.1.5.2 Ethylene Glycol
7.1.5.3 Other Glycols
7.1.6 Bio & Green Solvent
8 Oxygenated Solvent Market, By Application (Page No. - 73)
8.1 Introduction
8.2 Paints & Coatings
8.3 Crop Protection
8.4 Pharmaceuticals
8.5 Cleaners
8.6 Personal Care
8.7 Lubricants
8.8 Others
9 Oxygenated Solvents Market, By Region (Page No. - 83)
9.1 Introduction
9.2 Oxygenated Solvents Market, By Region
9.3 Asia-Pacific
9.3.1 China
9.3.2 Japan
9.3.3 India
9.3.4 South Korea
9.3.5 Indonesia
9.3.6 Rest of Asia-Pacific
9.4 Europe
9.4.1 Germany
9.4.2 France
9.4.3 Italy
9.4.4 U.K.
9.4.5 Russia
9.4.6 Spain
9.4.7 Rest of Europe
9.5 North America
9.5.1 U.S.
9.5.2 Canada
9.5.3 Mexico
9.6 Middle East & Africa
9.6.1 Saudi Arabia
9.6.2 South Africa
9.6.3 Rest of Middle East & Africa
9.7 South America
9.7.1 Brazil
9.7.2 Argentina
9.7.3 Rest of South America
10 Competitive Landscape (Page No. - 127)
10.1 Introduction
10.2 Market Ranking of Top 5 Players in Oxygenated Solvents Market
10.2.1 BASF
10.2.2 The DOW Chemical Company
10.2.3 Oxea GmbH
10.2.4 Eastman Chemical Company
10.2.5 Lyondellbasell
11 Company Profiles (Page No. - 129)
(Business Overview, Products Offered, Scorecard of Product Offering, Scorecard of Business Strategy, and New Product Launch)
11.1 BASF
11.2 The DOW Chemical Company
11.3 Oxea GmbH
11.4 Eastman Chemical Company
11.5 Lyondellbasell
11.6 Royal Dutch Shell
11.7 Exxonmobil
11.8 Ineos
11.9 China Petroleum & Chemical Corporation (Sinopec)
11.10 Petroliam Nasional Berhad (Petronas)
11.11 Other Market Players
11.11.1 Arkema SA
11.11.2 Monument Chemical Inc.
11.11.3 Celanese Corporation
11.11.4 Huntsman Corporation
11.11.5 Solvay SA
11.11.6 LG Chem Ltd.
11.11.7 Sasol SA
11.11.8 Reliance Industries
11.11.9 Mitsubishi Chemical Corporation
11.11.10 Jilin Xingyun Chemical Co., Ltd.
11.11.11 Mitsui Chemicals, Inc.
11.11.12 Nan Ya Plastic Corp.
11.11.13 Vertec Biosolvents
11.11.14 Petrochina Sichuan Petrochemical Company
11.11.15 Formosa Plastics Group
*Details Might Not Be Captured in Case of Unlisted Companies
12 Appendix (Page No. - 168)
12.1 Insights From Industry Experts
12.2 Discussion Guide
12.3 Knowledge Store: Marketsandmarkets Subscription Portal
12.4 Introducing RT: Real-Time Market Intelligence
12.5 Available Customizations
12.6 Related Reports
12.7 Author Details
List of Tables (126 Tables)
Table 1 Top 10 Economies By GDP in PPP Terms, 2016
Table 2 Vehicle Sales, By Key Country, 2013–2016
Table 3 Regional Crop Land Usage Trend (Square Kilometer)
Table 4 Oxygenated Solvents Market Size, By Source, 2015–2022 (Kiloton)
Table 5 Oxygenated Solvent Market Size, By Source, 2015–2022 (USD Million)
Table 6 Conventional Oxygenated Solvents Market, By Region, 2015–2022 (Kiloton)
Table 7 Conventional Oxygenated Solvent Market, By Region, 2015–2022 (USD Million)
Table 8 Bio & Green Oxygenated Solvents Market, By Region, 2015–2022 (Kiloton)
Table 9 Bio & Green Oxygenated Solvent Market, By Region, 2015–2022 (USD Million)
Table 10 Oxygenated Solvents Market Size, By Type, 2015–2022 (Kiloton)
Table 11 Oxygenated Solvent Market Size, By Type, 2015–2022 (USD Million)
Table 12 Alcohol Solvents Market Size, By Region, 2015–2022 (Kiloton)
Table 13 Alcohol Solvents Market Size, By Region, 2015–2022 (USD Million)
Table 14 Alcohol Solvents Market Size, By Sub-Type, 2015–2022 (Kiloton)
Table 15 Alcohol Solvents Market Size, By Sub-Type, 2015–2022 (USD Million)
Table 16 Methanol: General Properties
Table 17 Ethanol: General Properties
Table 18 Propanol: General Properties
Table 19 Butanol: General Properties
Table 20 Ester Solvents Market Size, By Region, 2015–2022 (Kiloton)
Table 21 Ester Solvents Market Size, By Region, 2015–2022 (USD Million)
Table 22 Ethyl Acetate: General Properties
Table 23 Butyl Acetate: General Properties
Table 24 Ester Solvents Market Size, By Sub-Type, 2015–2022 (Kiloton)
Table 25 Ester Solvents Market Size, By Sub-Type, 2015–2022 (USD Million)
Table 26 Ketone Solvents Market Size, By Region, 2015–2022 (Kiloton)
Table 27 Ketone Solvents Market Size, By Region, 2015–2022 (USD Million)
Table 28 Acetone: General Properties
Table 29 MEK: General Properties
Table 30 MIBK: General Properties
Table 31 Ketone Solvents Market Size, By Sub-Type, 2015–2022 (Kiloton)
Table 32 Ketone Solvents Market Size, By Sub-Type, 2015–2022(USD Million)
Table 33 Glycol Ether Solvents Market Size, By Region, 2015–2022 (Kiloton)
Table 34 Glycol Ether Solvents Market Size, By Region, 2015–2022 (USD Million)
Table 35 Glycol Ether Solvents Market Size, By Sub-Type, 2015–2022 (Kiloton)
Table 36 Glycol Ether Solvents Market Size, By Sub-Type, 2015–2022 (USD Million)
Table 37 Glycol Solvents Market Size, By Region, 2015–2022 (Kiloton)
Table 38 Glycol Solvents Market Size, By Region, 2015–2022 (USD Million)
Table 39 Propylene Glycol: General Properties
Table 40 Glycol Solvents Market Size, By Sub-Type, 2015–2022 (Kiloton)
Table 41 Glycol Solvents Market Size, By Sub-Type, 2015–2022 (USD Million)
Table 42 Bio & Green Solvent Solvents Market Size, By Sub-Type, 2015–2022 (Kiloton)
Table 43 Bio & Green Solvent Solvents Market Size, By Sub-Type, 2015–2022 (USD Million)
Table 44 Oxygenated Solvents Market Size, By Application, 2015–2022 (Kiloton)
Table 45 Oxygenated Solvent Market Size, By Application, 2015–2022 (USD Million)
Table 46 Market Size in Paints & Coatings, By Region, 2015–2022 (Kiloton)
Table 47 Oxygenated Solvent Market Size in Paints & Coatings, By Region, 2015–2022 (USD Million)
Table 48 Oxygenated Solvents Market Size in Crop Protection, By Region, 2015–2022 (Kiloton)
Table 49 Market Size in Crop Protection, By Region, 2015–2022 (USD Million)
Table 50 Oxygenated Solvents Market Size in Pharmaceuticals, By Region, 2015–2022 (Kiloton)
Table 51 Oxygenated Solvent Market Size in Pharmaceuticals, By Region, 2015–2022 (USD Million)
Table 52 Market Size in Cleaners, By Region, 2015–2022 (Kiloton)
Table 53 Oxygenated Solvent Market Size in Cleaners, By Region, 2015–2022 (USD Million)
Table 54 Oxygenated Solvents Market Size in Personal Care, By Region, 2015–2022 (Kiloton)
Table 55 Market Size in Personal Care, By Region, 2015–2022 (USD Million)
Table 56 Oxygenated Solvents Market Size in Lubricants, By Region, 2015–2022 (Kiloton)
Table 57 Oxygenated Solvent Market Size in Lubricants, By Region, 2015–2022 (USD Million)
Table 58 Market Size in Other Applications, By Region, 2015–2022 (Kiloton)
Table 59 Oxygenated Solvent Market Size in Other Applications, By Region, 2015–2022 (USD Million)
Table 60 Oxygenated Solvents Market Size, By Region, 2015–2022 (Kiloton)
Table 61 Market Size, By Region, 2015–2022 (USD Million)
Table 62 Asia-Pacific: By Market Size, By Country, 2015–2022 (Kiloton)
Table 63 Asia-Pacific: By Market Size, By Country, 2015–2022 (USD Million)
Table 64 Asia-Pacific: Agriculture Sector Contribution to GDP (% of GDP), By Country, 2016
Table 65 Asia-Pacific: By Market Size, By Type, 2015–2022 (Kiloton)
Table 66 Asia-Pacific: By Market Size, By Type, 2015–2022 (USD Million)
Table 67 China: By Market Size, By Application, 2015–2022 (Kiloton)
Table 68 China: By Market Size, By Application, 2015–2022 (USD Million)
Table 69 Japan: By Market Size, By Application, 2015–2022 (Kiloton)
Table 70 Japan: By Market Size, By Application, 2015–2022 (USD Million)
Table 71 India: By Market Size, By Application, 2015–2022 (Kiloton)
Table 72 India: By Market Size, By Application, 2015–2022 (USD Million)
Table 73 South Korea: By Market Size, By Application, 2015–2022 (Kiloton)
Table 74 South Korea: By Market Size, By Application, 2015–2022 (USD Million)
Table 75 Indonesia: By Market Size, By Application, 2015–2022 (Kiloton)
Table 76 Indonesia: By Market Size, By Application, 2015–2022 (USD Million)
Table 77 Rest of Asia-Pacific: By Market Size, By Application, 2015–2022 (Kiloton)
Table 78 Rest of Asia-Pacific: By Market Size, By Application, 2015–2022 (USD Million)
Table 79 Europe: By Market Size, By Country, 2015–2022 (Kiloton)
Table 80 Europe: By Market Size, By Country, 2015–2022 (USD Million)
Table 81 Europe: By Market Size, By Type, 2015–2022 (Kiloton)
Table 82 Europe: By Market Size, By Type, 2015–2022 (USD Million)
Table 83 Germany: By Market Size, By Application, 2015–2022 (Kiloton)
Table 84 Germany: By Market Size, By Application, 2015–2022 (USD Million)
Table 85 France: By Market Size, By Application, 2015–2022 (Kiloton)
Table 86 France: By Market Size, By Application, 2015–2022 (USD Million)
Table 87 Italy: By Market Size, By Application, 2015–2022 (Kiloton)
Table 88 Italy: By Market Size, By Application, 2015–2022 (USD Million)
Table 89 U.K.: By Market Size, By Application, 2015–2022 (Kiloton)
Table 90 U.K.: By Market Size, By Application, 2015–2022 (USD Million)
Table 91 Russia: By Market Size, By Application, 2015–2022 (Kiloton)
Table 92 Russia: By Market Size, By Application, 2015–2022 (USD Million)
Table 93 Spain: By Market Size, By Application, 2015–2022 (Kiloton)
Table 94 Spain: By Market Size, By Application, 2015–2022 (USD Million)
Table 95 Rest of Europe: By Market Size, By Application, 2015–2022 (Kiloton)
Table 96 Rest of Europe: By Market Size, By Application, 2015–2022 (USD Million)
Table 97 North America: By Market Size, By Country, 2015–2022 (Kiloton)
Table 98 North America: By Market Size, By Country, 2015–2022 (USD Million)
Table 99 North America: By Market Size, By Type, 2015–2022 (Kiloton)
Table 100 North America: By Market Size, By Type, 2015–2022 (USD Million)
Table 101 U.S.: By Market Size, By Application, 2015–2022 (Kiloton)
Table 102 U.S.: By Market Size, By Application, 2015–2022 (USD Million)
Table 103 Canada: By Market Size, By Application, 2015–2022 (Kiloton)
Table 104 Canada: By Market Size, By Application, 2015–2022 (USD Million)
Table 105 Mexico: By Market Size, By Application, 2015–2022 (Kiloton)
Table 106 Mexico: By Market Size, By Application, 2015–2022 (USD Million)
Table 107 Middle East & Africa: By Market Size, By Country, 2015–2022 (Kiloton)
Table 108 Middle East & Africa: By Market Size, By Country, 2015–2022 (USD Million)
Table 109 Middle East & Africa: By Market Size, By Type, 2015–2022 (Kiloton)
Table 110 Middle East & Africa: By Market Size, By Type, 2015–2022 (USD Million)
Table 111 Saudi Arabia: By Market Size, By Application, 2015–2022 (Kiloton)
Table 112 Saudi Arabia: By Market Size, By Application, 2015–2022 (USD Million)
Table 113 South Africa: By Market Size, By Application, 2015–2022 (Kiloton)
Table 114 South Africa: By Market Size, By Application, 2015–2022 (USD Million)
Table 115 Rest of Middle East & Africa: By Market Size, By Application, 2015–2022 (Kiloton)
Table 116 Rest of Middle East & Africa: By Market Size, By Application, 2015–2022 (USD Million)
Table 117 South America: By Market Size, By Country, 2015–2022 (Kiloton)
Table 118 South America: By Market Size, By Country, 2015–2022 (USD Million)
Table 119 South America: By Market Size, By Type, 2015–2022 (Kiloton)
Table 120 South America: By Market Size, By Type, 2015–2022 (USD Million)
Table 121 Brazil: By Market Size, By Application, 2015–2022 (Kiloton)
Table 122 Brazil: By Market Size, By Application, 2015–2022 (USD Million)
Table 123 Argentina: By Market Size, By Application, 2015–2022 (Kiloton)
Table 124 Argentina: By Market Size, By Application, 2015–2022 (USD Million)
Table 125 Rest of South America: By Market Size, By Application, 2015–2022 (Kiloton)
Table 126 Rest of South America: By Market Size, By Application, 2015–2022 (USD Million)
List of Figures (36 Figures)
Figure 1 Oxygenated Solvents Market: Research Design
Figure 2 Market Size Estimation: Bottom-Up Approach
Figure 3 Market Size Estimation: Top-Down Approach
Figure 4 Oxygenated Solvent Market: Data Triangulation
Figure 5 Conventional Oxygenated Solvents to Dominate Oxygenated Solvents Market During the Forecast Period
Figure 6 Alcohols to Be the Largest Segment of the Market Between 2017 and 2022
Figure 7 Paints & Coatings Application to Lead Oxygenated Solvent Market Between 2017 and 2022
Figure 8 Asia-Pacific Accounted for the Largest Share of Oxygenated Solvents Market
Figure 9 Emerging Economies to Offer Lucrative Growth Opportunities to Market Players Between 2017 and 2022
Figure 10 Crop Protection to Be the Fastest-Growing Application in Oxygenated Solvent Market During Forecast Period
Figure 11 Paints & Coatings to Be the Largest Application in Oxygenated Solvents Market in Asia-Pacific
Figure 12 Asia-Pacific Accounted for the Largest Share of Oxygenated Solvent Market
Figure 13 Bio & Green Solvents to Account for the Largest Market Share During Forecast Period
Figure 14 Factors Governing Oxygenated Solvents Market
Figure 15 Lower Crude Oil Prices
Figure 16 Porter’s Five Forces Analysis of the Conventional Solvents Market
Figure 17 Porter’s Five Forces Analysis of the Bio & Green Solvents Market
Figure 18 Conventional Solvents to Dominate Oxygenated Solvent Market
Figure 19 Asia-Pacific to Be the Largest Market for Conventional Solvents
Figure 20 North America to Be the Largest Market for Bio & Green Oxygenated Solvents During Forecast Period
Figure 21 Alcohols to Be the Largest Oxygenated Solvents Market
Figure 22 Paints & Coatings Application to Lead the Oxygenated Solvent Market
Figure 23 India Expected to Experience Fastest Growth During Forecast Period
Figure 24 Growing Investment in Infrastructure to Drive Asia-Pacific Oxygenated Solvents Market
Figure 25 U.S. Dominates Oxygenated Solvent Market in North America
Figure 26 U.S Oxygenated Solvents Market
Figure 27 Top 5 Players in Oxygenated Solvent Market, 2016
Figure 28 BASF SE: Company Snapshot
Figure 29 The DOW Chemical Company: Company Snapshot
Figure 30 Eastman Chemical Company: Company Snapshot
Figure 31 Lyondellbasell: Company Snapshot
Figure 32 Royal Dutch Shell: Company Snapshot
Figure 33 Exxonmobil Corporation: Company Snapshot
Figure 34 Ineos: Company Snapshot
Figure 35 China Petroleum & Chemical Corporation (Sinopec): Company Snapshot
Figure 36 Petroliam Nasional Berhad (Petronas): Company Snapshot


Growth opportunities and latent adjacency in Oxygenated Solvents Market