Optical Wavelength Services Market by Bandwidth (Less than 10 Gbps, 40 Gbps, 100 Gbps, and More than 100 Gbps), Application (SONET, Ethernet, and OTN), Interface (Short Haul, Metro, and Long Haul), Organization Size, and Region - Global Forecast to 2023


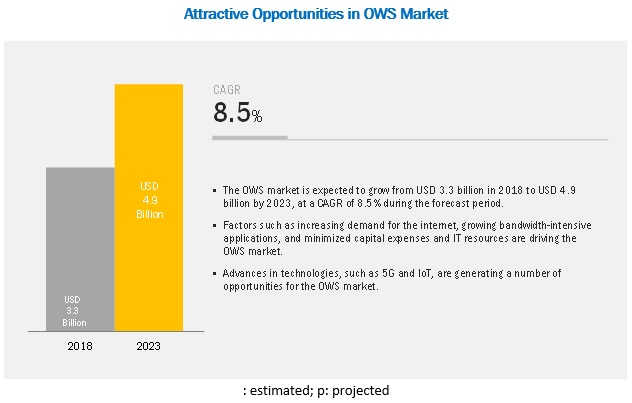
[109 Pages Report] MarketsandMarkets forecasts the global Optical Wavelength Services (OWS) market size to grow from USD 3.3 billion in 2018 to USD 4.9 billion by 2023, at a Compound Annual Growth Rate (CAGR) of 8.5% during the forecast period. The advent of Internet of Things (IoT) and growing automation trends have exponentially increased data traffic thereby creating heavily-increased bandwidth requirements for large enterprises and Small and Medium-sized Enterprises (SMEs). Further increasing demand for high-speed internet and fiber optics communication has become the backbone thereby increasing the demand for OWS. Advancements in technology with regards to communication standards are expected to create opportunities for OWS vendors.
Optical Transport Network (OTN) interface to record the highest CAGR during the forecast period
OTN offers various advantages over traditional WDM transponder-based network, including increased efficiency, reliability, and secure wavelength-based private services. Furthermore, OTN switches at fiber junctions enable the optimal use of the optical spectrum.
Among applications, metro segment to grow at the highest CAGR during the forecast period
The increasing bandwidth demand and connectivity between Data Centers (DCs), along with the adoption of consumer 4K and higher video content and services on a number of devices is a major driver for the adoption of metro applications.
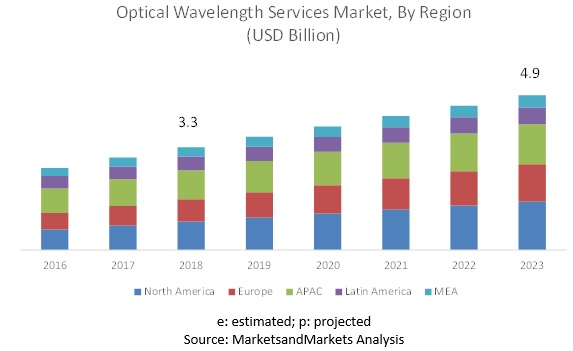
Asia Pacific to hold the largest market size in 2018
Networking infrastructure in APAC has increased significantly over the past few years. The APAC market is estimated to hold the highest market share in 2018. The developing countries in APAC are still upgrading their communication infrastructure as a part of the digital transformation process. With a large number of IT sector businesses located in the region, the demand for end-to-end wavelength services is high in the region. Governments of various developing countries are also taking initiatives to encourage or to speed up the development of communication infrastructure in these countries. China, Japan, and India are some of the prominent countries with strong fiber optic infrastructures in APAC.
Key Optical Wavelength Services Market Players
In the OWS market, key and emerging market players include Zayo Group (US), Nokia (Finland), Verizon (US), GTT (US), CenturyLink (Louisiana), AT&T (US), Sprint (US), Comcast (US), Colt Technology Solution (UK), Crown Castle (US), Windstream Enterprises (US), Charter Communications (US), Cox Communications (US), and Jaguar Network (France). These players have adopted various strategies to grow in the global OWS market. They have adopted organic and inorganic strategies, such as new product launches, acquisitions, business expansions, and partnerships, to expand their business reach and drive their business revenue growth. Moreover, various OWS providers are adopting various strategies, including venture capital funding, funding through Initial Coin Offering (ICO), new product launches, acquisitions, and partnerships and collaborations, to expand their presence in the global Optical Wavelength Services market.
Scope of the Report
|
Report Metrics |
Details |
|
Market size available for years |
2016�2023 |
|
Base year considered |
2017 |
|
Forecast period |
2018�2023 |
|
Forecast units |
Million (USD) |
|
Segments covered |
Bandwidth (<=10Gbps, 40Gbps, 100Gbps, >100Gbps), Interface (SONET, OTN, Ethernet), Application (Short Haul, Metro, Long Haul), Organization Size (SMEs and Large Enterprises), and Regions |
|
Geographies covered |
North America, Europe, APAC, Latin America, and MEA |
|
Companies covered |
Zayo Group (US), Nokia (Finland), Verizon (US), GTT (US), CenturyLink (Louisiana), AT&T (US), Sprint (US), Comcast (US), Colt Technology Solution (UK), Crown Castle (US), Windstream Enterprises (US), Charter Communications (US), Cox Communications (US), and Jaguar Network (France), and CarrierBid (US) |
The research report categorizes the Optical Wavelength Services market to forecast the revenues and analyze trends in each of the following subsegments:
By Bandwidth
- <=10Gbps
- 40Gbps
- 100Gbps
- >100Gbps
By Interface
- SONET
- OTN
- Ethernet
By Application
- Short Haul
- Metro
- Long Haul
By Organization Size
- SMEs
- Large Enterprises
By Region
- North America
- Europe
- APAC
- Latin America
- MEA
Recent Developments
- In January 2019, Zayo announced its collaboration with Oracle to provide enhanced cloud connectivity services. Zayo�s CloudLink technology will be used to provide a secure and direct connection to Oracle�s cloud infrastructure.
- In February 2019, Nokia partnered with the Germany-based carrier service provider M-net for the field trial of probabilistically shaped wavelengths using Nokia�s PSE-3.
Critical questions the report answers:
- Where will all these developments take the industry in the mid to long term?
- What are the upcoming trends in the Optical Wavelength Services market?
- What are the competitive developments, such as mergers and acquisitions, new product developments, and business expansion activities, in the market.?
- How major factors, such as drivers, restraints, opportunities, and challenges, influence the growth of the market?
- What are the key roles of major players in the OWS market?
Frequently Asked Questions (FAQ):
What is growth rate of OWS market in the next five years?
What region holds the highest market share in the OWS market?
What are the major applications in the OWS market?
What are the key vendors in the OWS market?
To speak to our analyst for a discussion on the above findings, click Speak to Analyst
 Exclusive indicates content/data unique to MarketsandMarkets and not available with any competitors.
Table of Contents
1 Introduction (Page No. - 15)
1.1 Objectives of the Study
1.2 Market Definition
1.3 Market Scope
1.3.1 Market Segmentation
1.4 Years Considered for the Study
1.5 Currency Considered
1.6 Stakeholders
2 Research Methodology (Page No. - 18)
2.1 Research Data
2.1.1 Breakup of Primaries
2.1.2 Key Industry Insights
2.1.3 Market Breakup and Data Triangulation
2.2 Market Size Estimation
2.2.1 Top-Down Approach
2.2.2 Bottom-Up Approach
2.3 Assumptions for the Study
2.4 Microquadrant Methodology
2.5 Limitations of the Study
3 Executive Summary (Page No. - 25)
4 Premium Insights (Page No. - 28)
4.1 Attractive Market Opportunities in the Global Optical Wavelength Services Market
4.2 Market By Interface, 2018
4.3 Market in North America, By Interface and Application
4.4 Market in Asia Pacific, By Interface and Application
5 Market Overview and Industry Trends (Page No. - 31)
5.1 Introduction
5.2 Market Dynamics
5.2.1 Drivers
5.2.1.1 Minimizing Capital Expenses and IT Resources
5.2.1.2 Increasing Demand for the Internet
5.2.1.3 Growing Bandwidth-Intensive Applications
5.2.2 Restraints
5.2.2.1 Evolving Standards
5.2.3 Opportunities
5.2.3.1 Advances in Technologies Such as IoT and 5G
5.2.4 Challenges
5.2.4.1 Need for Virtual Connectivity to Multiple HUB Sites
5.2.4.2 Less Incremental Bandwidth Options
5.3 Use Cases
6 Optical Wavelength Services Market, By Bandwidth (Page No. - 36)
6.1 Introduction
6.2 Less Than and Equal to 10 Gbps
6.2.1 Limited Application Areas Within 10 Gbps Bandwidth to Affect the Market Growth
6.3 40 Gbps
6.3.1 Wavelength Services for 40 Gbps Data Rate to Be Among the Fastest-Growing Bandwidth Opting Services
6.4 100 Gbps
6.4.1 Large Enterprises to Be the Major Deplorers for 100 Gbps Data Rate
6.5 More Than 100 Gbps
6.5.1 Rising Demand for Higher Bandwidths to Drive the Market Growth
7 Optical Wavelength Services Market, By Interface (Page No. - 41)
7.1 Introduction
7.2 Sonet
7.2.1 Sonet to Act as One of the Popular Interfaces in the OWS Market
7.3 OTN
7.3.1 Upgrading Technologies Such as OTN to Drive the Growth of the OWS Market
7.4 Ethernet
7.4.1 Ethernet to Have the Highest Number of Installations Due to Its Cost-Efficient Nature
8 Optical Wavelength Services Market, By Application (Page No. - 46)
8.1 Introduction
8.2 Short Haul
8.2.1 Need for Short-Distance Transmission to Drive the Adoption of Short Haul Applications
8.3 Metro
8.3.1 Metro Applications to Drive the Overall OWS Market
8.4 Long Haul
8.4.1 Long Haul Applications to Hold A Significant Market Share in the OWS Market
9 Optical Wavelength Services Market, By Organization Size (Page No. - 50)
9.1 Introduction
9.2 Small and Medium-Sized Enterprises
9.2.1 Growing Number of Startups to Help SMEs Witness Strong Growth Rates
9.3 Large Enterprises
9.3.1 Strong Technical Adoption and Pre-Dominant Investment Scenarios to Lead Large Enterprises in the OWS Market
10 Optical Wavelength Services Market, By Region (Page No. - 54)
10.1 Introduction
10.2 North America
10.2.1 United States
10.2.1.1 Advanced Wavelength Technologies Developed By Regional Players to Boost the OWS Market in the US
10.2.2 Canada
10.2.2.1 Expansion By Regional Service Providers to Boost the OWS Market in Canada
10.3 Europe
10.3.1 United Kingdom
10.3.1.1 Increasing Investments By Networking Service Providers to Boost the UK Market
10.3.2 Germany
10.3.2.1 Expansion of Existing Fiber Optic Infrastructure By Various Networking Players to Create A Favorable Ecosystem for OWS Providers in Germany
10.3.3 France
10.3.3.1 Use of Advanced Technology to Help France-Based Optical Service Providers in Offering Efficient Services to Customers
10.3.4 Rest of Europe
10.4 Asia Pacific
10.4.1 China
10.4.1.1 Government Initiatives Combined With Private Player Optical Fiber Deployments to Drive the Chinese OWS Market
10.4.2 India
10.4.2.1 Improved Fiber Backhaul in India to Drive the OWS Market in India
10.4.3 Japan
10.4.3.1 Implementation of Advanced Technologies and Development of Networking Infrastructure to Drive the Japanese OWS Market
10.4.4 Rest of Asia Pacific
10.5 Latin America
10.5.1 Brazil
10.5.1.1 Increasing Fiber Optic Deployment to Drive the Brazilian OWS Market
10.5.2 Mexico
10.5.2.1 Developing Optical Wavelength Technologies to Boost the OWS Market in Mexico
10.5.3 Rest of Latin America
10.6 Middle East and Africa
10.6.1 Middle East
10.6.1.1 Ongoing Developments With Regard to Enterprises to Boost the Market Growth in the Middle East
10.6.2 Africa
10.6.2.1 Upcoming Internet Penetration to Be the Major Focus Area for Africa to Look Upon
11 Competitive Landscape (Page No. - 72)
11.1 Competitive Leadership Mapping
11.1.1 Visionary Leaders
11.1.2 Innovators
11.1.3 Dynamic Differentiators
11.1.4 Emerging Companies
11.2 Strength of Product Portfolio
11.3 Business Strategy Excellence
12 Company Profiles (Page No. - 77)
12.1 Introduction
(Business Overview, Services/Solutions Offered, Recent Developments, SWOT Analysis, and MnM View)*
12.2 Zayo
12.3 Nokia
12.4 Verizon
12.5 GTT
12.6 Centurylink
12.7 AT&T
12.8 Sprint
12.9 Comcast
12.10 Crown Castle
12.11 Windstream
12.12 Charter Communications
12.13 Colt Technology
12.14 COX Communications
12.15 Jaguar Network
12.16 Carrierbid
*Details on Business Overview, Services/Solutions Offered, Recent Developments, SWOT Analysis, and MnM View Might Not Be Captured in Case of Unlisted Companies.
13 Appendix (Page No. - 103)
13.1 Discussion Guide
13.2 Knowledge Store: Marketsandmarkets� Subscription Portal
13.3 Available Customizations
13.4 Related Reports
13.5 Author Details
List of Tables (43 Tables)
Table 1 United States Dollar Exchange Rate, 2015�2017
Table 2 Optical Wavelength Services Market Size, By Bandwidth, 2016�2023 (USD Million)
Table 3 Less Than 10 Gbps: Market Size By Region, 2016�2023 (USD Million)
Table 4 40 Gbps: Market Size By Region, 2016�2023 (USD Million)
Table 5 100 Gbps: Market Size By Region, 2016�2023 (USD Million)
Table 6 More Than 100 Gbps: Market Size By Region, 2016�2023 (USD Million)
Table 7 Optical Wavelength Services Market Size, By Interface, 2016�2023 (USD Million)
Table 8 Sonet: Market Size By Region, 2016�2023 (USD Million)
Table 9 OTN: Market Size By Region, 2016�2023 (USD Million)
Table 10 Ethernet: Market Size By Region, 2016�2023 (USD Million)
Table 11 Optical Wavelength Services Market Size, By Application, 2016�2023 (USD Million)
Table 12 Short Haul: Market Size By Region, 2016�2023 (USD Million)
Table 13 Metro: Market Size By Region, 2016�2023 (USD Million)
Table 14 Long Haul: Market Size By Region, 2016�2023 (USD Million)
Table 15 Market Size By Organization Size, 2016�2023 (USD Million)
Table 16 Small and Medium-Sized Enterprises: Market Size By Region, 2016�2023 (USD Million)
Table 17 Large Enterprises: Market Size, By Region, 2016�2023 (USD Million)
Table 18 Optical Wavelength Services Market Size, By Region, 2016�2023 (USD Million)
Table 19 North America: Optical Wavelength Services Market Size, By Bandwidth, 2016�2023 (USD Million)
Table 20 North America: Market Size By Interface, 2016�2023 (USD Million)
Table 21 North America: Market Size By Application, 2016�2023 (USD Million)
Table 22 North America: Market Size By Organization Size, 2016�2023 (USD Million)
Table 23 North America: Market Size By Country, 2016�2023 (USD Million)
Table 24 Europe: Optical Wavelength Services Market Size, By Bandwidth, 2016�2023 (USD Million)
Table 25 Europe: Market Size By Interface, 2016�2023 (USD Million)
Table 26 Europe: Market Size By Application, 2016�2023 (USD Million)
Table 27 Europe: Market Size By Organization Size, 2016�2023 (USD Million)
Table 28 Europe: Market Size By Country, 2016�2023 (USD Million)
Table 29 Asia Pacific: Optical Wavelength Services Market Size, By Bandwidth, 2016�2023 (USD Million)
Table 30 Asia Pacific: Market Size By Interface, 2016�2023 (USD Million)
Table 31 Asia Pacific: Market Size By Application, 2016�2023 (USD Million)
Table 32 Asia Pacific: Market Size By Organization Size, 2016�2023 (USD Million)
Table 33 Asia Pacific: Market Size By Country, 2016�2023 (USD Million)
Table 34 Latin America: Optical Wavelength Services Market Size, By Bandwidth, 2016�2023 (USD Million)
Table 35 Latin America: Market Size By Interface, 2016�2023 (USD Million)
Table 36 Latin America: Market Size By Application, 2016�2023 (USD Million)
Table 37 Latin America: Market Size By Organization Size, 2016�2023 (USD Million)
Table 38 Latin America: Market Size By Country, 2016�2023 (USD Million)
Table 39 Middle East and Africa: Optical Wavelength Services Market Size, By Bandwidth, 2016�2023 (USD Million)
Table 40 Middle East and Africa: Market Size By Interface, 2016�2023 (USD Million)
Table 41 Middle East and Africa: Market Size By Application, 2016�2023 (USD Million)
Table 42 Middle East and Africa: Market Size By Organization Size, 2016�2023 (USD Million)
Table 43 Middle East and Africa: Market Size By Sub-Region, 2016�2023 (USD Million)
List of Figures (34 Figures)
Figure 1 Optical Wavelength Services Market: Research Design
Figure 2 Research Methodology
Figure 3 Optical Wavelength Services Market: Top-Down and Bottom-Up Approaches
Figure 4 Microquadrant Matrix: Criteria Weightage
Figure 5 Market Regional Trend
Figure 6 Market Growth Trend
Figure 7 North America to Grow at the Fastest Rate During the Forecast Period
Figure 8 Growing Bandwidth-Intensive Applications to Drive the Market Growth During the Forecast Period
Figure 9 Ethernet Segment to Hold the Highest Share in 2018
Figure 10 Ethernet Interface and Metro Application to Account for the Highest Shares in 2018
Figure 11 Ethernet Interface and Metro Application to Account for the Highest Shares in 2018
Figure 12 Drivers, Restraints, Opportunities, and Challenges: Optical Wavelength Services Market
Figure 13 10o Gbps Segment is Expected to Grow at the Highest CAGR During the Forecast Period
Figure 14 OTN Interface Segment to Grow at the Highest CAGR During the Forecast Period
Figure 15 Metro Application to Grow at the Highest CAGR During the Forecast Period
Figure 16 Small and Medium-Sized Enterprises Segment to Grow at A Higher CAGR During the Forecast Period
Figure 17 North America to Grow at the Highest CAGR During the Forecast Period
Figure 18 North America: Market Snapshot
Figure 19 Asia Pacific: Market Snapshot
Figure 20 Optical Wavelength Services Market (Global) Competitive Leadership Mapping, 2018
Figure 21 Ranking of Key Players in the Optical Wavelength Services Market, 2018
Figure 22 Zayo: Company Snapshot
Figure 23 SWOT Analysis: Zayo
Figure 24 Nokia: Company Snapshot
Figure 25 SWOT Analysis: Nokia
Figure 26 Verizon: Company Snapshot
Figure 27 GTT: Company Snapshot
Figure 28 Centurylink: Company Snapshot
Figure 29 AT&T: Company Snapshot
Figure 30 Sprint: Company Snapshot
Figure 31 Comcast: Company Snapshot
Figure 32 Crown Castle: Company Snapshot
Figure 33 Windstream: Company Snapshot
Figure 34 Charter Communications: Company Snapshot
The study involved 4 major activities to estimate the current market size of the Optical Wavelength Services (OWS) market. Exhaustive secondary research was done to collect information on the market, peer market, and parent market. The next step was to validate these findings, assumptions, and sizing with the industry experts across value chains through primary research. Both top-down and bottom-up approaches were employed to estimate the complete market size. Thereafter, the market breakup and data triangulation procedures were used to estimate the market size of the segments of the Optical Wavelength Services market.
Secondary Research
In the secondary research process, various secondary sources such as D&B Hoovers, Bloomberg BusinessWeek, and Factiva have been referred to, for identifying and collecting information for this study. These secondary sources included annual reports; press releases and investor presentations of companies; whitepapers, certified publications, and articles by recognized authors; gold standard and silver standard websites; regulatory bodies; and databases.
Primary Research
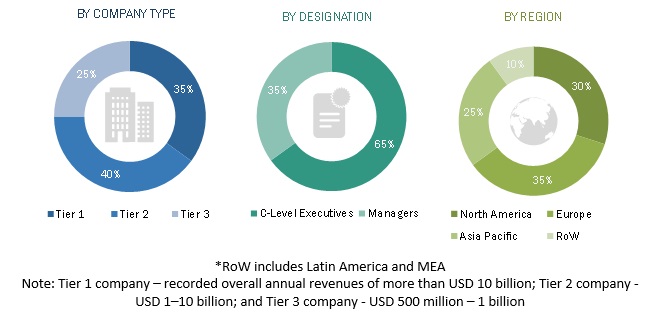
Various primary sources from both the supply and demand sides of the Optical Wavelength Services market ecosystem were interviewed to obtain qualitative and quantitative information for this study. The primary sources from the supply side included industry experts, such as Chief Executive Officers (CEOs), Vice Presidents (VPs), marketing directors, technology and innovation directors, and related key executives from various vendors who provide OWS services and associated solution providers operating in the targeted regions. All possible parameters that affect the market covered in this research study have been accounted for, viewed in extensive detail, verified through primary research, and analyzed to get the final quantitative and qualitative data. The following is the breakup of the primary respondents� profiles:
To know about the assumptions considered for the study, download the pdf brochure
Optical Wavelength Services Market Size Estimation
For estimating and forecasting the OWS market and the other dependent submarkets, top-down and bottom-up approaches were used. The bottom-up procedure was used to arrive at the overall market size of the global OWS market using the revenues and offerings of the key companies in the market. The research methodology used to estimate the market size included the following:
- The key players in the market were identified through extensive secondary research.
- The market size, in terms of value, was determined through primary and secondary research processes.
- All percentage shares, splits, and breakups were determined using secondary sources and verified through primary sources.
Data Triangulation
With data triangulation and validation through primary interviews, the exact value of the overall parent market size was determined and confirmed using this study. The overall market size was then used in the top-down procedure to estimate the size of the other individual markets via percentage splits of the market segmentation.
Report Objectives
- To define, describe, and forecast the global Optical Wavelength Services market by Bandwidth (<=10Gbps, 40Gbps, 100Gbps, >100Gbps), Interface (SONET, OTN, and Ethernet), application (Short Haul, Metro, and Long Haul), organization size (SMEs and Large Enterprises), and regions
- To provide detailed information about the major factors, such as drivers, restraints, opportunities, and challenges, influencing the growth of the market
- To analyze the market�s subsegments with respect to the individual growth trends, prospects, and contributions to the total market
- To analyze the opportunities in the market for stakeholders and provide the competitive landscape of the market
- To forecast the revenue of the market�s segments with respect to 5 major regions, namely North America, Europe, Asia Pacific (APAC), Latin America, and Middle East and Africa (MEA)
- To profile the key players and comprehensively analyze their recent developments and positioning in the OWS market
- To analyse the competitive developments, such as mergers and acquisitions, new product developments, and R&D activities, in the market
Available Customizations
With the given market data, MarketsandMarkets offers customizations as per the company�s specific requirements. The following customization options are available for the report:
Service Analysis
- Service matrix provides detailed service information and comparisons
Geographic Analysis
- Further breakup of the North American Optical Wavelength Services market
- Further breakup of the European OWS market
- Further breakup of the APAC OWS market
- Further breakup of the MEA OWS market
- Further breakup of the Latin American OWS market
Company Information
- Detailed analysis and profiles of additional market players


Growth opportunities and latent adjacency in Optical Wavelength Services Market