Nut Ingredients Market by Type (Almonds, walnuts, Hazelnut, cashews), by Application (Confectioneries, Dairy products, Bakery products, Snacks & bars, Desserts, Cereals, Beverages), & by Region - Global Forecast to 2019


The nut ingredients market is projected to reach $22,642.1 Million by 2019, at a CAGR of 5.8% from 2014 to 2019. In terms of volume, the market is projected to reach 1,946.8 MT in 2014 at a CAGR of 5.7%.
The market has witnessed strong growth trends in the global food industry. The nut ingredients sector is evident of various innovations and developments in the forms and finished products by many key players. The growing focus on preventive health care and launch of healthier products has driven the global market. The cold chain logistics and technological advancements have also enabled the global trade of nut ingredients to a greater extent. Further, various associations and organizations promote export, research, education, and consumer awareness campaigns for growth of the market.
Nuts ingredients are exceedingly versatile in product formulation, therefore they are considered a preferred choice for food manufacturers and also for consumers as they provide both taste and impart health benefits. Every year, manufacturers are introducing new product introductions with almonds surpassing all other food introductions with nuts such as cashews and walnuts. The food categories wherein nut ingredients are included are snacks & bars, bakery products, confectioneries, beverages, cereals, desserts, and dairy products.
The European and North American regions are the largest and matured regions for the nut ingredients market. It has witnessed the fastest growth in emerging countries such as China and India. This report analyzes the market by type, application, and region. Geographically, the report is segmented into North America, Asia-Pacific, Europe, and Rest of the World (RoW). The types of nut ingredients studied are almonds, hazelnuts, walnuts, cashews, and others (artificial nuts, beechnuts, chestnuts, and chinquapin nuts). These nut ingredients are applicable for confectioneries, dairy products, bakery products, snacks & bars, desserts, cereals, beverages, and other applications (salads & sauces).
Nut Ingredients Market Size, by Region, 2014 vs. 2019
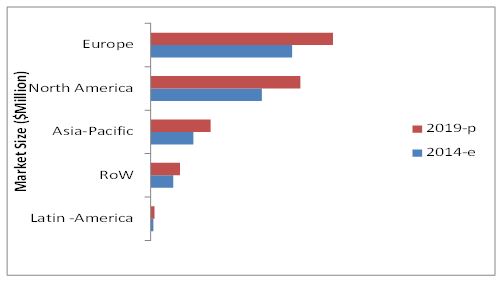
Source: Industry Journals, Related Publications, Company Publications, and MarketsandMarkets Analysis
The European region is the largest market for nut ingredients in terms of value, while North America is the second largest, followed by Asia-Pacific. Factors fuelling the growth in Asia-Pacific are due to the demand for premium foods positioned as healthy, which are becoming popular with all the generations. Further, the explosive growth of middle-class population, rapid urbanization, increased spending power, increase in the number of working women have spurred the demand for nut-based food & beverage products in these regions
The report provides qualitative analysis of leading nut Ingredients manufacturers in the market. It enumerates the development strategies preferred by leading market players to increase their share in this market. Key players such as Archer Daniels Midland Company (U.S.), Olam International Limited (Singapore), Barry Callebaut Group (Switzerland), Kerry Group (Ireland), and Kanegrade (U.K.) have been profiled in the report. The market dynamics in terms of market drivers, restraints, opportunities, and challenges have been discussed in detail in the report.
Scope of the Report
This report focuses on the nut ingredients market, which is segmented, based on type, application, and region, projecting the size and analyzing the trends in each of the following sub-markets.
On the basis of types, the market has been segmented as follows
- Almonds
- Hazelnuts
- Walnuts
- Cashews
- Others (artificial nuts, beechnuts, chestnuts, and chinquapin nuts)
On the basis of application, the market has been segmented as follows
- Confectioneries
- Dairy products
- Bakery products
- Snacks & Bars
- Desserts
- Cereals
- Beverages
- Others (Salads & Sauces)
On the basis of region, the market has been segmented as follows
- North America
- Europe
- Asia-Pacific
- Latin America
- RoW
The nut Ingredients market is projected to reach $22,642.1 Million by 2019, at a CAGR of 5.8% from 2014 to 2019.
The market is projected to grow at a substantial rate in the next five years. The nut ingredients category is expanding and is showing more functionality as an ingredient in food products. The market size is projected to increase due to the growing consumption of health-based packaged foods and innovations among the processed food products by food manufacturers. Emerging markets such as China & India, with increasing demand for health-based packaged foods are estimated to generate potential opportunities in this market. Nuts as ingredients are a win-win proposition as proven health benefits resonate with consumers, while versatility gives formulators to innovate.
The report provides detailed analysis of this market, which is segmented on the basis of types into almonds, hazelnuts, walnuts, cashews, and others (artificial nuts, beechnuts, chestnuts, and chinquapin nuts), which are applicable for confectioneries, dairy products, bakery products, snacks & bars, desserts, cereals, beverages, and other applications (salads & sauces).
Nut Ingredients Market Size, by Application, 2013 vs. 2019 ($Million)
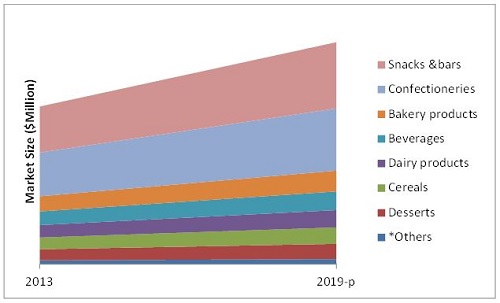
Source: Industry Journals, Related Publications, Company Publications, and MarketsandMarkets Analysis
Note: Others include (salads & sauces)
The snacks & bars application dominated the nut ingredients market in 2013. The snacks & bars application was dominant for nut ingredients in 2013 and growing at the highest rate. In the food category, snacks & bars are leading due to health and wellness trends. Consumers globally are looking for healthier and nutritious options that are free of pesticides, chemicals, and GMOs. Nut ingredients in snacks are ideal for snacks & bars category as consumers perceive them natural and healthy. The organic and natural snacks food category is a growing category in supermarkets around the world.
The report further provides qualitative analyses of the prominent market players and their preferred development strategies The key nut ingredient manufacturers in the market identified in this report are Archer Daniels Midland Company (U.S.), Olam International Limited (Singapore), Barry Callebaut Group (Switzerland), Kerry Group (Ireland), and Kanegrade (U.K.),
 Exclusive indicates content/data unique to MarketsandMarkets and not available with any competitors.
Table of Contents
1 Introduction (Page No. - 14)
1.1 Objectives of the Study
1.2 Market Definition
1.3 Study Scope
1.3.1 Nut Ingredients Market, By Type
1.3.2 By Form
1.3.3 By Application
1.3.4 By Region
1.3.5 Periodization Considered for this Market
1.4 Currency Considered for this Market
1.5 Package Size
1.6 Limitations
1.7 Stakeholders
2 Research Methodology (Page No. - 19)
2.1 Research Data
2.1.1 Secondary Data
2.1.1.1 Key Data From Secondary Sources
2.1.2 Primary Data
2.1.2.1 Key Data From Primary Sources
2.1.2.2 Key Industry Insights
2.1.2.3 Breakdown of Primary Interviews: By Company Type, Designation, & Region
2.2 Factor Analysis
2.2.1 Introduction
2.2.2 Demand-Side Analysis
2.2.2.1 Growth in Middle-Class Population in Developing Markets
2.2.2.2 Growth in Purchasing Power Parity in Emerging Markets
2.2.2.3 Ageing Population Demands Nut Ingredient-Based Food Products
2.2.2.4 Growth in Demand for Processed Foods
2.2.3 Supply-Side Analysis
2.2.3.1 Fluctuations in Raw Material Prices
2.3 Market Size Estimation
2.4 Market Breakdown & Data Triangulation
2.5 Research Assumptions
2.5.1 Assumptions
3 Executive Summary (Page No. - 33)
4 Premium Insights (Page No. - 36)
4.1 Attractive Opportunities in this Market
4.2 Nut Ingredients Market, By Product Type
4.3 Nut Ingredients Market in the Asia-Pacific Region in Value ($Million)
4.4 U.S. Dominates the Overall Nut Ingredients Market in Volume (MT) for 2013
4.5 Nut Ingredients Market, By Application, 2013
4.6 U.S. Dominated the Global Market, 2013 ($Million)
4.7 Nut Ingredients Market Life Cycle Analysis, By Region
5 Market Overview (Page No. - 43)
5.1 Introduction
5.2 Evolution
5.3 Market Segmentation
5.3.1 By Type
5.3.2 By Form
5.3.3 By Application
5.3.4 By Region
5.4 Market Dynamics
5.4.1 Drivers
5.4.1.1 Health & Wellness Trend and Growing Focus on Preventive Healthcare
5.4.1.2 Launch of Innovative Healthier Products
5.4.1.3 Associations & Organizations Promoting Nut Ingredients Industry
5.4.1.4 Technological Advancements Enabling Trade of Raw Material
5.4.2 Restraints
5.4.2.1 Allergies to Nut Ingredients
5.4.2.2 Rising Costs of Raw Material
5.4.3 Opportunities
5.4.3.1 Market Expansion in Emerging Economies
5.4.3.2 Increase in Potential for Diversification Into Other Application Sectors
5.4.4 Challenge
5.4.4.1 Maintaining Quality of Nuts in Supply Chain
6 Industry Trends (Page No. - 56)
6.1 Introduction
6.2 Supply Chain
6.3 Industry Insights
6.4 Tree Nuts: Pricing Trends
6.5 Porter’s Five Forces Analysis
6.5.1 Threat of New Entrants
6.5.2 Threat of Substitutes
6.5.3 Bargaining Power of Suppliers
6.5.4 Bargaining Power of Buyers
6.5.5 Intensity of Competitive Rivalry
6.6 Strategic Benchmarking
6.6.1 Strategic Acquisition & Expansion
7 Market, By Type (Page No. - 67)
7.1 Introduction
7.2 Almonds
7.3 Hazelnuts
7.4 Walnuts
7.5 Cashews
7.6 Others
8 Market, By Form (Page No. - 79)
8.1 Introduction
8.2 Roasted & Chopped
8.3 Other Forms of Nut Ingredients
9 Market, By Application (Page No. - 83)
9.1 Introduction
9.2 Confectioneries
9.3 Dairy Products
9.4 Bakery Products
9.5 Snacks & Bars
9.6 Desserts
9.7 Cereals
9.8 Beverages
9.9 Others
10 Market, By Region (Page No. - 96)
10.1 Introduction
10.2 North America
10.2.1 U.S.
10.2.2 Canada
10.2.3 Mexico
10.3 Europe
10.3.1 U.K.
10.3.2 Germany
10.3.3 France
10.3.4 Italy
10.3.5 Spain
10.3.6 The Netherlands
10.3.7 Belgium
10.3.8 Switzerland
10.3.9 Rest of Europe
10.4 Asia-Pacific
10.4.1 China
10.4.2 India
10.4.3 Japan
10.4.1 Australia
10.4.2 Korea
10.4.3 Rest of Asia-Pacific
10.5 Latin America
10.5.1 Brazil
10.5.2 Argentina
10.5.3 Rest of Latin America
10.6 Rest of the World (RoW)
10.6.1 Africa
10.6.2 The Middle East
10.6.3 Russia
10.6.4 Turkey
10.6.5 Others
11 Competitive Landscape (Page No. - 142)
11.1 Overview
11.2 Market Share Analysis
11.3 Competitive Situation & Trends
11.3.1 Acquisitions
11.3.2 Expansions & Investments
11.3.3 Product Launch
11.3.4 Other Developments
12 Company Profiles (Page No. - 149)
(Company at A Glance, Recent Financials, Products & Services, Strategies & Insights, & Recent Developments)*
12.1 Introduction
12.2 Archer Daniels Midland Company, U.S.
12.3 OLAM International Ltd.
12.4 Barry Callebaut Schweiz AG
12.5 Kerry Group
12.6 Kanegrade Limited
12.7 Groupe Soparind Bongrain (Fruisec)
12.8 The Hershey Company
12.9 Mars, Incorporated
12.10 Mondelez International, Inc.
12.11 Russell Stover Candies, Inc.
*Details on Company at A Glance, Recent Financials, Products & Services, Strategies & Insights, & Recent Developments Might Not Be Captured in Case of Unlisted Companies.
13 Appendix (Page No. - 182)
13.1 Insights of Experts
13.2 Discussion Guide
13.3 Introducing RT: Real-Time Market Intelligence
13.4 Available Customizations
13.5 Related Reports
List of Tables (105 Tables)
Table 1 Nut Product Introductions, By Nut Type, (Change From 2009 to 2011)
Table 2 Nut Ingredients Market Size, 2012-2019 (MT)
Table 3 Market Size, 2012-2019 ($Million)
Table 4 Almonds Nut Ingredients Market Size, 2012-2019 (MT)
Table 5 Almonds Nut Ingredients Market Size, 2012-2019 ($Million)
Table 6 Hazelnuts Ingredients Market Size, 2012-2019 (MT)
Table 7 Hazelnuts Nut Ingredients Market Size, 2012-2019 ($Million)
Table 8 Walnuts Nut Ingredients Market Size, 2012-2019 (MT)
Table 9 Walnuts Nut Ingredients Market Size, 2012-2019 ($Million)
Table 10 Cashews Nut Ingredients Market Size, 2012-2019 (MT)
Table 11 Cashews Nut Ingredients Market Size, 2012-2019 ($Million)
Table 12 Others: Nut Ingredients Market Size, 2012-2019 (MT)
Table 13 Others Nut Ingredients Market Size, 2012-2019 ($Million)
Table 14 Nut Ingredients Market Size, By Form, 2012–2019 (MT)
Table 15 Market Size, By Form, 2012–2019 ($Million)
Table 16 Roasted & Chopped Nut Ingredients Market Size, By Region, 2012–2019 (MT)
Table 17 Roasted & Chopped Nut Ingredients Market Size, By Region, 2012–2019 ($Millions)
Table 18 Other Nut Ingredient Forms Market Size, By Region, 2012–2019 (MT)
Table 19 Other Nut Ingredient Forms Market Size, By Region, 2012–2019 ($Million)
Table 20 Nut Ingredients Market Size, By Application, 2012-2019 (MT)
Table 21 Market Size, By Application, 2012-2019 ($Million)
Table 22 Confectioneries Market Size, By Region, 2012-2019 (MT)
Table 23 Confectioneries Market Size, By Region, 2012-2019 ($Million)
Table 24 Dairy Products Market Size, By Region, 2012-2019 (MT)
Table 25 Dairy Products Market Size, By Region, 2012-2019 ($Million)
Table 26 Bakery Products Market Size, By Region, 2012-2019 (MT)
Table 27 Bakery Products Market Size, By Region, 2012-2019 ($Million)
Table 28 Snacks & Bars Market Size, By Region, 2012-2019 (MT)
Table 29 Snacks & Bars Market Size, By Region, 2012-2019 ($Million)
Table 30 Desserts Market Size, By Region, 2012-2019 (MT)
Table 31 Desserts Market Size, By Region, 2012-2019 ($Million)
Table 32 Cereals Market Size, By Region, 2012-2019 (MT)
Table 33 Cereals Market Size, By Region, 2012-2019 ($Million)
Table 34 Beverages Market Size, By Region, 2012-2019 (MT)
Table 35 Beverages Market Size, By Region, 2012-2019 ($Million)
Table 36 Others Market Size, By Region, 2012-2019 (MT)
Table 37 Others Market Size, By Region, 2012-2019 ($Million)
Table 38 Global: Nut Ingredients Market Size, By Region, 2012-2019 (MT)
Table 39 Global : Market Size, By Region, 2012-2019 (Million)
Table 40 North America: Nut Ingredients Market Size, By Country, 2012-2019 (MT)
Table 41 North America: Market Size, By Country, 2012-2019 (Million)
Table 42 U.S.: Nut Ingredients Market Size, By Type, 2012-2019 (MT)
Table 43 U.S.: Market Size, By Type, 2012-2019 ($Million)
Table 44 Canada: Market Size, By Type, 2012-2019 (MT)
Table 45 Canada: Market Size, By Type, 2012-2019 ($Million)
Table 46 Mexico: Market Size, By Type, 2012-2019 (MT)
Table 47 Mexico: Market Size, By Type, 2012-2019 ($Million)
Table 48 Europe: Nut Ingredients Market Size, By Country, 2012-2019 (MT)
Table 49 Europe: Market Size, By Country, 2012-2019 ($Million)
Table 50 U.K.: Nut Ingredients Market Size, By Type, 2012-2019 (MT)
Table 51 U.K.: Market Size, By Type, 2012-2019 ($Million)
Table 52 Germany: Market Size, By Type 2012-2019 (MT)
Table 53 Germany: Market Size, By Type 2012-2019 ($Million)
Table 54 France: Market Size, By Type 2012-2019 (MT)
Table 55 France: Market Size, By Type 2012-2019 ($Million)
Table 56 Italy: Market Size, By Type 2012-2019 (MT)
Table 57 Italy: Market Size, By Type 2012-2019 ($Million)
Table 58 Spain: Nut Ingredients Market Size, By Type 2012-2019 (MT)
Table 59 Spain: Market Size, By Type 2012-2019 ($Million)
Table 60 The Netherlands: Nut Ingredients Market Size, By Type 2012-2019 (MT)
Table 61 The Netherlands: Market Size, By Type 2012-2019 ($Million)
Table 62 Belgium: Nut Ingredients Market Size, By Type 2012-2019 (MT)
Table 63 Belgium: Market Size, By Type 2012-2019 ($Million)
Table 64 Switzerland: Market Size, By Type 2012-2019 (MT)
Table 65 Switzerland: Market Size, By Type 2012-2019 ($Million)
Table 66 Rest of Europe: Nut Ingredients Market Size, By Type 2012-2019 (MT)
Table 67 Rest of Europe: Market Size, By Type 2012-2019 ($Million)
Table 68 Asia-Pacific: Nut Ingredients Market Size, By Geography, 2012-2019 (MT)
Table 69 Asia-Pacific: Market Size, By Geography, 2012-2019 ($Million)
Table 70 China: Nut Ingredients Market Size, By Type2012-2019 (MT)
Table 71 China: Market Size, By Type2012-2019 ($Million)
Table 72 India: Market Size, By Type 2012-2019 (MT)
Table 73 India: Market Size, By Type 2012-2019 ($Million)
Table 74 Japan: Market Size, By Type 2012-2019 (MT)
Table 75 Japan: Market Size, By Type 2012-2019 ($Million)
Table 76 Australia: Nut Ingredients Market Size, By Type 2012-2019 (MT)
Table 77 Australia: Market Size, By Type 2012-2019 ($Million)
Table 78 Korea: Nut Ingredients Market Size, By Type 2012-2019 (MT)
Table 79 Korea: Market Size, By Type 2012-2019 ($Million)
Table 80 Rest of Asia-Pacific: Nut Ingredients Market Size, By Type 2012-2019 (MT)
Table 81 Rest of Asia-Pacific: Market Size, By Type 2012-2019 ($Million)
Table 82 Latin America: Nut Ingredients Market Size, By Country, 2012-2019 (MT)
Table 83 Latin America: Market Size, By Country, 2012-2019 ($Million)
Table 84 Brazil: Nut Ingredients Market Size, By Type 2012-2019 (MT)
Table 85 Brazil: Market Size, By Type 2012-2019 ($Million)
Table 86 Argentina: Market Size, By Type 2012-2019 (MT)
Table 87 Argentina: Market Size, By Type 2012-2019 ($Million)
Table 88 Rest of Latin America: Nut Ingredients Market Size, By Type 2012-2019 (MT)
Table 89 Rest of Latin America: Market Size, By Type 2012-2019 ($Million)
Table 90 RoW: Nut Ingredients Market Size, By Geography, 2012-2019 (MT)
Table 91 RoW: Market Size, By Geography, 2012-2019 ($Million)
Table 92 Africa: Nut Ingredients Market Size, By Type 2012-2019 (MT)
Table 93 Africa: Market Size, By Type 2012-2019 ($Million)
Table 94 The Middle East: Nut Ingredients Market Size, By Type 2012-2019 (MT)
Table 95 The Middle East: Market Size, By Type 2012-2019 ($Million)
Table 96 Russia: Market Size, By Type 2012-2019 (MT)
Table 97 Russia: Market Size, By Type 2012-2019 ($Million)
Table 98 Turkey: Nut Ingredients Market Size, By Type 2012-2019 (MT)
Table 99 Turkey: Market Size, By Type 2012-2019 ($Million)
Table 100 Others: Nut Ingredients Market Size, By Type 2012-2019 (MT)
Table 101 Others: Market Size, By Type 2012-2019 ($Million)
Table 102 Acquisitions, 2011-2014
Table 103 Expansions, 2011-2014
Table 104 Product Launch, 2010-2014
Table 105 Other Developments, 2010-2014
List of Figures (61 Figures)
Figure 1 Nut Ingredients Market : Segmentation
Figure 2 Nut Ingredients Market: Research Design
Figure 3 Asia-Pacific Middle-Class Population Estimated to Garner the Largest Market Share By 2030
Figure 4 U.S., China, India, Japan & Germany are Top Five Economies Based on Gdp (Ppp) 2013
Figure 5 Ageing Population Growth (2014 vs. 2050)
Figure 6 Growth in Processed Foods (2013 vs. 2018)
Figure 7 Market Size Estimation Methodology: Bottom-Up Approach
Figure 8 Market Size Estimation Methodology: Top-Down Approach
Figure 9 Data Triangulation
Figure 10 Assumptions of the Research Study
Figure 11 North America: Largest Market for this Market in Terms of Volume (2014)
Figure 12 Almonds Dominated this Market (Volumes 2014–2019)
Figure 13 Snacks & Bars: A Highly Favored Application for this Market in 2014
Figure 14 Emerging Economies Offer Attractive Opportunities in this Market
Figure 15 The Walnut Nut Ingredients to Grow at A Highest Rate
Figure 16 Walnut Nut and Cashews Ingredients Captured the Largest Share in the Emerging Asia-Pacific Market in 2013
Figure 17 Developing Countries of Asia-Pacific Region are Projected to Be the Fastest-Growing Markets for Nut Ingredients
Figure 18 Snacks & Bar Segment Dominated this Market, By Application in Volume (MT) 2013
Figure 19 Emerging Markets to Grow Faster Than the Developed Markets
Figure 20 The Nut Ingredients Market in Asia-Pacific is Experiencing High Growth
Figure 21 Evolution of Nut Ingredients Market
Figure 22 Market Segmentation: By Type
Figure 23 Market Segmentation: By Form
Figure 24 Market Segmentation: By Application
Figure 25 Market Segmentation: By Region
Figure 26 Rising Health & Wellness Trend & Focus on Preventive Healthcare is the Key Driver of this Market
Figure 27 Global Import of Almonds, Shelled Basis, (2007-2012) (MT)
Figure 28 Health & Wellness Trend & Launch of Healthier Food Products Drive the Market
Figure 29 Processors are Vital Components of the Supply Chain
Figure 30 Industry Players are Acquiring Companies to Gain Market Share
Figure 31 Nut Prices Soar High, 2012-2015
Figure 32 Porter’s Five Forces Analysis
Figure 33 Strategic Acquisition & Expansion of Key Companies
Figure 34 Almond World Trade Data Overview (2008-2012)
Figure 35 Walnuts World Trade Data Overview (2008-2012)
Figure 36 Snacks & Bars Segment Dominated the Global Market, By Application (2013)
Figure 37 Geographic Snapshot (2014–2019): Asia-Pacific Countries are Emerging Markets
Figure 38 North America is the Largest Market in Terms of Volume in 2013
Figure 39 Europe is the Largest Growing Market in Terms of Value From 2014 to 2019
Figure 40 Germany is the Largest Market ($Million) for Nut Ingredients in Europe From 2014 to 2019
Figure 41 Asia-Pacific is the Fastest-Growing Market From 2014 to 2019
Figure 42 China is the Fastest-Growing Country for Nut Ingredients in Asia-Pacific From 2014 to 2019
Figure 43 Companies Adopted Expansion & Investment as the Key Growth Strategy Over the Last Five Years
Figure 44 Nut Ingredients Market Share, By Key Company, 2014
Figure 45 Expansion & Investment Fueled Growth & Innovation (2012-2015)
Figure 46 Battle for Market Share: Expansion & Investment Was the Most Popular Growth Strategy
Figure 47 Geographical Revenue Mix of Nut Ingredient Manufacturers & End Users
Figure 48 Archer Daniels Midland Company: Company Snapshot
Figure 49 Archer Daniels Midland Company : SWOT Analysis
Figure 50 OLAM International Limited. : Company Snapshot
Figure 51 OLAM International Limited. : SWOT Analysis
Figure 52 Barry Callebaut Schweiz AG: Company Snapshot
Figure 53 Barry Callebaut Schweiz AG: SWOT Analysis
Figure 54 Kerry Group: Company Snapshot
Figure 55 Kanegrade Limited : Company Snapshot
Figure 56 Groupe Soparind Bongrain (Fruisec): Company Snapshot
Figure 57 The Hershey Company : Snapshot
Figure 58 The Hershey Company: SWOT Analysis
Figure 59 Mars, Inc.: SWOT Analysis
Figure 60 Mondelez International, Inc.: Company Snapshot
Figure 61 Mondelez International, Inc.: SWOT Analysis


Growth opportunities and latent adjacency in Nut Ingredients Market